
 Login Sign Up


| |||||
 |  | ||||

| 12Stocks.com Market Intelligence |
Best SmallCap Stocks
|
| In a hurry? Small Cap Stock Lists: Performance Trends Table, Stock Charts
Sort Small Cap stocks: Daily, Weekly, Year-to-Date, Market Cap & Trends. Filter Small Cap stocks list by sector: Show all, Tech, Finance, Energy, Staples, Retail, Industrial, Materials, Utilities and HealthCare Filter Small Cap stocks list by size: All Large Medium Small and MicroCap |
| 12Stocks.com Small Cap Stocks Performances & Trends Daily | |||||||||
|
|  The overall Smart Investing & Trading Score is 63 (0-bearish to 100-bullish) which puts Small Cap index in short term neutral to bullish trend. The Smart Investing & Trading Score from previous trading session is 58 and an improvement of trend continues.
| ||||||||
Here are the Smart Investing & Trading Scores of the most requested small cap stocks at 12Stocks.com (click stock name for detailed review):
|


| 12Stocks.com: Investing in Smallcap Index with Stocks | |
|
The following table helps investors and traders sort through current performance and trends (as measured by Smart Investing & Trading Score) of various
stocks in the Smallcap Index. Quick View: Move mouse or cursor over stock symbol (ticker) to view short-term technical chart and over stock name to view long term chart. Click on  to add stock symbol to your watchlist and to add stock symbol to your watchlist and  to view watchlist. Click on any ticker or stock name for detailed market intelligence report for that stock. to view watchlist. Click on any ticker or stock name for detailed market intelligence report for that stock. |
12Stocks.com Performance of Stocks in Smallcap Index
| Ticker | Stock Name | Watchlist | Category | Recent Price | Smart Investing & Trading Score | Change % | YTD Change% |
| XERS | Xeris |   | Health Care | 1.74 | 20 | -2.25% | -26.11% |
| MMI | Marcus & Millichap | | Financials | 32.26 | 49 | -0.31% | -26.14% |
| MDXG | MiMedx Group | | Health Care | 6.47 | 29 | -0.54% | -26.17% |
| PWSC | PowerSchool | | Technology | 17.43 | 18 | -1.39% | -26.25% |
| COOK | Traeger | | Services & Goods | 2.08 | 44 | -2.80% | -26.37% |
| ERII | Energy Recovery | | Industrials | 13.86 | 42 | -0.22% | -26.43% |
| SRDX | Surmodics | | Health Care | 26.69 | 50 | -0.85% | -26.57% |
| RLGT | Radiant Logistics | | Transports | 4.87 | 28 | -0.61% | -26.66% |
| WTI | W&T Offshore | | Energy | 2.39 | 27 | -0.42% | -26.69% |
| BW | Babcock & Wilcox Enterprises | | Industrials | 1.07 | 27 | 16.66% | -26.71% |
| EGBN | Eagle Bancorp | | Financials | 22.08 | 67 | -0.85% | -26.74% |
| NWFL | Norwood Financial | | Financials | 24.11 | 42 | -1.99% | -26.74% |
| SES | SES AI | | Services & Goods | 1.31 | 17 | 1.55% | -26.82% |
| UUUU | Energy Fuels | | Materials | 5.26 | 0 | -0.75% | -26.84% |
| MSEX | Middlesex Water | | Utilities | 47.99 | 67 | -0.52% | -26.87% |
| ALGT | Allegiant Travel | | Transports | 60.33 | 18 | -2.12% | -26.98% |
| ZURA | Zura Bio | | Health Care | 3.42 | 66 | -1.16% | -27.00% |
| GMRE | Global Medical | | Industrials | 8.10 | 35 | -1.58% | -27.03% |
| SMRT | SmartRent | | Technology | 2.33 | 27 | 0.22% | -27.12% |
| HLIT | Harmonic | | Technology | 9.49 | 10 | -0.89% | -27.19% |
| JACK | Jack in | | Services & Goods | 59.44 | 28 | 1.75% | -27.19% |
| SNFCA | Security National | | Financials | 6.55 | 17 | 0.00% | -27.22% |
| IRWD | Ironwood | | Health Care | 8.32 | 64 | 0.12% | -27.27% |
| RLYB | Rallybio | | Health Care | 1.72 | 81 | -6.79% | -27.33% |
| BCRX | BioCryst | | Health Care | 4.34 | 20 | -0.91% | -27.55% |
| For chart view version of above stock list: Chart View ➞ 0 - 25 , 25 - 50 , 50 - 75 , 75 - 100 , 100 - 125 , 125 - 150 , 150 - 175 , 175 - 200 , 200 - 225 , 225 - 250 , 250 - 275 , 275 - 300 , 300 - 325 , 325 - 350 , 350 - 375 , 375 - 400 , 400 - 425 , 425 - 450 , 450 - 475 , 475 - 500 , 500 - 525 , 525 - 550 , 550 - 575 , 575 - 600 , 600 - 625 , 625 - 650 , 650 - 675 , 675 - 700 , 700 - 725 , 725 - 750 , 750 - 775 , 775 - 800 , 800 - 825 , 825 - 850 , 850 - 875 , 875 - 900 , 900 - 925 , 925 - 950 , 950 - 975 , 975 - 1000 , 1000 - 1025 , 1025 - 1050 , 1050 - 1075 , 1075 - 1100 , 1100 - 1125 , 1125 - 1150 , 1150 - 1175 , 1175 - 1200 , 1200 - 1225 , 1225 - 1250 , 1250 - 1275 , 1275 - 1300 , 1300 - 1325 , 1325 - 1350 , 1350 - 1375 , 1375 - 1400 , 1400 - 1425 , 1425 - 1450 | ||
 | Click To Change The Sort Order: By Market Cap or Company Size Performance: Year-to-date, Week and Day |  |
| Too many stocks? View smallcap stocks filtered by marketcap & sector |
| Marketcap: All SmallCap Stocks (default-no microcap), Large, Mid-Range, Small |
| Smallcap Sector: Tech, Finance, Energy, Staples, Retail, Industrial, Materials, & Medical |
|
Get the most comprehensive stock market coverage daily at 12Stocks.com ➞ Best Stocks Today ➞ Best Stocks Weekly ➞ Best Stocks Year-to-Date ➞ Best Stocks Trends ➞  Best Stocks Today 12Stocks.com Best Nasdaq Stocks ➞ Best S&P 500 Stocks ➞ Best Tech Stocks ➞ Best Biotech Stocks ➞ |
| Detailed Overview of SmallCap Stocks |
| SmallCap Technical Overview, Leaders & Laggards, Top SmallCap ETF Funds & Detailed SmallCap Stocks List, Charts, Trends & More |
| Smallcap: Technical Analysis, Trends & YTD Performance | |
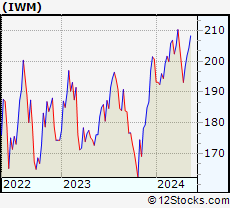
| SmallCap segment as represented by
IWM, an exchange-traded fund [ETF], holds basket of thousands of smallcap stocks from across all major sectors of the US stock market. The smallcap index (contains stocks like Riverbed & Sotheby's) is down by -1.22% and is currently underperforming the overall market by -7% year-to-date. Below is a quick view of technical charts and trends: | |
 IWM Weekly Chart |
|
| Long Term Trend: Good | |
| Medium Term Trend: Not Good | |
 IWM Daily Chart |
|
| Short Term Trend: Very Good | |
| Overall Trend Score: 63 | |
| YTD Performance: -1.22% | |
| **Trend Scores & Views Are Only For Educational Purposes And Not For Investing | |
| 12Stocks.com: Top Performing Small Cap Index Stocks | ||||||||||||||||||||||||||||||||||||||||||||||||
 The top performing Small Cap Index stocks year to date are
Now, more recently, over last week, the top performing Small Cap Index stocks on the move are


|
||||||||||||||||||||||||||||||||||||||||||||||||
| 12Stocks.com: Investing in Smallcap Index using Exchange Traded Funds | |
|
The following table shows list of key exchange traded funds (ETF) that
help investors track Smallcap index. The following list also includes leveraged ETF funds that track twice or thrice the daily returns of Smallcap indices. Short or inverse ETF funds move in the opposite direction to the index they track and are useful during market pullbacks or during bear markets. Quick View: Move mouse or cursor over ETF symbol (ticker) to view short-term technical chart and over ETF name to view long term chart. Click on ticker or stock name for detailed view. Click on to add stock symbol to your watchlist and to view watchlist. |
12Stocks.com List of ETFs that track Smallcap Index
| Ticker | ETF Name | Watchlist | Recent Price | Smart Investing & Trading Score | Change % | Week % | Year-to-date % |
| IWM | iShares Russell 2000 | | 198.27 | 63 | -0.15 | 2.66 | -1.22% |
| IJR | iShares Core S&P Small-Cap | | 105.72 | 85 | -0.23 | 2.42 | -2.34% |
| IWN | iShares Russell 2000 Value | | 151.29 | 75 | -0.30 | 2.38 | -2.6% |
| IWO | iShares Russell 2000 Growth | | 252.75 | 58 | 0.15 | 3.04 | 0.21% |
| 12Stocks.com: Charts, Trends, Fundamental Data and Performances of SmallCap Stocks | |
|
We now take in-depth look at all SmallCap stocks including charts, multi-period performances and overall trends (as measured by Smart Investing & Trading Score). One can sort SmallCap stocks (click link to choose) by Daily, Weekly and by Year-to-Date performances. Also, one can sort by size of the company or by market capitalization. |
| Select Your Default Chart Type: | |||||
| |||||
| Click on stock symbol or name for detailed view. Click on to add stock symbol to your watchlist and to view watchlist. Quick View: Move mouse or cursor over "Daily" to quickly view daily technical stock chart and over "Weekly" to view weekly technical stock chart. | |||||

 | XERS Xeris Pharmaceuticals, Inc. |
| Sector: Health Care | |
| SubSector: Biotechnology | |
| MarketCap: 74.5785 Millions | |
| Recent Price: 1.74 Smart Investing & Trading Score: 20 | |
| Day Percent Change: -2.25% Day Change: -0.04 | |
| Week Change: 0.58% Year-to-date Change: -26.1% | |
| XERS Links: Profile News Message Board | |
| Charts:- Daily , Weekly | |
| Add XERS to Watchlist: View: Get Complete XERS Trend Analysis ➞ | |
 | MMI Marcus & Millichap, Inc. |
| Sector: Financials | |
| SubSector: Real Estate Development | |
| MarketCap: 1005.19 Millions | |
| Recent Price: 32.26 Smart Investing & Trading Score: 49 | |
| Day Percent Change: -0.31% Day Change: -0.10 | |
| Week Change: 4% Year-to-date Change: -26.1% | |
| MMI Links: Profile News Message Board | |
| Charts:- Daily , Weekly | |
| Add MMI to Watchlist: View: Get Complete MMI Trend Analysis ➞ | |
 | MDXG MiMedx Group, Inc. |
| Sector: Health Care | |
| SubSector: Medical Appliances & Equipment | |
| MarketCap: 371.08 Millions | |
| Recent Price: 6.47 Smart Investing & Trading Score: 29 | |
| Day Percent Change: -0.54% Day Change: -0.04 | |
| Week Change: 2.94% Year-to-date Change: -26.2% | |
| MDXG Links: Profile News Message Board | |
| Charts:- Daily , Weekly | |
| Add MDXG to Watchlist: View: Get Complete MDXG Trend Analysis ➞ | |
 | PWSC PowerSchool Holdings, Inc. |
| Sector: Technology | |
| SubSector: Software - Application | |
| MarketCap: 3870 Millions | |
| Recent Price: 17.43 Smart Investing & Trading Score: 18 | |
| Day Percent Change: -1.39% Day Change: -0.25 | |
| Week Change: -0.14% Year-to-date Change: -26.3% | |
| PWSC Links: Profile News Message Board | |
| Charts:- Daily , Weekly | |
| Add PWSC to Watchlist: View: Get Complete PWSC Trend Analysis ➞ | |
 | COOK Traeger, Inc. |
| Sector: Services & Goods | |
| SubSector: Furnishings, Fixtures & Appliances | |
| MarketCap: 524 Millions | |
| Recent Price: 2.08 Smart Investing & Trading Score: 44 | |
| Day Percent Change: -2.80% Day Change: -0.06 | |
| Week Change: -1.42% Year-to-date Change: -26.4% | |
| COOK Links: Profile News Message Board | |
| Charts:- Daily , Weekly | |
| Add COOK to Watchlist: View: Get Complete COOK Trend Analysis ➞ | |
 | ERII Energy Recovery, Inc. |
| Sector: Industrials | |
| SubSector: Pollution & Treatment Controls | |
| MarketCap: 429.375 Millions | |
| Recent Price: 13.86 Smart Investing & Trading Score: 42 | |
| Day Percent Change: -0.22% Day Change: -0.03 | |
| Week Change: 1.09% Year-to-date Change: -26.4% | |
| ERII Links: Profile News Message Board | |
| Charts:- Daily , Weekly | |
| Add ERII to Watchlist: View: Get Complete ERII Trend Analysis ➞ | |
 | SRDX Surmodics, Inc. |
| Sector: Health Care | |
| SubSector: Diagnostic Substances | |
| MarketCap: 388.171 Millions | |
| Recent Price: 26.69 Smart Investing & Trading Score: 50 | |
| Day Percent Change: -0.85% Day Change: -0.23 | |
| Week Change: 0.76% Year-to-date Change: -26.6% | |
| SRDX Links: Profile News Message Board | |
| Charts:- Daily , Weekly | |
| Add SRDX to Watchlist: View: Get Complete SRDX Trend Analysis ➞ | |
 | RLGT Radiant Logistics, Inc. |
| Sector: Transports | |
| SubSector: Air Delivery & Freight Services | |
| MarketCap: 180.868 Millions | |
| Recent Price: 4.87 Smart Investing & Trading Score: 28 | |
| Day Percent Change: -0.61% Day Change: -0.03 | |
| Week Change: -1.22% Year-to-date Change: -26.7% | |
| RLGT Links: Profile News Message Board | |
| Charts:- Daily , Weekly | |
| Add RLGT to Watchlist: View: Get Complete RLGT Trend Analysis ➞ | |
 | WTI W&T Offshore, Inc. |
| Sector: Energy | |
| SubSector: Oil & Gas Drilling & Exploration | |
| MarketCap: 244.539 Millions | |
| Recent Price: 2.39 Smart Investing & Trading Score: 27 | |
| Day Percent Change: -0.42% Day Change: -0.01 | |
| Week Change: -0.83% Year-to-date Change: -26.7% | |
| WTI Links: Profile News Message Board | |
| Charts:- Daily , Weekly | |
| Add WTI to Watchlist: View: Get Complete WTI Trend Analysis ➞ | |
 | BW Babcock & Wilcox Enterprises, Inc. |
| Sector: Industrials | |
| SubSector: Industrial Electrical Equipment | |
| MarketCap: 59.0879 Millions | |
| Recent Price: 1.07 Smart Investing & Trading Score: 27 | |
| Day Percent Change: 16.66% Day Change: 0.15 | |
| Week Change: 15.31% Year-to-date Change: -26.7% | |
| BW Links: Profile News Message Board | |
| Charts:- Daily , Weekly | |
| Add BW to Watchlist: View: Get Complete BW Trend Analysis ➞ | |
 | EGBN Eagle Bancorp, Inc. |
| Sector: Financials | |
| SubSector: Regional - Mid-Atlantic Banks | |
| MarketCap: 906.559 Millions | |
| Recent Price: 22.08 Smart Investing & Trading Score: 67 | |
| Day Percent Change: -0.85% Day Change: -0.19 | |
| Week Change: 2.13% Year-to-date Change: -26.7% | |
| EGBN Links: Profile News Message Board | |
| Charts:- Daily , Weekly | |
| Add EGBN to Watchlist: View: Get Complete EGBN Trend Analysis ➞ | |
 | NWFL Norwood Financial Corp. |
| Sector: Financials | |
| SubSector: Regional - Northeast Banks | |
| MarketCap: 201.899 Millions | |
| Recent Price: 24.11 Smart Investing & Trading Score: 42 | |
| Day Percent Change: -1.99% Day Change: -0.49 | |
| Week Change: -0.74% Year-to-date Change: -26.7% | |
| NWFL Links: Profile News Message Board | |
| Charts:- Daily , Weekly | |
| Add NWFL to Watchlist: View: Get Complete NWFL Trend Analysis ➞ | |
 | SES SES AI Corporation |
| Sector: Services & Goods | |
| SubSector: Auto Parts | |
| MarketCap: 893 Millions | |
| Recent Price: 1.31 Smart Investing & Trading Score: 17 | |
| Day Percent Change: 1.55% Day Change: 0.02 | |
| Week Change: 3.15% Year-to-date Change: -26.8% | |
| SES Links: Profile News Message Board | |
| Charts:- Daily , Weekly | |
| Add SES to Watchlist: View: Get Complete SES Trend Analysis ➞ | |
 | UUUU Energy Fuels Inc. |
| Sector: Materials | |
| SubSector: Industrial Metals & Minerals | |
| MarketCap: 107.61 Millions | |
| Recent Price: 5.26 Smart Investing & Trading Score: 0 | |
| Day Percent Change: -0.75% Day Change: -0.04 | |
| Week Change: -9.93% Year-to-date Change: -26.8% | |
| UUUU Links: Profile News Message Board | |
| Charts:- Daily , Weekly | |
| Add UUUU to Watchlist: View: Get Complete UUUU Trend Analysis ➞ | |
 | MSEX Middlesex Water Company |
| Sector: Utilities | |
| SubSector: Water Utilities | |
| MarketCap: 1082.02 Millions | |
| Recent Price: 47.99 Smart Investing & Trading Score: 67 | |
| Day Percent Change: -0.52% Day Change: -0.25 | |
| Week Change: -0.02% Year-to-date Change: -26.9% | |
| MSEX Links: Profile News Message Board | |
| Charts:- Daily , Weekly | |
| Add MSEX to Watchlist: View: Get Complete MSEX Trend Analysis ➞ | |
 | ALGT Allegiant Travel Company |
| Sector: Transports | |
| SubSector: Regional Airlines | |
| MarketCap: 1317.7 Millions | |
| Recent Price: 60.33 Smart Investing & Trading Score: 18 | |
| Day Percent Change: -2.12% Day Change: -1.30 | |
| Week Change: -3.19% Year-to-date Change: -27.0% | |
| ALGT Links: Profile News Message Board | |
| Charts:- Daily , Weekly | |
| Add ALGT to Watchlist: View: Get Complete ALGT Trend Analysis ➞ | |
 | ZURA Zura Bio Limited |
| Sector: Health Care | |
| SubSector: Biotechnology | |
| MarketCap: 242 Millions | |
| Recent Price: 3.42 Smart Investing & Trading Score: 66 | |
| Day Percent Change: -1.16% Day Change: -0.04 | |
| Week Change: 3.32% Year-to-date Change: -27.0% | |
| ZURA Links: Profile News Message Board | |
| Charts:- Daily , Weekly | |
| Add ZURA to Watchlist: View: Get Complete ZURA Trend Analysis ➞ | |
 | GMRE Global Medical REIT Inc. |
| Sector: Industrials | |
| SubSector: Conglomerates | |
| MarketCap: 529.748 Millions | |
| Recent Price: 8.10 Smart Investing & Trading Score: 35 | |
| Day Percent Change: -1.58% Day Change: -0.13 | |
| Week Change: -1.1% Year-to-date Change: -27.0% | |
| GMRE Links: Profile News Message Board | |
| Charts:- Daily , Weekly | |
| Add GMRE to Watchlist: View: Get Complete GMRE Trend Analysis ➞ | |
 | SMRT SmartRent, Inc. |
| Sector: Technology | |
| SubSector: Software - Application | |
| MarketCap: 733 Millions | |
| Recent Price: 2.33 Smart Investing & Trading Score: 27 | |
| Day Percent Change: 0.22% Day Change: 0.01 | |
| Week Change: 1.53% Year-to-date Change: -27.1% | |
| SMRT Links: Profile News Message Board | |
| Charts:- Daily , Weekly | |
| Add SMRT to Watchlist: View: Get Complete SMRT Trend Analysis ➞ | |
 | HLIT Harmonic Inc. |
| Sector: Technology | |
| SubSector: Communication Equipment | |
| MarketCap: 533.539 Millions | |
| Recent Price: 9.49 Smart Investing & Trading Score: 10 | |
| Day Percent Change: -0.89% Day Change: -0.09 | |
| Week Change: -1.91% Year-to-date Change: -27.2% | |
| HLIT Links: Profile News Message Board | |
| Charts:- Daily , Weekly | |
| Add HLIT to Watchlist: View: Get Complete HLIT Trend Analysis ➞ | |
 | JACK Jack in the Box Inc. |
| Sector: Services & Goods | |
| SubSector: Restaurants | |
| MarketCap: 633.87 Millions | |
| Recent Price: 59.44 Smart Investing & Trading Score: 28 | |
| Day Percent Change: 1.75% Day Change: 1.03 | |
| Week Change: -0.34% Year-to-date Change: -27.2% | |
| JACK Links: Profile News Message Board | |
| Charts:- Daily , Weekly | |
| Add JACK to Watchlist: View: Get Complete JACK Trend Analysis ➞ | |
 | SNFCA Security National Financial Corporation |
| Sector: Financials | |
| SubSector: Credit Services | |
| MarketCap: 81.0208 Millions | |
| Recent Price: 6.55 Smart Investing & Trading Score: 17 | |
| Day Percent Change: 0.00% Day Change: 0.00 | |
| Week Change: -1.06% Year-to-date Change: -27.2% | |
| SNFCA Links: Profile News Message Board | |
| Charts:- Daily , Weekly | |
| Add SNFCA to Watchlist: View: Get Complete SNFCA Trend Analysis ➞ | |
 | IRWD Ironwood Pharmaceuticals, Inc. |
| Sector: Health Care | |
| SubSector: Drugs - Generic | |
| MarketCap: 1616.35 Millions | |
| Recent Price: 8.32 Smart Investing & Trading Score: 64 | |
| Day Percent Change: 0.12% Day Change: 0.01 | |
| Week Change: 5.05% Year-to-date Change: -27.3% | |
| IRWD Links: Profile News Message Board | |
| Charts:- Daily , Weekly | |
| Add IRWD to Watchlist: View: Get Complete IRWD Trend Analysis ➞ | |
 | RLYB Rallybio Corporation |
| Sector: Health Care | |
| SubSector: Biotechnology | |
| MarketCap: 226 Millions | |
| Recent Price: 1.72 Smart Investing & Trading Score: 81 | |
| Day Percent Change: -6.79% Day Change: -0.13 | |
| Week Change: -2.56% Year-to-date Change: -27.3% | |
| RLYB Links: Profile News Message Board | |
| Charts:- Daily , Weekly | |
| Add RLYB to Watchlist: View: Get Complete RLYB Trend Analysis ➞ | |
 | BCRX BioCryst Pharmaceuticals, Inc. |
| Sector: Health Care | |
| SubSector: Biotechnology | |
| MarketCap: 369.385 Millions | |
| Recent Price: 4.34 Smart Investing & Trading Score: 20 | |
| Day Percent Change: -0.91% Day Change: -0.04 | |
| Week Change: -2.03% Year-to-date Change: -27.6% | |
| BCRX Links: Profile News Message Board | |
| Charts:- Daily , Weekly | |
| Add BCRX to Watchlist: View: Get Complete BCRX Trend Analysis ➞ | |
| For tabular summary view of above stock list: Summary View ➞ 0 - 25 , 25 - 50 , 50 - 75 , 75 - 100 , 100 - 125 , 125 - 150 , 150 - 175 , 175 - 200 , 200 - 225 , 225 - 250 , 250 - 275 , 275 - 300 , 300 - 325 , 325 - 350 , 350 - 375 , 375 - 400 , 400 - 425 , 425 - 450 , 450 - 475 , 475 - 500 , 500 - 525 , 525 - 550 , 550 - 575 , 575 - 600 , 600 - 625 , 625 - 650 , 650 - 675 , 675 - 700 , 700 - 725 , 725 - 750 , 750 - 775 , 775 - 800 , 800 - 825 , 825 - 850 , 850 - 875 , 875 - 900 , 900 - 925 , 925 - 950 , 950 - 975 , 975 - 1000 , 1000 - 1025 , 1025 - 1050 , 1050 - 1075 , 1075 - 1100 , 1100 - 1125 , 1125 - 1150 , 1150 - 1175 , 1175 - 1200 , 1200 - 1225 , 1225 - 1250 , 1250 - 1275 , 1275 - 1300 , 1300 - 1325 , 1325 - 1350 , 1350 - 1375 , 1375 - 1400 , 1400 - 1425 , 1425 - 1450 | ||
| Click To Change The Sort Order: By Market Cap or Company Size Performance: Year-to-date, Week and Day | |
| Select Chart Type: | ||
| Too many stocks? View smallcap stocks filtered by marketcap & sector |
| Marketcap: All SmallCap Stocks (default-no microcap), Large, Mid-Range, Small & MicroCap |
| Sector: Tech, Finance, Energy, Staples, Retail, Industrial, Materials, Utilities & Medical |
|
Best Stocks Today 12Stocks.com |
© 2024 12Stocks.com Terms & Conditions Privacy Contact Us
All Information Provided Only For Education And Not To Be Used For Investing or Trading. See Terms & Conditions


One More Thing ... Get Best Stocks Delivered Daily!
Never Ever Miss A Move With Our Top Ten Stocks Lists
Find Best Stocks In Any Market - Bull or Bear Market
Take A Peek At Our Top Ten Stocks Lists: Daily, Weekly, Year-to-Date & Top Trends
Find Best Stocks In Any Market - Bull or Bear Market
Take A Peek At Our Top Ten Stocks Lists: Daily, Weekly, Year-to-Date & Top Trends
Smallcap Stocks With Best Up Trends [0-bearish to 100-bullish]: Trustmark [100], Riot Blockchain[100], Uniti Group[100], Napco Security[100], Mueller Industries[100], Sanmina [100], AeroVironment [100], NextNav [100], Oscar Health[100], Glaukos [100], Jackson Financial[100]
Best Smallcap Stocks Year-to-Date:
Janux [362.73%], Viking [259.7%], Alpine Immune[239.34%], Longboard [234.29%], Avidity Biosciences[182.02%], Super Micro[174.8%], Vera [149.48%], Hippo [133.81%], Trevi [119.4%], Veritone [113.74%], MicroStrategy [110.11%] Best Smallcap Stocks This Week:
Matterport [162.93%], B. Riley[46.37%], Riot Blockchain[36.04%], Seres [35.61%], Cipher Mining[27.6%], SoundHound AI[24.51%], ProKidney [23.28%], Hibbett Sports[20.97%], BigBear.ai [20.34%], Marathon Patent[20.06%], Powell Industries[20.04%] Best Smallcap Stocks Daily:
B. Riley[34.71%], Babcock & Wilcox Enterprises[16.66%], Powell Industries[9.12%], Navitas Semiconductor[9.09%], Sage [8.88%], K12 [8.04%], Maxeon Solar[6.63%], Recursion [6.57%], Trustmark [6.28%], Group 1[6.16%], Innodata [6.10%]