
 Login Sign Up


| |||||
 |  | ||||

| 12Stocks.com Market Intelligence |
Best SmallCap Stocks
|
| In a hurry? Small Cap Stock Lists: Performance Trends Table, Stock Charts
Sort Small Cap stocks: Daily, Weekly, Year-to-Date, Market Cap & Trends. Filter Small Cap stocks list by sector: Show all, Tech, Finance, Energy, Staples, Retail, Industrial, Materials, Utilities and HealthCare Filter Small Cap stocks list by size: All Large Medium Small and MicroCap |
| 12Stocks.com Small Cap Stocks Performances & Trends Daily | |||||||||
|
|  The overall Smart Investing & Trading Score is 58 (0-bearish to 100-bullish) which puts Small Cap index in short term neutral trend. The Smart Investing & Trading Score from previous trading session is 63 and hence a deterioration of trend.
| ||||||||
Here are the Smart Investing & Trading Scores of the most requested small cap stocks at 12Stocks.com (click stock name for detailed review):
|


| 12Stocks.com: Investing in Smallcap Index with Stocks | |
|
The following table helps investors and traders sort through current performance and trends (as measured by Smart Investing & Trading Score) of various
stocks in the Smallcap Index. Quick View: Move mouse or cursor over stock symbol (ticker) to view short-term technical chart and over stock name to view long term chart. Click on  to add stock symbol to your watchlist and to add stock symbol to your watchlist and  to view watchlist. Click on any ticker or stock name for detailed market intelligence report for that stock. to view watchlist. Click on any ticker or stock name for detailed market intelligence report for that stock. |
12Stocks.com Performance of Stocks in Smallcap Index
| Ticker | Stock Name | Watchlist | Category | Recent Price | Smart Investing & Trading Score | Change % | YTD Change% |
| GFF | Griffon |   | Industrials | 67.81 | 65 | -1.84% | 11.26% |
| COGT | Cogint | | Technology | 6.54 | 12 | -6.03% | 11.22% |
| KOD | Kodiak Sciences | | Health Care | 3.38 | 10 | 1.50% | 11.18% |
| CWST | Casella Waste | | Industrials | 94.99 | 76 | -0.46% | 11.15% |
| DM | Dominion Midstream | | Energy | 0.83 | 25 | -2.34% | 11.13% |
| B | Barnes Group | | Industrials | 36.26 | 61 | 0.00% | 11.12% |
| PTVE | Pactiv Evergreen | | Services & Goods | 15.24 | 93 | 1.60% | 11.08% |
| FGEN | FibroGen | | Health Care | 0.98 | 20 | -8.01% | 11.06% |
| AVO | Mission Produce | | Consumer Staples | 11.23 | 36 | -1.32% | 10.97% |
| IIIV | i3 Verticals | | Technology | 23.46 | 95 | -0.04% | 10.82% |
| CVI | CVR Energy | | Energy | 33.57 | 32 | -0.36% | 10.79% |
| GMS | GMS | | Industrials | 91.32 | 63 | -1.55% | 10.78% |
| BHE | Benchmark Electronics | | Technology | 30.59 | 100 | 0.13% | 10.67% |
| OUT | Outfront Media | | Services & Goods | 15.45 | 68 | 0.19% | 10.67% |
| NX | Quanex Building | | Industrials | 33.70 | 36 | -3.02% | 10.24% |
| EAT | Brinker | | Services & Goods | 47.59 | 100 | -0.85% | 10.21% |
| MODN | Model N | | Technology | 29.65 | 71 | 0.00% | 10.10% |
| ABUS | Arbutus Biopharma | | Health Care | 2.75 | 43 | 2.23% | 10.00% |
| BHR | Braemar Hotels | | Financials | 2.75 | 93 | -1.43% | 10.00% |
| URBN | Urban Outfitters | | Services & Goods | 39.19 | 75 | -0.43% | 9.81% |
| HWKN | Hawkins | | Materials | 77.20 | 63 | 0.32% | 9.63% |
| STER | Sterling Check | | Technology | 15.27 | 56 | -0.29% | 9.62% |
| GLNG | Golar LNG | | Transports | 25.18 | 55 | -1.41% | 9.53% |
| CHRD | Chord Energy | | Energy | 182.72 | 61 | -0.24% | 9.50% |
| NR | Newpark Resources | | Energy | 7.26 | 26 | -0.95% | 9.34% |


| Too many stocks? View smallcap stocks filtered by marketcap & sector |
| Marketcap: All SmallCap Stocks (default-no microcap), Large, Mid-Range, Small |
| Smallcap Sector: Tech, Finance, Energy, Staples, Retail, Industrial, Materials, & Medical |
|
Get the most comprehensive stock market coverage daily at 12Stocks.com ➞ Best Stocks Today ➞ Best Stocks Weekly ➞ Best Stocks Year-to-Date ➞ Best Stocks Trends ➞  Best Stocks Today 12Stocks.com Best Nasdaq Stocks ➞ Best S&P 500 Stocks ➞ Best Tech Stocks ➞ Best Biotech Stocks ➞ |
| Detailed Overview of SmallCap Stocks |
| SmallCap Technical Overview, Leaders & Laggards, Top SmallCap ETF Funds & Detailed SmallCap Stocks List, Charts, Trends & More |
| Smallcap: Technical Analysis, Trends & YTD Performance | |
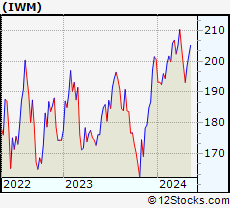
| SmallCap segment as represented by
IWM, an exchange-traded fund [ETF], holds basket of thousands of smallcap stocks from across all major sectors of the US stock market. The smallcap index (contains stocks like Riverbed & Sotheby's) is down by -1.51% and is currently underperforming the overall market by -7.17% year-to-date. Below is a quick view of technical charts and trends: | |
 IWM Weekly Chart |
|
| Long Term Trend: Good | |
| Medium Term Trend: Not Good | |
 IWM Daily Chart |
|
| Short Term Trend: Very Good | |
| Overall Trend Score: 58 | |
| YTD Performance: -1.51% | |
| **Trend Scores & Views Are Only For Educational Purposes And Not For Investing | |
| 12Stocks.com: Top Performing Small Cap Index Stocks | ||||||||||||||||||||||||||||||||||||||||||||||||
 The top performing Small Cap Index stocks year to date are
Now, more recently, over last week, the top performing Small Cap Index stocks on the move are


|
||||||||||||||||||||||||||||||||||||||||||||||||
| 12Stocks.com: Investing in Smallcap Index using Exchange Traded Funds | |
|
The following table shows list of key exchange traded funds (ETF) that
help investors track Smallcap index. The following list also includes leveraged ETF funds that track twice or thrice the daily returns of Smallcap indices. Short or inverse ETF funds move in the opposite direction to the index they track and are useful during market pullbacks or during bear markets. Quick View: Move mouse or cursor over ETF symbol (ticker) to view short-term technical chart and over ETF name to view long term chart. Click on ticker or stock name for detailed view. Click on to add stock symbol to your watchlist and to view watchlist. |
12Stocks.com List of ETFs that track Smallcap Index
| Ticker | ETF Name | Watchlist | Recent Price | Smart Investing & Trading Score | Change % | Week % | Year-to-date % |
| IWM | iShares Russell 2000 | | 197.68 | 58 | -0.45 | 2.35 | -1.51% |
| IJR | iShares Core S&P Small-Cap | | 105.71 | 85 | -0.24 | 2.41 | -2.35% |
| VTWO | Vanguard Russell 2000 ETF | | 79.93 | 48 | -0.45 | 2.37 | -1.44% |
| IWN | iShares Russell 2000 Value | | 151.28 | 75 | -0.30 | 2.37 | -2.61% |
| IWO | iShares Russell 2000 Growth | | 251.27 | 58 | -0.44 | 2.44 | -0.38% |
| IJS | iShares S&P Small-Cap 600 Value | | 97.71 | 45 | -0.43 | 2.2 | -5.2% |
| IJT | iShares S&P Small-Cap 600 Growth | | 125.37 | 48 | -0.28 | 2.59 | 0.18% |
| XSLV | PowerShares S&P SmallCap Low Volatil ETF | | 42.94 | 48 | -0.26 | 1.8 | -2.74% |
| SBB | ProShares Short SmallCap600 | | 16.37 | 33 | -0.02 | -2.79 | 2.76% |
| SMLV | SPDR SSGA US Small Cap Low Volatil ETF | | 108.43 | 73 | -0.31 | 2.21 | -3.63% |
| SAA | ProShares Ultra SmallCap600 | | 23.01 | 58 | -0.60 | 5.55 | -7.78% |
| SDD | ProShares UltraShort SmallCap600 | | 19.49 | 42 | 1.35 | -4.18 | 5.77% |
| 12Stocks.com: Charts, Trends, Fundamental Data and Performances of SmallCap Stocks | |
|
We now take in-depth look at all SmallCap stocks including charts, multi-period performances and overall trends (as measured by Smart Investing & Trading Score). One can sort SmallCap stocks (click link to choose) by Daily, Weekly and by Year-to-Date performances. Also, one can sort by size of the company or by market capitalization. |
| Select Your Default Chart Type: | |||||
| |||||
| Click on stock symbol or name for detailed view. Click on to add stock symbol to your watchlist and to view watchlist. Quick View: Move mouse or cursor over "Daily" to quickly view daily technical stock chart and over "Weekly" to view weekly technical stock chart. | |||||

 | GFF Griffon Corporation |
| Sector: Industrials | |
| SubSector: General Building Materials | |
| MarketCap: 616 Millions | |
| Recent Price: 67.81 Smart Investing & Trading Score: 65 | |
| Day Percent Change: -1.84% Day Change: -1.27 | |
| Week Change: 2.79% Year-to-date Change: 11.3% | |
| GFF Links: Profile News Message Board | |
| Charts:- Daily , Weekly | |
| Add GFF to Watchlist: View: Get Complete GFF Trend Analysis ➞ | |
 | COGT Cogint, Inc. |
| Sector: Technology | |
| SubSector: Business Software & Services | |
| MarketCap: 214.55 Millions | |
| Recent Price: 6.54 Smart Investing & Trading Score: 12 | |
| Day Percent Change: -6.03% Day Change: -0.42 | |
| Week Change: -2.53% Year-to-date Change: 11.2% | |
| COGT Links: Profile News Message Board | |
| Charts:- Daily , Weekly | |
| Add COGT to Watchlist: View: Get Complete COGT Trend Analysis ➞ | |
 | KOD Kodiak Sciences Inc. |
| Sector: Health Care | |
| SubSector: Biotechnology | |
| MarketCap: 2132.15 Millions | |
| Recent Price: 3.38 Smart Investing & Trading Score: 10 | |
| Day Percent Change: 1.50% Day Change: 0.05 | |
| Week Change: 0.6% Year-to-date Change: 11.2% | |
| KOD Links: Profile News Message Board | |
| Charts:- Daily , Weekly | |
| Add KOD to Watchlist: View: Get Complete KOD Trend Analysis ➞ | |
 | CWST Casella Waste Systems, Inc. |
| Sector: Industrials | |
| SubSector: Waste Management | |
| MarketCap: 2093.38 Millions | |
| Recent Price: 94.99 Smart Investing & Trading Score: 76 | |
| Day Percent Change: -0.46% Day Change: -0.44 | |
| Week Change: 1.67% Year-to-date Change: 11.2% | |
| CWST Links: Profile News Message Board | |
| Charts:- Daily , Weekly | |
| Add CWST to Watchlist: View: Get Complete CWST Trend Analysis ➞ | |
 | DM Dominion Midstream Partners, LP |
| Sector: Energy | |
| SubSector: Oil & Gas Pipelines | |
| MarketCap: 3017.01 Millions | |
| Recent Price: 0.83 Smart Investing & Trading Score: 25 | |
| Day Percent Change: -2.34% Day Change: -0.02 | |
| Week Change: -1.18% Year-to-date Change: 11.1% | |
| DM Links: Profile News Message Board | |
| Charts:- Daily , Weekly | |
| Add DM to Watchlist: View: Get Complete DM Trend Analysis ➞ | |
 | B Barnes Group Inc. |
| Sector: Industrials | |
| SubSector: Industrial Equipment & Components | |
| MarketCap: 2189.79 Millions | |
| Recent Price: 36.26 Smart Investing & Trading Score: 61 | |
| Day Percent Change: 0.00% Day Change: 0.00 | |
| Week Change: 1.4% Year-to-date Change: 11.1% | |
| B Links: Profile News Message Board | |
| Charts:- Daily , Weekly | |
| Add B to Watchlist: View: Get Complete B Trend Analysis ➞ | |
 | PTVE Pactiv Evergreen Inc. |
| Sector: Services & Goods | |
| SubSector: Packaging & Containers | |
| MarketCap: 33427 Millions | |
| Recent Price: 15.24 Smart Investing & Trading Score: 93 | |
| Day Percent Change: 1.60% Day Change: 0.24 | |
| Week Change: 5.76% Year-to-date Change: 11.1% | |
| PTVE Links: Profile News Message Board | |
| Charts:- Daily , Weekly | |
| Add PTVE to Watchlist: View: Get Complete PTVE Trend Analysis ➞ | |
 | FGEN FibroGen, Inc. |
| Sector: Health Care | |
| SubSector: Biotechnology | |
| MarketCap: 2502.95 Millions | |
| Recent Price: 0.98 Smart Investing & Trading Score: 20 | |
| Day Percent Change: -8.01% Day Change: -0.09 | |
| Week Change: -14.41% Year-to-date Change: 11.1% | |
| FGEN Links: Profile News Message Board | |
| Charts:- Daily , Weekly | |
| Add FGEN to Watchlist: View: Get Complete FGEN Trend Analysis ➞ | |
 | AVO Mission Produce, Inc. |
| Sector: Consumer Staples | |
| SubSector: Farm Products | |
| MarketCap: 91347 Millions | |
| Recent Price: 11.23 Smart Investing & Trading Score: 36 | |
| Day Percent Change: -1.32% Day Change: -0.15 | |
| Week Change: -2.52% Year-to-date Change: 11.0% | |
| AVO Links: Profile News Message Board | |
| Charts:- Daily , Weekly | |
| Add AVO to Watchlist: View: Get Complete AVO Trend Analysis ➞ | |
 | IIIV i3 Verticals, Inc. |
| Sector: Technology | |
| SubSector: Business Software & Services | |
| MarketCap: 448.458 Millions | |
| Recent Price: 23.46 Smart Investing & Trading Score: 95 | |
| Day Percent Change: -0.04% Day Change: -0.01 | |
| Week Change: 5.11% Year-to-date Change: 10.8% | |
| IIIV Links: Profile News Message Board | |
| Charts:- Daily , Weekly | |
| Add IIIV to Watchlist: View: Get Complete IIIV Trend Analysis ➞ | |
 | CVI CVR Energy, Inc. |
| Sector: Energy | |
| SubSector: Oil & Gas Refining & Marketing | |
| MarketCap: 2482.14 Millions | |
| Recent Price: 33.57 Smart Investing & Trading Score: 32 | |
| Day Percent Change: -0.36% Day Change: -0.12 | |
| Week Change: 2.29% Year-to-date Change: 10.8% | |
| CVI Links: Profile News Message Board | |
| Charts:- Daily , Weekly | |
| Add CVI to Watchlist: View: Get Complete CVI Trend Analysis ➞ | |
 | GMS GMS Inc. |
| Sector: Industrials | |
| SubSector: General Building Materials | |
| MarketCap: 587.753 Millions | |
| Recent Price: 91.32 Smart Investing & Trading Score: 63 | |
| Day Percent Change: -1.55% Day Change: -1.44 | |
| Week Change: 1.19% Year-to-date Change: 10.8% | |
| GMS Links: Profile News Message Board | |
| Charts:- Daily , Weekly | |
| Add GMS to Watchlist: View: Get Complete GMS Trend Analysis ➞ | |
 | BHE Benchmark Electronics, Inc. |
| Sector: Technology | |
| SubSector: Printed Circuit Boards | |
| MarketCap: 766.835 Millions | |
| Recent Price: 30.59 Smart Investing & Trading Score: 100 | |
| Day Percent Change: 0.13% Day Change: 0.04 | |
| Week Change: 3.24% Year-to-date Change: 10.7% | |
| BHE Links: Profile News Message Board | |
| Charts:- Daily , Weekly | |
| Add BHE to Watchlist: View: Get Complete BHE Trend Analysis ➞ | |
 | OUT Outfront Media Inc. |
| Sector: Services & Goods | |
| SubSector: Marketing Services | |
| MarketCap: 1388.15 Millions | |
| Recent Price: 15.45 Smart Investing & Trading Score: 68 | |
| Day Percent Change: 0.19% Day Change: 0.03 | |
| Week Change: 4.18% Year-to-date Change: 10.7% | |
| OUT Links: Profile News Message Board | |
| Charts:- Daily , Weekly | |
| Add OUT to Watchlist: View: Get Complete OUT Trend Analysis ➞ | |
 | NX Quanex Building Products Corporation |
| Sector: Industrials | |
| SubSector: General Building Materials | |
| MarketCap: 315.453 Millions | |
| Recent Price: 33.70 Smart Investing & Trading Score: 36 | |
| Day Percent Change: -3.02% Day Change: -1.05 | |
| Week Change: -2.71% Year-to-date Change: 10.2% | |
| NX Links: Profile News Message Board | |
| Charts:- Daily , Weekly | |
| Add NX to Watchlist: View: Get Complete NX Trend Analysis ➞ | |
 | EAT Brinker International, Inc. |
| Sector: Services & Goods | |
| SubSector: Restaurants | |
| MarketCap: 435.97 Millions | |
| Recent Price: 47.59 Smart Investing & Trading Score: 100 | |
| Day Percent Change: -0.85% Day Change: -0.41 | |
| Week Change: 5.22% Year-to-date Change: 10.2% | |
| EAT Links: Profile News Message Board | |
| Charts:- Daily , Weekly | |
| Add EAT to Watchlist: View: Get Complete EAT Trend Analysis ➞ | |
 | MODN Model N, Inc. |
| Sector: Technology | |
| SubSector: Application Software | |
| MarketCap: 670.162 Millions | |
| Recent Price: 29.65 Smart Investing & Trading Score: 71 | |
| Day Percent Change: 0.00% Day Change: 0.00 | |
| Week Change: 0.1% Year-to-date Change: 10.1% | |
| MODN Links: Profile News Message Board | |
| Charts:- Daily , Weekly | |
| Add MODN to Watchlist: View: Get Complete MODN Trend Analysis ➞ | |
 | ABUS Arbutus Biopharma Corporation |
| Sector: Health Care | |
| SubSector: Biotechnology | |
| MarketCap: 110.885 Millions | |
| Recent Price: 2.75 Smart Investing & Trading Score: 43 | |
| Day Percent Change: 2.23% Day Change: 0.06 | |
| Week Change: 1.1% Year-to-date Change: 10.0% | |
| ABUS Links: Profile News Message Board | |
| Charts:- Daily , Weekly | |
| Add ABUS to Watchlist: View: Get Complete ABUS Trend Analysis ➞ | |
 | BHR Braemar Hotels & Resorts, Inc. |
| Sector: Financials | |
| SubSector: REIT - Hotel/Motel | |
| MarketCap: 88.9434 Millions | |
| Recent Price: 2.75 Smart Investing & Trading Score: 93 | |
| Day Percent Change: -1.43% Day Change: -0.04 | |
| Week Change: 19.57% Year-to-date Change: 10.0% | |
| BHR Links: Profile News Message Board | |
| Charts:- Daily , Weekly | |
| Add BHR to Watchlist: View: Get Complete BHR Trend Analysis ➞ | |
 | URBN Urban Outfitters, Inc. |
| Sector: Services & Goods | |
| SubSector: Apparel Stores | |
| MarketCap: 1638.08 Millions | |
| Recent Price: 39.19 Smart Investing & Trading Score: 75 | |
| Day Percent Change: -0.43% Day Change: -0.17 | |
| Week Change: 5.98% Year-to-date Change: 9.8% | |
| URBN Links: Profile News Message Board | |
| Charts:- Daily , Weekly | |
| Add URBN to Watchlist: View: Get Complete URBN Trend Analysis ➞ | |
 | HWKN Hawkins, Inc. |
| Sector: Materials | |
| SubSector: Specialty Chemicals | |
| MarketCap: 398.957 Millions | |
| Recent Price: 77.20 Smart Investing & Trading Score: 63 | |
| Day Percent Change: 0.32% Day Change: 0.25 | |
| Week Change: 3.44% Year-to-date Change: 9.6% | |
| HWKN Links: Profile News Message Board | |
| Charts:- Daily , Weekly | |
| Add HWKN to Watchlist: View: Get Complete HWKN Trend Analysis ➞ | |
 | STER Sterling Check Corp. |
| Sector: Technology | |
| SubSector: Software - Infrastructure | |
| MarketCap: 1180 Millions | |
| Recent Price: 15.27 Smart Investing & Trading Score: 56 | |
| Day Percent Change: -0.29% Day Change: -0.04 | |
| Week Change: 1.94% Year-to-date Change: 9.6% | |
| STER Links: Profile News Message Board | |
| Charts:- Daily , Weekly | |
| Add STER to Watchlist: View: Get Complete STER Trend Analysis ➞ | |
 | GLNG Golar LNG Limited |
| Sector: Transports | |
| SubSector: Shipping | |
| MarketCap: 854.414 Millions | |
| Recent Price: 25.18 Smart Investing & Trading Score: 55 | |
| Day Percent Change: -1.41% Day Change: -0.36 | |
| Week Change: 0.04% Year-to-date Change: 9.5% | |
| GLNG Links: Profile News Message Board | |
| Charts:- Daily , Weekly | |
| Add GLNG to Watchlist: View: Get Complete GLNG Trend Analysis ➞ | |
 | CHRD Chord Energy Corporation |
| Sector: Energy | |
| SubSector: Oil & Gas E&P | |
| MarketCap: 6280 Millions | |
| Recent Price: 182.72 Smart Investing & Trading Score: 61 | |
| Day Percent Change: -0.24% Day Change: -0.44 | |
| Week Change: 1.51% Year-to-date Change: 9.5% | |
| CHRD Links: Profile News Message Board | |
| Charts:- Daily , Weekly | |
| Add CHRD to Watchlist: View: Get Complete CHRD Trend Analysis ➞ | |
 | NR Newpark Resources, Inc. |
| Sector: Energy | |
| SubSector: Oil & Gas Equipment & Services | |
| MarketCap: 109.261 Millions | |
| Recent Price: 7.26 Smart Investing & Trading Score: 26 | |
| Day Percent Change: -0.95% Day Change: -0.07 | |
| Week Change: -1.76% Year-to-date Change: 9.3% | |
| NR Links: Profile News Message Board | |
| Charts:- Daily , Weekly | |
| Add NR to Watchlist: View: Get Complete NR Trend Analysis ➞ | |
| Too many stocks? View smallcap stocks filtered by marketcap & sector |
| Marketcap: All SmallCap Stocks (default-no microcap), Large, Mid-Range, Small & MicroCap |
| Sector: Tech, Finance, Energy, Staples, Retail, Industrial, Materials, Utilities & Medical |
|
Best Stocks Today 12Stocks.com |
© 2024 12Stocks.com Terms & Conditions Privacy Contact Us
All Information Provided Only For Education And Not To Be Used For Investing or Trading. See Terms & Conditions


One More Thing ... Get Best Stocks Delivered Daily!
Never Ever Miss A Move With Our Top Ten Stocks Lists
Find Best Stocks In Any Market - Bull or Bear Market
Take A Peek At Our Top Ten Stocks Lists: Daily, Weekly, Year-to-Date & Top Trends
Find Best Stocks In Any Market - Bull or Bear Market
Take A Peek At Our Top Ten Stocks Lists: Daily, Weekly, Year-to-Date & Top Trends
Smallcap Stocks With Best Up Trends [0-bearish to 100-bullish]: B. Riley[100], Ribbon [100], Group 1[100], Trustmark [100], MBIA [100], Integer [100], EchoStar [100], Comstock Resources[100], Vishay Inter[100], Jamf Holding[100], SunOpta [100]
Best Smallcap Stocks Year-to-Date:
CareMax [574.23%], Janux [352.07%], Viking [249.65%], Alpine Immune[239.13%], Longboard [223.4%], Avidity Biosciences[177.71%], Arcutis Bio[170.9%], Super Micro[165.5%], Vera [149.61%], Hippo [130.79%], Y-mAbs [124.19%] Best Smallcap Stocks This Week:
Matterport [166.09%], B. Riley[48.82%], Seres [30.29%], Riot Blockchain[30.12%], CareMax [27.24%], Ribbon [25.97%], ProKidney [23.28%], SoundHound AI[22.54%], Cipher Mining[22.14%], Hibbett Sports[21.61%], Cullinan Oncology[20.69%] Best Smallcap Stocks Daily:
B. Riley[36.97%], Ribbon [26.46%], Babcock & Wilcox Enterprises[15.57%], Cullinan Oncology[13.55%], Amneal [12.04%], Comtech Tele[10.76%], Innodata [10.28%], Gritstone Oncology[10.06%], Navitas Semiconductor[8.83%], Eyenovia [8.68%], K12 [8.64%]