
 Login Sign Up


| |||||
 |  | ||||

| 12Stocks.com Market Intelligence |
Best SmallCap Stocks
|
| In a hurry? Small Cap Stock Lists: Performance Trends Table, Stock Charts
Sort Small Cap stocks: Daily, Weekly, Year-to-Date, Market Cap & Trends. Filter Small Cap stocks list by sector: Show all, Tech, Finance, Energy, Staples, Retail, Industrial, Materials, Utilities and HealthCare Filter Small Cap stocks list by size: All Large Medium Small and MicroCap |
| 12Stocks.com Small Cap Stocks Performances & Trends Daily | |||||||||
|
|  The overall Smart Investing & Trading Score is 69 (0-bearish to 100-bullish) which puts Small Cap index in short term neutral to bullish trend. The Smart Investing & Trading Score from previous trading session is 49 and hence an improvement of trend.
| ||||||||
Here are the Smart Investing & Trading Scores of the most requested small cap stocks at 12Stocks.com (click stock name for detailed review):
|


| 12Stocks.com: Investing in Smallcap Index with Stocks | |
|
The following table helps investors and traders sort through current performance and trends (as measured by Smart Investing & Trading Score) of various
stocks in the Smallcap Index. Quick View: Move mouse or cursor over stock symbol (ticker) to view short-term technical chart and over stock name to view long term chart. Click on  to add stock symbol to your watchlist and to add stock symbol to your watchlist and  to view watchlist. Click on any ticker or stock name for detailed market intelligence report for that stock. to view watchlist. Click on any ticker or stock name for detailed market intelligence report for that stock. |
12Stocks.com Performance of Stocks in Smallcap Index
| Ticker | Stock Name | Watchlist | Category | Recent Price | Smart Investing & Trading Score | Change % | Weekly Change% |
| PRO | PROS |   | Technology | 33.30 | 32 | -0.54% | -2.00% |
| ZIP | ZipRecruiter | | Industrials | 10.15 | 20 | -1.22% | -2.03% |
| ZETA | Zeta Global | | Technology | 12.63 | 85 | 1.53% | -2.06% |
| CMP | Compass Minerals | | Materials | 12.77 | 52 | 0.47% | -2.07% |
| KGS | Kodiak Gas | | Energy | 27.31 | 76 | 0.77% | -2.08% |
| DO | Diamond Offshore | | Energy | 12.92 | 68 | 2.54% | -2.12% |
| IRTC | iRhythm | | Health Care | 109.54 | 8 | -1.21% | -2.12% |
| APLE | Apple Hospitality | | Financials | 14.68 | 18 | 0.03% | -2.17% |
| SDRL | Seadrill | | Energy | 49.00 | 58 | 1.75% | -2.35% |
| FSS | Federal Signal | | Industrials | 81.88 | 38 | -0.52% | -2.38% |
| RHP | Ryman Hospitality | | Financials | 104.47 | 17 | -0.33% | -2.42% |
| YELP | Yelp | | Technology | 39.82 | 43 | -0.45% | -2.45% |
| PRLD | Prelude | | Health Care | 3.97 | 37 | -0.50% | -2.46% |
| SANM | Sanmina | | Technology | 61.41 | 54 | -0.13% | -2.48% |
| MGRC | McGrath RentCorp | | Transports | 108.93 | 39 | 0.25% | -2.49% |
| VAL | Valaris | | Energy | 67.45 | 58 | 3.70% | -2.52% |
| MNRO | Monro | | Consumer Staples | 27.09 | 35 | 0.56% | -2.52% |
| EIG | Employers | | Financials | 42.89 | 22 | -0.72% | -2.54% |
| HGV | Hilton Grand | | Services & Goods | 43.20 | 42 | 0.19% | -2.57% |
| BECN | Beacon Roofing | | Industrials | 96.44 | 41 | -1.11% | -2.59% |
| VRNS | Varonis Systems | | Technology | 44.13 | 42 | -0.14% | -2.65% |
| EXPO | Exponent | | Services & Goods | 92.59 | 83 | 0.19% | -2.75% |
| ACVA | ACV Auctions | | Services & Goods | 17.59 | 32 | 1.30% | -2.76% |
| FWRD | Forward Air | | Transports | 21.63 | 37 | 2.41% | -2.87% |
| WRBY | Warby Parker | | Health Care | 12.54 | 37 | 2.16% | -2.94% |
| For chart view version of above stock list: Chart View ➞ 0 - 25 , 25 - 50 , 50 - 75 , 75 - 100 , 100 - 125 , 125 - 150 , 150 - 175 , 175 - 200 , 200 - 225 , 225 - 250 , 250 - 275 , 275 - 300 , 300 - 325 , 325 - 350 , 350 - 375 , 375 - 400 , 400 - 425 , 425 - 450 , 450 - 475 , 475 - 500 , 500 - 525 , 525 - 550 , 550 - 575 , 575 - 600 , 600 - 625 , 625 - 650 , 650 - 675 , 675 - 700 | ||
 | Click To Change The Sort Order: By Market Cap or Company Size Performance: Year-to-date, Week and Day |  |
| Too many stocks? View smallcap stocks filtered by marketcap & sector |
| Marketcap: All SmallCap Stocks (default-no microcap), Large, Mid-Range, Small |
| Smallcap Sector: Tech, Finance, Energy, Staples, Retail, Industrial, Materials, & Medical |
|
Get the most comprehensive stock market coverage daily at 12Stocks.com ➞ Best Stocks Today ➞ Best Stocks Weekly ➞ Best Stocks Year-to-Date ➞ Best Stocks Trends ➞  Best Stocks Today 12Stocks.com Best Nasdaq Stocks ➞ Best S&P 500 Stocks ➞ Best Tech Stocks ➞ Best Biotech Stocks ➞ |
| Detailed Overview of SmallCap Stocks |
| SmallCap Technical Overview, Leaders & Laggards, Top SmallCap ETF Funds & Detailed SmallCap Stocks List, Charts, Trends & More |
| Smallcap: Technical Analysis, Trends & YTD Performance | |
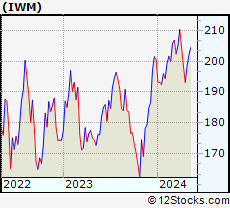
| SmallCap segment as represented by
IWM, an exchange-traded fund [ETF], holds basket of thousands of smallcap stocks from across all major sectors of the US stock market. The smallcap index (contains stocks like Riverbed & Sotheby's) is up by 0.22% and is currently underperforming the overall market by -6.27% year-to-date. Below is a quick view of technical charts and trends: | |
 IWM Weekly Chart |
|
| Long Term Trend: Not Good | |
| Medium Term Trend: Very Good | |
 IWM Daily Chart |
|
| Short Term Trend: Very Good | |
| Overall Trend Score: 69 | |
| YTD Performance: 0.22% | |
| **Trend Scores & Views Are Only For Educational Purposes And Not For Investing | |
| 12Stocks.com: Top Performing Small Cap Index Stocks | ||||||||||||||||||||||||||||||||||||||||||||||||
 The top performing Small Cap Index stocks year to date are
Now, more recently, over last week, the top performing Small Cap Index stocks on the move are


|
||||||||||||||||||||||||||||||||||||||||||||||||
| 12Stocks.com: Investing in Smallcap Index using Exchange Traded Funds | |
|
The following table shows list of key exchange traded funds (ETF) that
help investors track Smallcap index. The following list also includes leveraged ETF funds that track twice or thrice the daily returns of Smallcap indices. Short or inverse ETF funds move in the opposite direction to the index they track and are useful during market pullbacks or during bear markets. Quick View: Move mouse or cursor over ETF symbol (ticker) to view short-term technical chart and over ETF name to view long term chart. Click on ticker or stock name for detailed view. Click on to add stock symbol to your watchlist and to view watchlist. |
12Stocks.com List of ETFs that track Smallcap Index
| Ticker | ETF Name | Watchlist | Recent Price | Smart Investing & Trading Score | Change % | Week % | Year-to-date % |
| IWM | iShares Russell 2000 | | 201.15 | 69 | 0.61 | 1.39 | 0.22% |
| IJR | iShares Core S&P Small-Cap | | 106.83 | 82 | 0.47 | 1.12 | -1.31% |
| SDD | ProShares UltraShort SmallCap600 | | 18.35 | 10 | -4.97 | -5.17 | -0.42% |
| SBB | ProShares Short SmallCap600 | | 16.33 | 41 | -0.25 | -0.34 | 2.51% |
| SAA | ProShares Ultra SmallCap600 | | 23.93 | 82 | 4.36 | 3.88 | -4.07% |
| 12Stocks.com: Charts, Trends, Fundamental Data and Performances of SmallCap Stocks | |
|
We now take in-depth look at all SmallCap stocks including charts, multi-period performances and overall trends (as measured by Smart Investing & Trading Score). One can sort SmallCap stocks (click link to choose) by Daily, Weekly and by Year-to-Date performances. Also, one can sort by size of the company or by market capitalization. |
| Select Your Default Chart Type: | |||||
| |||||
| Click on stock symbol or name for detailed view. Click on to add stock symbol to your watchlist and to view watchlist. Quick View: Move mouse or cursor over "Daily" to quickly view daily technical stock chart and over "Weekly" to view weekly technical stock chart. | |||||

 | PRO PROS Holdings, Inc. |
| Sector: Technology | |
| SubSector: Application Software | |
| MarketCap: 1357.42 Millions | |
| Recent Price: 33.30 Smart Investing & Trading Score: 32 | |
| Day Percent Change: -0.54% Day Change: -0.18 | |
| Week Change: -2% Year-to-date Change: -14.2% | |
| PRO Links: Profile News Message Board | |
| Charts:- Daily , Weekly | |
| Add PRO to Watchlist: View: Get Complete PRO Trend Analysis ➞ | |
 | ZIP ZipRecruiter, Inc. |
| Sector: Industrials | |
| SubSector: Staffing & Employment Services | |
| MarketCap: 1730 Millions | |
| Recent Price: 10.15 Smart Investing & Trading Score: 20 | |
| Day Percent Change: -1.22% Day Change: -0.13 | |
| Week Change: -2.03% Year-to-date Change: -27.6% | |
| ZIP Links: Profile News Message Board | |
| Charts:- Daily , Weekly | |
| Add ZIP to Watchlist: View: Get Complete ZIP Trend Analysis ➞ | |
 | ZETA Zeta Global Holdings Corp. |
| Sector: Technology | |
| SubSector: Software - Application | |
| MarketCap: 1780 Millions | |
| Recent Price: 12.63 Smart Investing & Trading Score: 85 | |
| Day Percent Change: 1.53% Day Change: 0.19 | |
| Week Change: -2.06% Year-to-date Change: 43.1% | |
| ZETA Links: Profile News Message Board | |
| Charts:- Daily , Weekly | |
| Add ZETA to Watchlist: View: Get Complete ZETA Trend Analysis ➞ | |
 | CMP Compass Minerals International, Inc. |
| Sector: Materials | |
| SubSector: Industrial Metals & Minerals | |
| MarketCap: 1512.1 Millions | |
| Recent Price: 12.77 Smart Investing & Trading Score: 52 | |
| Day Percent Change: 0.47% Day Change: 0.06 | |
| Week Change: -2.07% Year-to-date Change: -49.6% | |
| CMP Links: Profile News Message Board | |
| Charts:- Daily , Weekly | |
| Add CMP to Watchlist: View: Get Complete CMP Trend Analysis ➞ | |
 | KGS Kodiak Gas Services, LLC |
| Sector: Energy | |
| SubSector: Oil & Gas Equipment & Services | |
| MarketCap: 1220 Millions | |
| Recent Price: 27.31 Smart Investing & Trading Score: 76 | |
| Day Percent Change: 0.77% Day Change: 0.21 | |
| Week Change: -2.08% Year-to-date Change: 36.7% | |
| KGS Links: Profile News Message Board | |
| Charts:- Daily , Weekly | |
| Add KGS to Watchlist: View: Get Complete KGS Trend Analysis ➞ | |
 | DO Diamond Offshore Drilling, Inc. |
| Sector: Energy | |
| SubSector: Oil & Gas Drilling | |
| MarketCap: 1340 Millions | |
| Recent Price: 12.92 Smart Investing & Trading Score: 68 | |
| Day Percent Change: 2.54% Day Change: 0.32 | |
| Week Change: -2.12% Year-to-date Change: -1.2% | |
| DO Links: Profile News Message Board | |
| Charts:- Daily , Weekly | |
| Add DO to Watchlist: View: Get Complete DO Trend Analysis ➞ | |
 | IRTC iRhythm Technologies, Inc. |
| Sector: Health Care | |
| SubSector: Medical Instruments & Supplies | |
| MarketCap: 2167.9 Millions | |
| Recent Price: 109.54 Smart Investing & Trading Score: 8 | |
| Day Percent Change: -1.21% Day Change: -1.34 | |
| Week Change: -2.12% Year-to-date Change: 2.3% | |
| IRTC Links: Profile News Message Board | |
| Charts:- Daily , Weekly | |
| Add IRTC to Watchlist: View: Get Complete IRTC Trend Analysis ➞ | |
 | APLE Apple Hospitality REIT, Inc. |
| Sector: Financials | |
| SubSector: REIT - Hotel/Motel | |
| MarketCap: 1515.74 Millions | |
| Recent Price: 14.68 Smart Investing & Trading Score: 18 | |
| Day Percent Change: 0.03% Day Change: 0.01 | |
| Week Change: -2.17% Year-to-date Change: -11.7% | |
| APLE Links: Profile News Message Board | |
| Charts:- Daily , Weekly | |
| Add APLE to Watchlist: View: Get Complete APLE Trend Analysis ➞ | |
 | SDRL Seadrill Limited |
| Sector: Energy | |
| SubSector: Oil & Gas Drilling | |
| MarketCap: 3300 Millions | |
| Recent Price: 49.00 Smart Investing & Trading Score: 58 | |
| Day Percent Change: 1.75% Day Change: 0.84 | |
| Week Change: -2.35% Year-to-date Change: 3.4% | |
| SDRL Links: Profile News Message Board | |
| Charts:- Daily , Weekly | |
| Add SDRL to Watchlist: View: Get Complete SDRL Trend Analysis ➞ | |
 | FSS Federal Signal Corporation |
| Sector: Industrials | |
| SubSector: Pollution & Treatment Controls | |
| MarketCap: 1694.05 Millions | |
| Recent Price: 81.88 Smart Investing & Trading Score: 38 | |
| Day Percent Change: -0.52% Day Change: -0.43 | |
| Week Change: -2.38% Year-to-date Change: 6.7% | |
| FSS Links: Profile News Message Board | |
| Charts:- Daily , Weekly | |
| Add FSS to Watchlist: View: Get Complete FSS Trend Analysis ➞ | |
 | RHP Ryman Hospitality Properties, Inc. |
| Sector: Financials | |
| SubSector: REIT - Hotel/Motel | |
| MarketCap: 1519.74 Millions | |
| Recent Price: 104.47 Smart Investing & Trading Score: 17 | |
| Day Percent Change: -0.33% Day Change: -0.35 | |
| Week Change: -2.42% Year-to-date Change: -5.1% | |
| RHP Links: Profile News Message Board | |
| Charts:- Daily , Weekly | |
| Add RHP to Watchlist: View: Get Complete RHP Trend Analysis ➞ | |
 | YELP Yelp Inc. |
| Sector: Technology | |
| SubSector: Internet Information Providers | |
| MarketCap: 1430.1 Millions | |
| Recent Price: 39.82 Smart Investing & Trading Score: 43 | |
| Day Percent Change: -0.45% Day Change: -0.18 | |
| Week Change: -2.45% Year-to-date Change: -15.9% | |
| YELP Links: Profile News Message Board | |
| Charts:- Daily , Weekly | |
| Add YELP to Watchlist: View: Get Complete YELP Trend Analysis ➞ | |
 | PRLD Prelude Therapeutics Incorporated |
| Sector: Health Care | |
| SubSector: Biotechnology | |
| MarketCap: 26087 Millions | |
| Recent Price: 3.97 Smart Investing & Trading Score: 37 | |
| Day Percent Change: -0.50% Day Change: -0.02 | |
| Week Change: -2.46% Year-to-date Change: -8.7% | |
| PRLD Links: Profile News Message Board | |
| Charts:- Daily , Weekly | |
| Add PRLD to Watchlist: View: Get Complete PRLD Trend Analysis ➞ | |
 | SANM Sanmina Corporation |
| Sector: Technology | |
| SubSector: Diversified Electronics | |
| MarketCap: 1790.36 Millions | |
| Recent Price: 61.41 Smart Investing & Trading Score: 54 | |
| Day Percent Change: -0.13% Day Change: -0.08 | |
| Week Change: -2.48% Year-to-date Change: 19.5% | |
| SANM Links: Profile News Message Board | |
| Charts:- Daily , Weekly | |
| Add SANM to Watchlist: View: Get Complete SANM Trend Analysis ➞ | |
 | MGRC McGrath RentCorp |
| Sector: Transports | |
| SubSector: Rental & Leasing Services | |
| MarketCap: 1289.04 Millions | |
| Recent Price: 108.93 Smart Investing & Trading Score: 39 | |
| Day Percent Change: 0.25% Day Change: 0.27 | |
| Week Change: -2.49% Year-to-date Change: -8.9% | |
| MGRC Links: Profile News Message Board | |
| Charts:- Daily , Weekly | |
| Add MGRC to Watchlist: View: Get Complete MGRC Trend Analysis ➞ | |
 | VAL Valaris Limited |
| Sector: Energy | |
| SubSector: Oil & Gas Equipment & Services | |
| MarketCap: 4520 Millions | |
| Recent Price: 67.45 Smart Investing & Trading Score: 58 | |
| Day Percent Change: 3.70% Day Change: 2.41 | |
| Week Change: -2.52% Year-to-date Change: -1.6% | |
| VAL Links: Profile News Message Board | |
| Charts:- Daily , Weekly | |
| Add VAL to Watchlist: View: Get Complete VAL Trend Analysis ➞ | |
 | MNRO Monro, Inc. |
| Sector: Consumer Staples | |
| SubSector: Auto Parts | |
| MarketCap: 1514.89 Millions | |
| Recent Price: 27.09 Smart Investing & Trading Score: 35 | |
| Day Percent Change: 0.56% Day Change: 0.15 | |
| Week Change: -2.52% Year-to-date Change: -7.7% | |
| MNRO Links: Profile News Message Board | |
| Charts:- Daily , Weekly | |
| Add MNRO to Watchlist: View: Get Complete MNRO Trend Analysis ➞ | |
 | EIG Employers Holdings, Inc. |
| Sector: Financials | |
| SubSector: Accident & Health Insurance | |
| MarketCap: 1202.6 Millions | |
| Recent Price: 42.89 Smart Investing & Trading Score: 22 | |
| Day Percent Change: -0.72% Day Change: -0.31 | |
| Week Change: -2.54% Year-to-date Change: 8.9% | |
| EIG Links: Profile News Message Board | |
| Charts:- Daily , Weekly | |
| Add EIG to Watchlist: View: Get Complete EIG Trend Analysis ➞ | |
 | HGV Hilton Grand Vacations Inc. |
| Sector: Services & Goods | |
| SubSector: Resorts & Casinos | |
| MarketCap: 1333.04 Millions | |
| Recent Price: 43.20 Smart Investing & Trading Score: 42 | |
| Day Percent Change: 0.19% Day Change: 0.08 | |
| Week Change: -2.57% Year-to-date Change: 7.5% | |
| HGV Links: Profile News Message Board | |
| Charts:- Daily , Weekly | |
| Add HGV to Watchlist: View: Get Complete HGV Trend Analysis ➞ | |
 | BECN Beacon Roofing Supply, Inc. |
| Sector: Industrials | |
| SubSector: General Building Materials | |
| MarketCap: 1210.13 Millions | |
| Recent Price: 96.44 Smart Investing & Trading Score: 41 | |
| Day Percent Change: -1.11% Day Change: -1.08 | |
| Week Change: -2.59% Year-to-date Change: 10.8% | |
| BECN Links: Profile News Message Board | |
| Charts:- Daily , Weekly | |
| Add BECN to Watchlist: View: Get Complete BECN Trend Analysis ➞ | |
 | VRNS Varonis Systems, Inc. |
| Sector: Technology | |
| SubSector: Technical & System Software | |
| MarketCap: 1715 Millions | |
| Recent Price: 44.13 Smart Investing & Trading Score: 42 | |
| Day Percent Change: -0.14% Day Change: -0.06 | |
| Week Change: -2.65% Year-to-date Change: -2.5% | |
| VRNS Links: Profile News Message Board | |
| Charts:- Daily , Weekly | |
| Add VRNS to Watchlist: View: Get Complete VRNS Trend Analysis ➞ | |
 | EXPO Exponent, Inc. |
| Sector: Services & Goods | |
| SubSector: Management Services | |
| MarketCap: 3605.95 Millions | |
| Recent Price: 92.59 Smart Investing & Trading Score: 83 | |
| Day Percent Change: 0.19% Day Change: 0.17 | |
| Week Change: -2.75% Year-to-date Change: 5.2% | |
| EXPO Links: Profile News Message Board | |
| Charts:- Daily , Weekly | |
| Add EXPO to Watchlist: View: Get Complete EXPO Trend Analysis ➞ | |
 | ACVA ACV Auctions Inc. |
| Sector: Services & Goods | |
| SubSector: Auto & Truck Dealerships | |
| MarketCap: 2680 Millions | |
| Recent Price: 17.59 Smart Investing & Trading Score: 32 | |
| Day Percent Change: 1.30% Day Change: 0.23 | |
| Week Change: -2.76% Year-to-date Change: 16.8% | |
| ACVA Links: Profile News Message Board | |
| Charts:- Daily , Weekly | |
| Add ACVA to Watchlist: View: Get Complete ACVA Trend Analysis ➞ | |
 | FWRD Forward Air Corporation |
| Sector: Transports | |
| SubSector: Air Delivery & Freight Services | |
| MarketCap: 1278.88 Millions | |
| Recent Price: 21.63 Smart Investing & Trading Score: 37 | |
| Day Percent Change: 2.41% Day Change: 0.51 | |
| Week Change: -2.87% Year-to-date Change: -65.6% | |
| FWRD Links: Profile News Message Board | |
| Charts:- Daily , Weekly | |
| Add FWRD to Watchlist: View: Get Complete FWRD Trend Analysis ➞ | |
 | WRBY Warby Parker Inc. |
| Sector: Health Care | |
| SubSector: Medical Instruments & Supplies | |
| MarketCap: 1380 Millions | |
| Recent Price: 12.54 Smart Investing & Trading Score: 37 | |
| Day Percent Change: 2.16% Day Change: 0.26 | |
| Week Change: -2.94% Year-to-date Change: -11.1% | |
| WRBY Links: Profile News Message Board | |
| Charts:- Daily , Weekly | |
| Add WRBY to Watchlist: View: Get Complete WRBY Trend Analysis ➞ | |
| For tabular summary view of above stock list: Summary View ➞ 0 - 25 , 25 - 50 , 50 - 75 , 75 - 100 , 100 - 125 , 125 - 150 , 150 - 175 , 175 - 200 , 200 - 225 , 225 - 250 , 250 - 275 , 275 - 300 , 300 - 325 , 325 - 350 , 350 - 375 , 375 - 400 , 400 - 425 , 425 - 450 , 450 - 475 , 475 - 500 , 500 - 525 , 525 - 550 , 550 - 575 , 575 - 600 , 600 - 625 , 625 - 650 , 650 - 675 , 675 - 700 | ||
| Click To Change The Sort Order: By Market Cap or Company Size Performance: Year-to-date, Week and Day | |
| Select Chart Type: | ||
| Too many stocks? View smallcap stocks filtered by marketcap & sector |
| Marketcap: All SmallCap Stocks (default-no microcap), Large, Mid-Range, Small & MicroCap |
| Sector: Tech, Finance, Energy, Staples, Retail, Industrial, Materials, Utilities & Medical |
|
Best Stocks Today 12Stocks.com |
© 2024 12Stocks.com Terms & Conditions Privacy Contact Us
All Information Provided Only For Education And Not To Be Used For Investing or Trading. See Terms & Conditions


One More Thing ... Get Best Stocks Delivered Daily!
Never Ever Miss A Move With Our Top Ten Stocks Lists
Find Best Stocks In Any Market - Bull or Bear Market
Take A Peek At Our Top Ten Stocks Lists: Daily, Weekly, Year-to-Date & Top Trends
Find Best Stocks In Any Market - Bull or Bear Market
Take A Peek At Our Top Ten Stocks Lists: Daily, Weekly, Year-to-Date & Top Trends
Smallcap Stocks With Best Up Trends [0-bearish to 100-bullish]: WideOpenWest [100], FTC Solar[100], IES [100], Origin Materials[100], Alignment Healthcare[100], Joint [100], Emergent BioSolutions[100], Adtalem Global[100], El Pollo[100], Enovix [100], Clearfield [100]
Best Smallcap Stocks Year-to-Date:
Janux [482.74%], Viking [306.72%], Longboard [272.5%], Alpine Immune[239.34%], Bakkt [199.55%], Avidity Biosciences[195.24%], Vera [189.47%], Cullinan Oncology[176.9%], Super Micro[173.85%], Arcutis Bio[169.66%], Y-mAbs [154.69%] Best Smallcap Stocks This Week:
Emergent BioSolutions[102.34%], Deciphera [73.28%], Eyenovia [68.74%], Origin Materials[66.52%], Aspen Aerogels[54.66%], Enovix [51.85%], TPI Composites[41.91%], Codexis [41.73%], Cue Biopharma[41.39%], WideOpenWest [41.07%], Carvana Co[39.19%] Best Smallcap Stocks Daily:
WideOpenWest [29.16%], Ardelyx [28.65%], FTC Solar[25.09%], IES [23.96%], Twist Bioscience[23.18%], Origin Materials[22.23%], Alignment Healthcare[21.97%], Joint [18.43%], Emergent BioSolutions[17.73%], Butterfly [17.42%], Vaxxinity [17.27%]