
 Login Sign Up


| |||||
 |  | ||||

| 12Stocks.com Market Intelligence |
Best SmallCap Stocks
|
| In a hurry? Small Cap Stock Lists: Performance Trends Table, Stock Charts
Sort Small Cap stocks: Daily, Weekly, Year-to-Date, Market Cap & Trends. Filter Small Cap stocks list by sector: Show all, Tech, Finance, Energy, Staples, Retail, Industrial, Materials, Utilities and HealthCare Filter Small Cap stocks list by size: All Large Medium Small and MicroCap |
| 12Stocks.com Small Cap Stocks Performances & Trends Daily | |||||||||
|
|  The overall Smart Investing & Trading Score is 69 (0-bearish to 100-bullish) which puts Small Cap index in short term neutral to bullish trend. The Smart Investing & Trading Score from previous trading session is 49 and hence an improvement of trend.
| ||||||||
Here are the Smart Investing & Trading Scores of the most requested small cap stocks at 12Stocks.com (click stock name for detailed review):
|


| 12Stocks.com: Investing in Smallcap Index with Stocks | |
|
The following table helps investors and traders sort through current performance and trends (as measured by Smart Investing & Trading Score) of various
stocks in the Smallcap Index. Quick View: Move mouse or cursor over stock symbol (ticker) to view short-term technical chart and over stock name to view long term chart. Click on  to add stock symbol to your watchlist and to add stock symbol to your watchlist and  to view watchlist. Click on any ticker or stock name for detailed market intelligence report for that stock. to view watchlist. Click on any ticker or stock name for detailed market intelligence report for that stock. |
12Stocks.com Performance of Stocks in Smallcap Index
| Ticker | Stock Name | Watchlist | Category | Recent Price | Smart Investing & Trading Score | Change % | Weekly Change% |
| PGRE | Paramount Group |   | Financials | 4.84 | 100 | 0.83% | 3.64% |
| IDCC | InterDigital | | Technology | 104.31 | 64 | 1.41% | 3.57% |
| AI | C3.ai | | Financials | 23.64 | 64 | 2.12% | 3.55% |
| MMI | Marcus & Millichap | | Financials | 33.41 | 64 | 2.61% | 3.53% |
| PNM | PNM Resources | | Utilities | 37.60 | 100 | -0.29% | 3.52% |
| FIX | Comfort Systems | | Industrials | 312.59 | 85 | 1.59% | 3.51% |
| ABCB | Ameris Bancorp | | Financials | 49.55 | 95 | 1.79% | 3.49% |
| PCRX | Pacira BioSciences | | Health Care | 27.25 | 74 | -0.26% | 3.49% |
| WD | Walker & Dunlop | | Financials | 96.44 | 95 | 2.35% | 3.47% |
| FIGS | FIGS | | Services & Goods | 5.09 | 52 | 1.29% | 3.46% |
| UVV | Universal | | Consumer Staples | 52.55 | 85 | -0.55% | 3.44% |
| PRAA | PRA Group | | Services & Goods | 24.93 | 67 | 0.89% | 3.40% |
| ACLX | Arcellx | | Health Care | 53.63 | 32 | 1.06% | 3.39% |
| GBTG | Global Business | | Technology | 6.20 | 100 | 1.14% | 3.33% |
| ESGR | Enstar Group | | Financials | 297.85 | 64 | -0.56% | 3.31% |
| KW | Kennedy-Wilson | | Financials | 8.78 | 69 | 0.23% | 3.29% |
| ARVN | Arvinas | | Health Care | 33.43 | 42 | 3.08% | 3.27% |
| VRRM | Verra Mobility | | Services & Goods | 25.02 | 95 | 3.86% | 3.26% |
| EVEX | Eve Holding | | Industrials | 5.54 | 87 | 3.26% | 3.26% |
| CBU | Community Bank | | Financials | 46.09 | 100 | 2.15% | 3.25% |
| TPH | TRI Pointe | | Industrials | 39.10 | 95 | 2.57% | 3.22% |
| EHTH | eHealth | | Financials | 4.67 | 42 | 1.63% | 3.20% |
| WK | Workiva | | Technology | 83.19 | 74 | 3.94% | 3.19% |
| WSBC | WesBanco | | Financials | 28.39 | 67 | 1.54% | 3.16% |
| FFBC | First Financial | | Financials | 23.28 | 100 | 0.87% | 3.15% |
| For chart view version of above stock list: Chart View ➞ 0 - 25 , 25 - 50 , 50 - 75 , 75 - 100 , 100 - 125 , 125 - 150 , 150 - 175 , 175 - 200 , 200 - 225 , 225 - 250 , 250 - 275 , 275 - 300 , 300 - 325 , 325 - 350 , 350 - 375 , 375 - 400 , 400 - 425 , 425 - 450 , 450 - 475 , 475 - 500 , 500 - 525 , 525 - 550 , 550 - 575 , 575 - 600 , 600 - 625 , 625 - 650 , 650 - 675 , 675 - 700 | ||
 | Click To Change The Sort Order: By Market Cap or Company Size Performance: Year-to-date, Week and Day |  |
| Too many stocks? View smallcap stocks filtered by marketcap & sector |
| Marketcap: All SmallCap Stocks (default-no microcap), Large, Mid-Range, Small |
| Smallcap Sector: Tech, Finance, Energy, Staples, Retail, Industrial, Materials, & Medical |
|
Get the most comprehensive stock market coverage daily at 12Stocks.com ➞ Best Stocks Today ➞ Best Stocks Weekly ➞ Best Stocks Year-to-Date ➞ Best Stocks Trends ➞  Best Stocks Today 12Stocks.com Best Nasdaq Stocks ➞ Best S&P 500 Stocks ➞ Best Tech Stocks ➞ Best Biotech Stocks ➞ |
| Detailed Overview of SmallCap Stocks |
| SmallCap Technical Overview, Leaders & Laggards, Top SmallCap ETF Funds & Detailed SmallCap Stocks List, Charts, Trends & More |
| Smallcap: Technical Analysis, Trends & YTD Performance | |
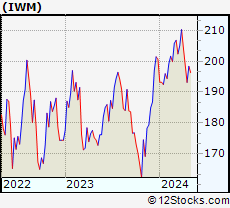
| SmallCap segment as represented by
IWM, an exchange-traded fund [ETF], holds basket of thousands of smallcap stocks from across all major sectors of the US stock market. The smallcap index (contains stocks like Riverbed & Sotheby's) is up by 0.22% and is currently underperforming the overall market by -6.27% year-to-date. Below is a quick view of technical charts and trends: | |
 IWM Weekly Chart |
|
| Long Term Trend: Not Good | |
| Medium Term Trend: Very Good | |
 IWM Daily Chart |
|
| Short Term Trend: Very Good | |
| Overall Trend Score: 69 | |
| YTD Performance: 0.22% | |
| **Trend Scores & Views Are Only For Educational Purposes And Not For Investing | |
| 12Stocks.com: Top Performing Small Cap Index Stocks | ||||||||||||||||||||||||||||||||||||||||||||||||
 The top performing Small Cap Index stocks year to date are
Now, more recently, over last week, the top performing Small Cap Index stocks on the move are


|
||||||||||||||||||||||||||||||||||||||||||||||||
| 12Stocks.com: Investing in Smallcap Index using Exchange Traded Funds | |
|
The following table shows list of key exchange traded funds (ETF) that
help investors track Smallcap index. The following list also includes leveraged ETF funds that track twice or thrice the daily returns of Smallcap indices. Short or inverse ETF funds move in the opposite direction to the index they track and are useful during market pullbacks or during bear markets. Quick View: Move mouse or cursor over ETF symbol (ticker) to view short-term technical chart and over ETF name to view long term chart. Click on ticker or stock name for detailed view. Click on to add stock symbol to your watchlist and to view watchlist. |
12Stocks.com List of ETFs that track Smallcap Index
| Ticker | ETF Name | Watchlist | Recent Price | Smart Investing & Trading Score | Change % | Week % | Year-to-date % |
| IWM | iShares Russell 2000 | | 201.15 | 69 | 0.61 | 1.39 | 0.22% |
| IJR | iShares Core S&P Small-Cap | | 106.83 | 82 | 0.47 | 1.12 | -1.31% |
| SDD | ProShares UltraShort SmallCap600 | | 18.35 | 10 | -4.97 | -5.17 | -0.42% |
| SBB | ProShares Short SmallCap600 | | 16.33 | 41 | -0.25 | -0.34 | 2.51% |
| SAA | ProShares Ultra SmallCap600 | | 23.93 | 82 | 4.36 | 3.88 | -4.07% |
| 12Stocks.com: Charts, Trends, Fundamental Data and Performances of SmallCap Stocks | |
|
We now take in-depth look at all SmallCap stocks including charts, multi-period performances and overall trends (as measured by Smart Investing & Trading Score). One can sort SmallCap stocks (click link to choose) by Daily, Weekly and by Year-to-Date performances. Also, one can sort by size of the company or by market capitalization. |
| Select Your Default Chart Type: | |||||
| |||||
| Click on stock symbol or name for detailed view. Click on to add stock symbol to your watchlist and to view watchlist. Quick View: Move mouse or cursor over "Daily" to quickly view daily technical stock chart and over "Weekly" to view weekly technical stock chart. | |||||

 | PGRE Paramount Group, Inc. |
| Sector: Financials | |
| SubSector: Property Management | |
| MarketCap: 1722.72 Millions | |
| Recent Price: 4.84 Smart Investing & Trading Score: 100 | |
| Day Percent Change: 0.83% Day Change: 0.04 | |
| Week Change: 3.64% Year-to-date Change: -6.4% | |
| PGRE Links: Profile News Message Board | |
| Charts:- Daily , Weekly | |
| Add PGRE to Watchlist: View: Get Complete PGRE Trend Analysis ➞ | |
 | IDCC InterDigital, Inc. |
| Sector: Technology | |
| SubSector: Wireless Communications | |
| MarketCap: 1225.27 Millions | |
| Recent Price: 104.31 Smart Investing & Trading Score: 64 | |
| Day Percent Change: 1.41% Day Change: 1.45 | |
| Week Change: 3.57% Year-to-date Change: -3.9% | |
| IDCC Links: Profile News Message Board | |
| Charts:- Daily , Weekly | |
| Add IDCC to Watchlist: View: Get Complete IDCC Trend Analysis ➞ | |
 | AI C3.ai, Inc. |
| Sector: Financials | |
| SubSector: REIT Mortgage | |
| MarketCap: 12467 Millions | |
| Recent Price: 23.64 Smart Investing & Trading Score: 64 | |
| Day Percent Change: 2.12% Day Change: 0.49 | |
| Week Change: 3.55% Year-to-date Change: -17.7% | |
| AI Links: Profile News Message Board | |
| Charts:- Daily , Weekly | |
| Add AI to Watchlist: View: Get Complete AI Trend Analysis ➞ | |
 | MMI Marcus & Millichap, Inc. |
| Sector: Financials | |
| SubSector: Real Estate Development | |
| MarketCap: 1005.19 Millions | |
| Recent Price: 33.41 Smart Investing & Trading Score: 64 | |
| Day Percent Change: 2.61% Day Change: 0.85 | |
| Week Change: 3.53% Year-to-date Change: -23.5% | |
| MMI Links: Profile News Message Board | |
| Charts:- Daily , Weekly | |
| Add MMI to Watchlist: View: Get Complete MMI Trend Analysis ➞ | |
 | PNM PNM Resources, Inc. |
| Sector: Utilities | |
| SubSector: Diversified Utilities | |
| MarketCap: 2755.3 Millions | |
| Recent Price: 37.60 Smart Investing & Trading Score: 100 | |
| Day Percent Change: -0.29% Day Change: -0.11 | |
| Week Change: 3.52% Year-to-date Change: -9.6% | |
| PNM Links: Profile News Message Board | |
| Charts:- Daily , Weekly | |
| Add PNM to Watchlist: View: Get Complete PNM Trend Analysis ➞ | |
 | FIX Comfort Systems USA, Inc. |
| Sector: Industrials | |
| SubSector: General Contractors | |
| MarketCap: 1440.63 Millions | |
| Recent Price: 312.59 Smart Investing & Trading Score: 85 | |
| Day Percent Change: 1.59% Day Change: 4.88 | |
| Week Change: 3.51% Year-to-date Change: 52.0% | |
| FIX Links: Profile News Message Board | |
| Charts:- Daily , Weekly | |
| Add FIX to Watchlist: View: Get Complete FIX Trend Analysis ➞ | |
 | ABCB Ameris Bancorp |
| Sector: Financials | |
| SubSector: Regional - Mid-Atlantic Banks | |
| MarketCap: 1537.79 Millions | |
| Recent Price: 49.55 Smart Investing & Trading Score: 95 | |
| Day Percent Change: 1.79% Day Change: 0.87 | |
| Week Change: 3.49% Year-to-date Change: -6.6% | |
| ABCB Links: Profile News Message Board | |
| Charts:- Daily , Weekly | |
| Add ABCB to Watchlist: View: Get Complete ABCB Trend Analysis ➞ | |
 | PCRX Pacira BioSciences, Inc. |
| Sector: Health Care | |
| SubSector: Drugs - Generic | |
| MarketCap: 1403.95 Millions | |
| Recent Price: 27.25 Smart Investing & Trading Score: 74 | |
| Day Percent Change: -0.26% Day Change: -0.07 | |
| Week Change: 3.49% Year-to-date Change: -19.2% | |
| PCRX Links: Profile News Message Board | |
| Charts:- Daily , Weekly | |
| Add PCRX to Watchlist: View: Get Complete PCRX Trend Analysis ➞ | |
 | WD Walker & Dunlop, Inc. |
| Sector: Financials | |
| SubSector: Mortgage Investment | |
| MarketCap: 1312.99 Millions | |
| Recent Price: 96.44 Smart Investing & Trading Score: 95 | |
| Day Percent Change: 2.35% Day Change: 2.21 | |
| Week Change: 3.47% Year-to-date Change: -13.1% | |
| WD Links: Profile News Message Board | |
| Charts:- Daily , Weekly | |
| Add WD to Watchlist: View: Get Complete WD Trend Analysis ➞ | |
 | FIGS FIGS, Inc. |
| Sector: Services & Goods | |
| SubSector: Apparel Manufacturing | |
| MarketCap: 1370 Millions | |
| Recent Price: 5.09 Smart Investing & Trading Score: 52 | |
| Day Percent Change: 1.29% Day Change: 0.06 | |
| Week Change: 3.46% Year-to-date Change: -28.6% | |
| FIGS Links: Profile News Message Board | |
| Charts:- Daily , Weekly | |
| Add FIGS to Watchlist: View: Get Complete FIGS Trend Analysis ➞ | |
 | UVV Universal Corporation |
| Sector: Consumer Staples | |
| SubSector: Tobacco Products, Other | |
| MarketCap: 1107.7 Millions | |
| Recent Price: 52.55 Smart Investing & Trading Score: 85 | |
| Day Percent Change: -0.55% Day Change: -0.29 | |
| Week Change: 3.44% Year-to-date Change: -21.9% | |
| UVV Links: Profile News Message Board | |
| Charts:- Daily , Weekly | |
| Add UVV to Watchlist: View: Get Complete UVV Trend Analysis ➞ | |
 | PRAA PRA Group, Inc. |
| Sector: Services & Goods | |
| SubSector: Business Services | |
| MarketCap: 1290.32 Millions | |
| Recent Price: 24.93 Smart Investing & Trading Score: 67 | |
| Day Percent Change: 0.89% Day Change: 0.22 | |
| Week Change: 3.4% Year-to-date Change: -4.9% | |
| PRAA Links: Profile News Message Board | |
| Charts:- Daily , Weekly | |
| Add PRAA to Watchlist: View: Get Complete PRAA Trend Analysis ➞ | |
 | ACLX Arcellx, Inc. |
| Sector: Health Care | |
| SubSector: Biotechnology | |
| MarketCap: 1530 Millions | |
| Recent Price: 53.63 Smart Investing & Trading Score: 32 | |
| Day Percent Change: 1.06% Day Change: 0.57 | |
| Week Change: 3.39% Year-to-date Change: -3.9% | |
| ACLX Links: Profile News Message Board | |
| Charts:- Daily , Weekly | |
| Add ACLX to Watchlist: View: Get Complete ACLX Trend Analysis ➞ | |
 | GBTG Global Business Travel Group, Inc. |
| Sector: Technology | |
| SubSector: Software - Application | |
| MarketCap: 3440 Millions | |
| Recent Price: 6.20 Smart Investing & Trading Score: 100 | |
| Day Percent Change: 1.14% Day Change: 0.07 | |
| Week Change: 3.33% Year-to-date Change: -5.1% | |
| GBTG Links: Profile News Message Board | |
| Charts:- Daily , Weekly | |
| Add GBTG to Watchlist: View: Get Complete GBTG Trend Analysis ➞ | |
 | ESGR Enstar Group Limited |
| Sector: Financials | |
| SubSector: Property & Casualty Insurance | |
| MarketCap: 2886.02 Millions | |
| Recent Price: 297.85 Smart Investing & Trading Score: 64 | |
| Day Percent Change: -0.56% Day Change: -1.66 | |
| Week Change: 3.31% Year-to-date Change: 1.2% | |
| ESGR Links: Profile News Message Board | |
| Charts:- Daily , Weekly | |
| Add ESGR to Watchlist: View: Get Complete ESGR Trend Analysis ➞ | |
 | KW Kennedy-Wilson Holdings, Inc. |
| Sector: Financials | |
| SubSector: Property Management | |
| MarketCap: 2025.42 Millions | |
| Recent Price: 8.78 Smart Investing & Trading Score: 69 | |
| Day Percent Change: 0.23% Day Change: 0.02 | |
| Week Change: 3.29% Year-to-date Change: -29.1% | |
| KW Links: Profile News Message Board | |
| Charts:- Daily , Weekly | |
| Add KW to Watchlist: View: Get Complete KW Trend Analysis ➞ | |
 | ARVN Arvinas, Inc. |
| Sector: Health Care | |
| SubSector: Biotechnology | |
| MarketCap: 3469.85 Millions | |
| Recent Price: 33.43 Smart Investing & Trading Score: 42 | |
| Day Percent Change: 3.08% Day Change: 1.00 | |
| Week Change: 3.27% Year-to-date Change: -18.8% | |
| ARVN Links: Profile News Message Board | |
| Charts:- Daily , Weekly | |
| Add ARVN to Watchlist: View: Get Complete ARVN Trend Analysis ➞ | |
 | VRRM Verra Mobility Corporation |
| Sector: Services & Goods | |
| SubSector: Security & Protection Services | |
| MarketCap: 1265.03 Millions | |
| Recent Price: 25.02 Smart Investing & Trading Score: 95 | |
| Day Percent Change: 3.86% Day Change: 0.93 | |
| Week Change: 3.26% Year-to-date Change: 8.6% | |
| VRRM Links: Profile News Message Board | |
| Charts:- Daily , Weekly | |
| Add VRRM to Watchlist: View: Get Complete VRRM Trend Analysis ➞ | |
 | EVEX Eve Holding, Inc. |
| Sector: Industrials | |
| SubSector: Aerospace & Defense | |
| MarketCap: 2830 Millions | |
| Recent Price: 5.54 Smart Investing & Trading Score: 87 | |
| Day Percent Change: 3.26% Day Change: 0.17 | |
| Week Change: 3.26% Year-to-date Change: -24.8% | |
| EVEX Links: Profile News Message Board | |
| Charts:- Daily , Weekly | |
| Add EVEX to Watchlist: View: Get Complete EVEX Trend Analysis ➞ | |
 | CBU Community Bank System, Inc. |
| Sector: Financials | |
| SubSector: Regional - Midwest Banks | |
| MarketCap: 2787.8 Millions | |
| Recent Price: 46.09 Smart Investing & Trading Score: 100 | |
| Day Percent Change: 2.15% Day Change: 0.97 | |
| Week Change: 3.25% Year-to-date Change: -11.6% | |
| CBU Links: Profile News Message Board | |
| Charts:- Daily , Weekly | |
| Add CBU to Watchlist: View: Get Complete CBU Trend Analysis ➞ | |
 | TPH TRI Pointe Group, Inc. |
| Sector: Industrials | |
| SubSector: Residential Construction | |
| MarketCap: 1140.06 Millions | |
| Recent Price: 39.10 Smart Investing & Trading Score: 95 | |
| Day Percent Change: 2.57% Day Change: 0.98 | |
| Week Change: 3.22% Year-to-date Change: 10.5% | |
| TPH Links: Profile News Message Board | |
| Charts:- Daily , Weekly | |
| Add TPH to Watchlist: View: Get Complete TPH Trend Analysis ➞ | |
 | EHTH eHealth, Inc. |
| Sector: Financials | |
| SubSector: Insurance Brokers | |
| MarketCap: 2813.57 Millions | |
| Recent Price: 4.67 Smart Investing & Trading Score: 42 | |
| Day Percent Change: 1.63% Day Change: 0.08 | |
| Week Change: 3.2% Year-to-date Change: -46.4% | |
| EHTH Links: Profile News Message Board | |
| Charts:- Daily , Weekly | |
| Add EHTH to Watchlist: View: Get Complete EHTH Trend Analysis ➞ | |
 | WK Workiva Inc. |
| Sector: Technology | |
| SubSector: Application Software | |
| MarketCap: 1537.42 Millions | |
| Recent Price: 83.19 Smart Investing & Trading Score: 74 | |
| Day Percent Change: 3.94% Day Change: 3.15 | |
| Week Change: 3.19% Year-to-date Change: -18.1% | |
| WK Links: Profile News Message Board | |
| Charts:- Daily , Weekly | |
| Add WK to Watchlist: View: Get Complete WK Trend Analysis ➞ | |
 | WSBC WesBanco, Inc. |
| Sector: Financials | |
| SubSector: Regional - Mid-Atlantic Banks | |
| MarketCap: 1575.79 Millions | |
| Recent Price: 28.39 Smart Investing & Trading Score: 67 | |
| Day Percent Change: 1.54% Day Change: 0.43 | |
| Week Change: 3.16% Year-to-date Change: -9.5% | |
| WSBC Links: Profile News Message Board | |
| Charts:- Daily , Weekly | |
| Add WSBC to Watchlist: View: Get Complete WSBC Trend Analysis ➞ | |
 | FFBC First Financial Bancorp. |
| Sector: Financials | |
| SubSector: Regional - Midwest Banks | |
| MarketCap: 1363.7 Millions | |
| Recent Price: 23.28 Smart Investing & Trading Score: 100 | |
| Day Percent Change: 0.87% Day Change: 0.20 | |
| Week Change: 3.15% Year-to-date Change: -2.0% | |
| FFBC Links: Profile News Message Board | |
| Charts:- Daily , Weekly | |
| Add FFBC to Watchlist: View: Get Complete FFBC Trend Analysis ➞ | |
| For tabular summary view of above stock list: Summary View ➞ 0 - 25 , 25 - 50 , 50 - 75 , 75 - 100 , 100 - 125 , 125 - 150 , 150 - 175 , 175 - 200 , 200 - 225 , 225 - 250 , 250 - 275 , 275 - 300 , 300 - 325 , 325 - 350 , 350 - 375 , 375 - 400 , 400 - 425 , 425 - 450 , 450 - 475 , 475 - 500 , 500 - 525 , 525 - 550 , 550 - 575 , 575 - 600 , 600 - 625 , 625 - 650 , 650 - 675 , 675 - 700 | ||
| Click To Change The Sort Order: By Market Cap or Company Size Performance: Year-to-date, Week and Day | |
| Select Chart Type: | ||
| Too many stocks? View smallcap stocks filtered by marketcap & sector |
| Marketcap: All SmallCap Stocks (default-no microcap), Large, Mid-Range, Small & MicroCap |
| Sector: Tech, Finance, Energy, Staples, Retail, Industrial, Materials, Utilities & Medical |
|
Best Stocks Today 12Stocks.com |
© 2024 12Stocks.com Terms & Conditions Privacy Contact Us
All Information Provided Only For Education And Not To Be Used For Investing or Trading. See Terms & Conditions


One More Thing ... Get Best Stocks Delivered Daily!
Never Ever Miss A Move With Our Top Ten Stocks Lists
Find Best Stocks In Any Market - Bull or Bear Market
Take A Peek At Our Top Ten Stocks Lists: Daily, Weekly, Year-to-Date & Top Trends
Find Best Stocks In Any Market - Bull or Bear Market
Take A Peek At Our Top Ten Stocks Lists: Daily, Weekly, Year-to-Date & Top Trends
Smallcap Stocks With Best Up Trends [0-bearish to 100-bullish]: WideOpenWest [100], FTC Solar[100], IES [100], Origin Materials[100], Alignment Healthcare[100], Joint [100], Emergent BioSolutions[100], Adtalem Global[100], El Pollo[100], Enovix [100], Clearfield [100]
Best Smallcap Stocks Year-to-Date:
Janux [482.74%], Viking [306.72%], Longboard [272.5%], Alpine Immune[239.34%], Bakkt [199.55%], Avidity Biosciences[195.24%], Vera [189.47%], Cullinan Oncology[176.9%], Super Micro[173.85%], Arcutis Bio[169.66%], Y-mAbs [154.69%] Best Smallcap Stocks This Week:
Emergent BioSolutions[102.34%], Deciphera [73.28%], Eyenovia [68.74%], Origin Materials[66.52%], Aspen Aerogels[54.66%], Enovix [51.85%], TPI Composites[41.91%], Codexis [41.73%], Cue Biopharma[41.39%], WideOpenWest [41.07%], Carvana Co[39.19%] Best Smallcap Stocks Daily:
WideOpenWest [29.16%], Ardelyx [28.65%], FTC Solar[25.09%], IES [23.96%], Twist Bioscience[23.18%], Origin Materials[22.23%], Alignment Healthcare[21.97%], Joint [18.43%], Emergent BioSolutions[17.73%], Butterfly [17.42%], Vaxxinity [17.27%]