
 Login Sign Up


| |||||
 |  | ||||

| 12Stocks.com Market Intelligence |
Best SmallCap Stocks
|
| In a hurry? Small Cap Stock Lists: Performance Trends Table, Stock Charts
Sort Small Cap stocks: Daily, Weekly, Year-to-Date, Market Cap & Trends. Filter Small Cap stocks list by sector: Show all, Tech, Finance, Energy, Staples, Retail, Industrial, Materials, Utilities and HealthCare Filter Small Cap stocks list by size: All Large Medium Small and MicroCap |
| 12Stocks.com Small Cap Stocks Performances & Trends Daily | |||||||||
|
|  The overall Smart Investing & Trading Score is 69 (0-bearish to 100-bullish) which puts Small Cap index in short term neutral to bullish trend. The Smart Investing & Trading Score from previous trading session is 49 and hence an improvement of trend.
| ||||||||
Here are the Smart Investing & Trading Scores of the most requested small cap stocks at 12Stocks.com (click stock name for detailed review):
|


| 12Stocks.com: Investing in Smallcap Index with Stocks | |
|
The following table helps investors and traders sort through current performance and trends (as measured by Smart Investing & Trading Score) of various
stocks in the Smallcap Index. Quick View: Move mouse or cursor over stock symbol (ticker) to view short-term technical chart and over stock name to view long term chart. Click on  to add stock symbol to your watchlist and to add stock symbol to your watchlist and  to view watchlist. Click on any ticker or stock name for detailed market intelligence report for that stock. to view watchlist. Click on any ticker or stock name for detailed market intelligence report for that stock. |
12Stocks.com Performance of Stocks in Smallcap Index
| Ticker | Stock Name | Watchlist | Category | Recent Price | Smart Investing & Trading Score | Change % | Weekly Change% |
| SMPL | Simply Good |   | Consumer Staples | 37.37 | 95 | 0.92% | 8.63% |
| FWRG | First Watch | | Services & Goods | 25.68 | 83 | 1.42% | 8.63% |
| RNA | Avidity Biosciences | | Health Care | 26.44 | 90 | 3.36% | 8.54% |
| AX | Axos Financial | | Financials | 57.53 | 100 | 0.42% | 8.44% |
| GNW | Genworth Financial | | Financials | 6.49 | 100 | 0.46% | 8.35% |
| IRON | Disc Medicine | | Health Care | 29.80 | 49 | 3.29% | 8.34% |
| NEO | NeoGenomics | | Health Care | 15.30 | 69 | 3.94% | 8.20% |
| OMCL | Omnicell | | Technology | 30.13 | 100 | 2.87% | 8.15% |
| BEAM | Beam | | Health Care | 23.12 | 32 | 1.76% | 8.14% |
| EVGO | EVgo | | Services & Goods | 1.95 | 59 | 3.46% | 8.06% |
| MSEX | Middlesex Water | | Utilities | 53.13 | 95 | 1.35% | 8.03% |
| DUOL | Duolingo | | Technology | 240.25 | 82 | 6.29% | 7.96% |
| BCPC | Balchem | | Materials | 150.33 | 57 | 2.77% | 7.95% |
| AMWL | American Well | | Health Care | 0.57 | 55 | 9.55% | 7.95% |
| BOWL | Bowlero | | Services & Goods | 12.63 | 100 | 4.77% | 7.86% |
| ITOS | iTeos | | Health Care | 11.65 | 100 | 1.35% | 7.82% |
| SPXC | SPX | | Industrials | 130.94 | 95 | 7.37% | 7.75% |
| NKTX | Nkarta | | Health Care | 7.40 | 39 | -1.73% | 7.71% |
| CTKB | Cytek Biosciences | | Health Care | 6.20 | 50 | -2.21% | 7.64% |
| WSFS | WSFS Financial | | Financials | 46.09 | 100 | 2.72% | 7.56% |
| FOXF | Fox Factory | | Consumer Staples | 43.51 | 59 | 10.38% | 7.56% |
| CORT | Corcept | | Health Care | 24.52 | 73 | -2.15% | 7.54% |
| HRMY | Harmony Biosciences | | Health Care | 31.52 | 74 | -0.54% | 7.50% |
| IGMS | IGM Biosciences | | Health Care | 10.10 | 64 | 7.10% | 7.45% |
| PCT | PureCycle | | Industrials | 5.34 | 49 | 9.31% | 7.23% |
| For chart view version of above stock list: Chart View ➞ 0 - 25 , 25 - 50 , 50 - 75 , 75 - 100 , 100 - 125 , 125 - 150 , 150 - 175 , 175 - 200 , 200 - 225 , 225 - 250 , 250 - 275 , 275 - 300 , 300 - 325 , 325 - 350 , 350 - 375 , 375 - 400 , 400 - 425 , 425 - 450 , 450 - 475 , 475 - 500 , 500 - 525 , 525 - 550 , 550 - 575 , 575 - 600 , 600 - 625 , 625 - 650 , 650 - 675 , 675 - 700 | ||
 | Click To Change The Sort Order: By Market Cap or Company Size Performance: Year-to-date, Week and Day |  |
| Too many stocks? View smallcap stocks filtered by marketcap & sector |
| Marketcap: All SmallCap Stocks (default-no microcap), Large, Mid-Range, Small |
| Smallcap Sector: Tech, Finance, Energy, Staples, Retail, Industrial, Materials, & Medical |
|
Get the most comprehensive stock market coverage daily at 12Stocks.com ➞ Best Stocks Today ➞ Best Stocks Weekly ➞ Best Stocks Year-to-Date ➞ Best Stocks Trends ➞  Best Stocks Today 12Stocks.com Best Nasdaq Stocks ➞ Best S&P 500 Stocks ➞ Best Tech Stocks ➞ Best Biotech Stocks ➞ |
| Detailed Overview of SmallCap Stocks |
| SmallCap Technical Overview, Leaders & Laggards, Top SmallCap ETF Funds & Detailed SmallCap Stocks List, Charts, Trends & More |
| Smallcap: Technical Analysis, Trends & YTD Performance | |
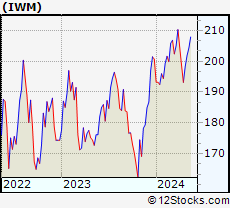
| SmallCap segment as represented by
IWM, an exchange-traded fund [ETF], holds basket of thousands of smallcap stocks from across all major sectors of the US stock market. The smallcap index (contains stocks like Riverbed & Sotheby's) is up by 0.59% and is currently underperforming the overall market by -6.29% year-to-date. Below is a quick view of technical charts and trends: | |
 IWM Weekly Chart |
|
| Long Term Trend: Not Good | |
| Medium Term Trend: Very Good | |
 IWM Daily Chart |
|
| Short Term Trend: Very Good | |
| Overall Trend Score: 69 | |
| YTD Performance: 0.59% | |
| **Trend Scores & Views Are Only For Educational Purposes And Not For Investing | |
| 12Stocks.com: Top Performing Small Cap Index Stocks | ||||||||||||||||||||||||||||||||||||||||||||||||
 The top performing Small Cap Index stocks year to date are
Now, more recently, over last week, the top performing Small Cap Index stocks on the move are


|
||||||||||||||||||||||||||||||||||||||||||||||||
| 12Stocks.com: Investing in Smallcap Index using Exchange Traded Funds | |
|
The following table shows list of key exchange traded funds (ETF) that
help investors track Smallcap index. The following list also includes leveraged ETF funds that track twice or thrice the daily returns of Smallcap indices. Short or inverse ETF funds move in the opposite direction to the index they track and are useful during market pullbacks or during bear markets. Quick View: Move mouse or cursor over ETF symbol (ticker) to view short-term technical chart and over ETF name to view long term chart. Click on ticker or stock name for detailed view. Click on to add stock symbol to your watchlist and to view watchlist. |
12Stocks.com List of ETFs that track Smallcap Index
| Ticker | ETF Name | Watchlist | Recent Price | Smart Investing & Trading Score | Change % | Week % | Year-to-date % |
| IWM | iShares Russell 2000 | | 201.90 | 69 | 0.99 | 1.77 | 0.59% |
| IJR | iShares Core S&P Small-Cap | | 107.13 | 82 | 0.75 | 1.4 | -1.03% |
| VTWO | Vanguard Russell 2000 ETF | | 81.61 | 37 | 0.94 | 1.73 | 0.63% |
| IWN | iShares Russell 2000 Value | | 154.21 | 57 | 0.87 | 2.03 | -0.72% |
| IJS | iShares S&P Small-Cap 600 Value | | 98.72 | 44 | 0.71 | 1.57 | -4.22% |
| IWO | iShares Russell 2000 Growth | | 256.87 | 27 | 0.99 | 1.49 | 1.84% |
| IJT | iShares S&P Small-Cap 600 Growth | | 127.79 | 57 | 0.84 | 1.35 | 2.12% |
| XSLV | PowerShares S&P SmallCap Low Volatil ETF | | 43.28 | 67 | 0.34 | 1.32 | -1.96% |
| SBB | ProShares Short SmallCap600 | | 16.22 | 41 | -0.92 | -1.01 | 1.82% |
| SDD | ProShares UltraShort SmallCap600 | | 18.84 | 10 | -2.43 | -2.64 | 2.24% |
| SAA | ProShares Ultra SmallCap600 | | 23.93 | 82 | 4.36 | 3.88 | -4.07% |
| SMLV | SPDR SSGA US Small Cap Low Volatil ETF | | 109.69 | 75 | 0.78 | 2.01 | -2.52% |
| 12Stocks.com: Charts, Trends, Fundamental Data and Performances of SmallCap Stocks | |
|
We now take in-depth look at all SmallCap stocks including charts, multi-period performances and overall trends (as measured by Smart Investing & Trading Score). One can sort SmallCap stocks (click link to choose) by Daily, Weekly and by Year-to-Date performances. Also, one can sort by size of the company or by market capitalization. |
| Select Your Default Chart Type: | |||||
| |||||
| Click on stock symbol or name for detailed view. Click on to add stock symbol to your watchlist and to view watchlist. Quick View: Move mouse or cursor over "Daily" to quickly view daily technical stock chart and over "Weekly" to view weekly technical stock chart. | |||||

 | SMPL The Simply Good Foods Company |
| Sector: Consumer Staples | |
| SubSector: Food - Major Diversified | |
| MarketCap: 1501.63 Millions | |
| Recent Price: 37.37 Smart Investing & Trading Score: 95 | |
| Day Percent Change: 0.92% Day Change: 0.34 | |
| Week Change: 8.63% Year-to-date Change: -5.6% | |
| SMPL Links: Profile News Message Board | |
| Charts:- Daily , Weekly | |
| Add SMPL to Watchlist: View: Get Complete SMPL Trend Analysis ➞ | |
 | FWRG First Watch Restaurant Group, Inc. |
| Sector: Services & Goods | |
| SubSector: Restaurants | |
| MarketCap: 1000 Millions | |
| Recent Price: 25.68 Smart Investing & Trading Score: 83 | |
| Day Percent Change: 1.42% Day Change: 0.36 | |
| Week Change: 8.63% Year-to-date Change: 28.9% | |
| FWRG Links: Profile News Message Board | |
| Charts:- Daily , Weekly | |
| Add FWRG to Watchlist: View: Get Complete FWRG Trend Analysis ➞ | |
 | RNA Avidity Biosciences, Inc. |
| Sector: Health Care | |
| SubSector: Biotechnology | |
| MarketCap: 12287 Millions | |
| Recent Price: 26.44 Smart Investing & Trading Score: 90 | |
| Day Percent Change: 3.36% Day Change: 0.86 | |
| Week Change: 8.54% Year-to-date Change: 192.5% | |
| RNA Links: Profile News Message Board | |
| Charts:- Daily , Weekly | |
| Add RNA to Watchlist: View: Get Complete RNA Trend Analysis ➞ | |
 | AX Axos Financial, Inc. |
| Sector: Financials | |
| SubSector: Savings & Loans | |
| MarketCap: 1037.3 Millions | |
| Recent Price: 57.53 Smart Investing & Trading Score: 100 | |
| Day Percent Change: 0.42% Day Change: 0.24 | |
| Week Change: 8.44% Year-to-date Change: 5.4% | |
| AX Links: Profile News Message Board | |
| Charts:- Daily , Weekly | |
| Add AX to Watchlist: View: Get Complete AX Trend Analysis ➞ | |
 | GNW Genworth Financial, Inc. |
| Sector: Financials | |
| SubSector: Life Insurance | |
| MarketCap: 1719.76 Millions | |
| Recent Price: 6.49 Smart Investing & Trading Score: 100 | |
| Day Percent Change: 0.46% Day Change: 0.03 | |
| Week Change: 8.35% Year-to-date Change: -2.8% | |
| GNW Links: Profile News Message Board | |
| Charts:- Daily , Weekly | |
| Add GNW to Watchlist: View: Get Complete GNW Trend Analysis ➞ | |
 | IRON Disc Medicine Opco Inc |
| Sector: Health Care | |
| SubSector: Biotechnology | |
| MarketCap: 1100 Millions | |
| Recent Price: 29.80 Smart Investing & Trading Score: 49 | |
| Day Percent Change: 3.29% Day Change: 0.95 | |
| Week Change: 8.34% Year-to-date Change: -48.6% | |
| IRON Links: Profile News Message Board | |
| Charts:- Daily , Weekly | |
| Add IRON to Watchlist: View: Get Complete IRON Trend Analysis ➞ | |
 | NEO NeoGenomics, Inc. |
| Sector: Health Care | |
| SubSector: Medical Laboratories & Research | |
| MarketCap: 2763.8 Millions | |
| Recent Price: 15.30 Smart Investing & Trading Score: 69 | |
| Day Percent Change: 3.94% Day Change: 0.58 | |
| Week Change: 8.2% Year-to-date Change: -5.4% | |
| NEO Links: Profile News Message Board | |
| Charts:- Daily , Weekly | |
| Add NEO to Watchlist: View: Get Complete NEO Trend Analysis ➞ | |
 | OMCL Omnicell, Inc. |
| Sector: Technology | |
| SubSector: Healthcare Information Services | |
| MarketCap: 2781.05 Millions | |
| Recent Price: 30.13 Smart Investing & Trading Score: 100 | |
| Day Percent Change: 2.87% Day Change: 0.84 | |
| Week Change: 8.15% Year-to-date Change: -19.9% | |
| OMCL Links: Profile News Message Board | |
| Charts:- Daily , Weekly | |
| Add OMCL to Watchlist: View: Get Complete OMCL Trend Analysis ➞ | |
 | BEAM Beam Therapeutics Inc. |
| Sector: Health Care | |
| SubSector: Biotechnology | |
| MarketCap: 44987 Millions | |
| Recent Price: 23.12 Smart Investing & Trading Score: 32 | |
| Day Percent Change: 1.76% Day Change: 0.40 | |
| Week Change: 8.14% Year-to-date Change: -15.1% | |
| BEAM Links: Profile News Message Board | |
| Charts:- Daily , Weekly | |
| Add BEAM to Watchlist: View: Get Complete BEAM Trend Analysis ➞ | |
 | EVGO EVgo, Inc. |
| Sector: Services & Goods | |
| SubSector: Specialty Retail | |
| MarketCap: 1140 Millions | |
| Recent Price: 1.95 Smart Investing & Trading Score: 59 | |
| Day Percent Change: 3.46% Day Change: 0.07 | |
| Week Change: 8.06% Year-to-date Change: -45.8% | |
| EVGO Links: Profile News Message Board | |
| Charts:- Daily , Weekly | |
| Add EVGO to Watchlist: View: Get Complete EVGO Trend Analysis ➞ | |
 | MSEX Middlesex Water Company |
| Sector: Utilities | |
| SubSector: Water Utilities | |
| MarketCap: 1082.02 Millions | |
| Recent Price: 53.13 Smart Investing & Trading Score: 95 | |
| Day Percent Change: 1.35% Day Change: 0.71 | |
| Week Change: 8.03% Year-to-date Change: -19.0% | |
| MSEX Links: Profile News Message Board | |
| Charts:- Daily , Weekly | |
| Add MSEX to Watchlist: View: Get Complete MSEX Trend Analysis ➞ | |
 | DUOL Duolingo, Inc. |
| Sector: Technology | |
| SubSector: Software - Application | |
| MarketCap: 6070 Millions | |
| Recent Price: 240.25 Smart Investing & Trading Score: 82 | |
| Day Percent Change: 6.29% Day Change: 14.21 | |
| Week Change: 7.96% Year-to-date Change: 5.4% | |
| DUOL Links: Profile News Message Board | |
| Charts:- Daily , Weekly | |
| Add DUOL to Watchlist: View: Get Complete DUOL Trend Analysis ➞ | |
 | BCPC Balchem Corporation |
| Sector: Materials | |
| SubSector: Specialty Chemicals | |
| MarketCap: 3330.17 Millions | |
| Recent Price: 150.33 Smart Investing & Trading Score: 57 | |
| Day Percent Change: 2.77% Day Change: 4.05 | |
| Week Change: 7.95% Year-to-date Change: 1.1% | |
| BCPC Links: Profile News Message Board | |
| Charts:- Daily , Weekly | |
| Add BCPC to Watchlist: View: Get Complete BCPC Trend Analysis ➞ | |
 | AMWL American Well Corporation |
| Sector: Health Care | |
| SubSector: Health Information Services | |
| MarketCap: 71987 Millions | |
| Recent Price: 0.57 Smart Investing & Trading Score: 55 | |
| Day Percent Change: 9.55% Day Change: 0.05 | |
| Week Change: 7.95% Year-to-date Change: -61.7% | |
| AMWL Links: Profile News Message Board | |
| Charts:- Daily , Weekly | |
| Add AMWL to Watchlist: View: Get Complete AMWL Trend Analysis ➞ | |
 | BOWL Bowlero Corp. |
| Sector: Services & Goods | |
| SubSector: Leisure | |
| MarketCap: 2000 Millions | |
| Recent Price: 12.63 Smart Investing & Trading Score: 100 | |
| Day Percent Change: 4.77% Day Change: 0.58 | |
| Week Change: 7.86% Year-to-date Change: -10.6% | |
| BOWL Links: Profile News Message Board | |
| Charts:- Daily , Weekly | |
| Add BOWL to Watchlist: View: Get Complete BOWL Trend Analysis ➞ | |
 | ITOS iTeos Therapeutics, Inc. |
| Sector: Health Care | |
| SubSector: Biotechnology | |
| MarketCap: 10487 Millions | |
| Recent Price: 11.65 Smart Investing & Trading Score: 100 | |
| Day Percent Change: 1.35% Day Change: 0.15 | |
| Week Change: 7.82% Year-to-date Change: 6.4% | |
| ITOS Links: Profile News Message Board | |
| Charts:- Daily , Weekly | |
| Add ITOS to Watchlist: View: Get Complete ITOS Trend Analysis ➞ | |
 | SPXC SPX Corporation |
| Sector: Industrials | |
| SubSector: Diversified Machinery | |
| MarketCap: 1415.56 Millions | |
| Recent Price: 130.94 Smart Investing & Trading Score: 95 | |
| Day Percent Change: 7.37% Day Change: 8.99 | |
| Week Change: 7.75% Year-to-date Change: 29.6% | |
| SPXC Links: Profile News Message Board | |
| Charts:- Daily , Weekly | |
| Add SPXC to Watchlist: View: Get Complete SPXC Trend Analysis ➞ | |
 | NKTX Nkarta, Inc. |
| Sector: Health Care | |
| SubSector: Biotechnology | |
| MarketCap: 23487 Millions | |
| Recent Price: 7.40 Smart Investing & Trading Score: 39 | |
| Day Percent Change: -1.73% Day Change: -0.13 | |
| Week Change: 7.71% Year-to-date Change: 12.2% | |
| NKTX Links: Profile News Message Board | |
| Charts:- Daily , Weekly | |
| Add NKTX to Watchlist: View: Get Complete NKTX Trend Analysis ➞ | |
 | CTKB Cytek Biosciences, Inc. |
| Sector: Health Care | |
| SubSector: Medical Devices | |
| MarketCap: 1140 Millions | |
| Recent Price: 6.20 Smart Investing & Trading Score: 50 | |
| Day Percent Change: -2.21% Day Change: -0.14 | |
| Week Change: 7.64% Year-to-date Change: -32.6% | |
| CTKB Links: Profile News Message Board | |
| Charts:- Daily , Weekly | |
| Add CTKB to Watchlist: View: Get Complete CTKB Trend Analysis ➞ | |
 | WSFS WSFS Financial Corporation |
| Sector: Financials | |
| SubSector: Regional - Mid-Atlantic Banks | |
| MarketCap: 1191.29 Millions | |
| Recent Price: 46.09 Smart Investing & Trading Score: 100 | |
| Day Percent Change: 2.72% Day Change: 1.22 | |
| Week Change: 7.56% Year-to-date Change: 0.4% | |
| WSFS Links: Profile News Message Board | |
| Charts:- Daily , Weekly | |
| Add WSFS to Watchlist: View: Get Complete WSFS Trend Analysis ➞ | |
 | FOXF Fox Factory Holding Corp. |
| Sector: Consumer Staples | |
| SubSector: Recreational Vehicles | |
| MarketCap: 2093.29 Millions | |
| Recent Price: 43.51 Smart Investing & Trading Score: 59 | |
| Day Percent Change: 10.38% Day Change: 4.09 | |
| Week Change: 7.56% Year-to-date Change: -35.5% | |
| FOXF Links: Profile News Message Board | |
| Charts:- Daily , Weekly | |
| Add FOXF to Watchlist: View: Get Complete FOXF Trend Analysis ➞ | |
 | CORT Corcept Therapeutics Incorporated |
| Sector: Health Care | |
| SubSector: Biotechnology | |
| MarketCap: 1228.45 Millions | |
| Recent Price: 24.52 Smart Investing & Trading Score: 73 | |
| Day Percent Change: -2.15% Day Change: -0.54 | |
| Week Change: 7.54% Year-to-date Change: -24.5% | |
| CORT Links: Profile News Message Board | |
| Charts:- Daily , Weekly | |
| Add CORT to Watchlist: View: Get Complete CORT Trend Analysis ➞ | |
 | HRMY Harmony Biosciences Holdings, Inc. |
| Sector: Health Care | |
| SubSector: Biotechnology | |
| MarketCap: 24487 Millions | |
| Recent Price: 31.52 Smart Investing & Trading Score: 74 | |
| Day Percent Change: -0.54% Day Change: -0.17 | |
| Week Change: 7.5% Year-to-date Change: -2.4% | |
| HRMY Links: Profile News Message Board | |
| Charts:- Daily , Weekly | |
| Add HRMY to Watchlist: View: Get Complete HRMY Trend Analysis ➞ | |
 | IGMS IGM Biosciences, Inc. |
| Sector: Health Care | |
| SubSector: Biotechnology | |
| MarketCap: 2000.05 Millions | |
| Recent Price: 10.10 Smart Investing & Trading Score: 64 | |
| Day Percent Change: 7.10% Day Change: 0.67 | |
| Week Change: 7.45% Year-to-date Change: 21.5% | |
| IGMS Links: Profile News Message Board | |
| Charts:- Daily , Weekly | |
| Add IGMS to Watchlist: View: Get Complete IGMS Trend Analysis ➞ | |
 | PCT PureCycle Technologies, Inc. |
| Sector: Industrials | |
| SubSector: Pollution & Treatment Controls | |
| MarketCap: 1610 Millions | |
| Recent Price: 5.34 Smart Investing & Trading Score: 49 | |
| Day Percent Change: 9.31% Day Change: 0.46 | |
| Week Change: 7.23% Year-to-date Change: 31.7% | |
| PCT Links: Profile News Message Board | |
| Charts:- Daily , Weekly | |
| Add PCT to Watchlist: View: Get Complete PCT Trend Analysis ➞ | |
| For tabular summary view of above stock list: Summary View ➞ 0 - 25 , 25 - 50 , 50 - 75 , 75 - 100 , 100 - 125 , 125 - 150 , 150 - 175 , 175 - 200 , 200 - 225 , 225 - 250 , 250 - 275 , 275 - 300 , 300 - 325 , 325 - 350 , 350 - 375 , 375 - 400 , 400 - 425 , 425 - 450 , 450 - 475 , 475 - 500 , 500 - 525 , 525 - 550 , 550 - 575 , 575 - 600 , 600 - 625 , 625 - 650 , 650 - 675 , 675 - 700 | ||
| Click To Change The Sort Order: By Market Cap or Company Size Performance: Year-to-date, Week and Day | |
| Select Chart Type: | ||
| Too many stocks? View smallcap stocks filtered by marketcap & sector |
| Marketcap: All SmallCap Stocks (default-no microcap), Large, Mid-Range, Small & MicroCap |
| Sector: Tech, Finance, Energy, Staples, Retail, Industrial, Materials, Utilities & Medical |
|
Best Stocks Today 12Stocks.com |
© 2024 12Stocks.com Terms & Conditions Privacy Contact Us
All Information Provided Only For Education And Not To Be Used For Investing or Trading. See Terms & Conditions


One More Thing ... Get Best Stocks Delivered Daily!
Never Ever Miss A Move With Our Top Ten Stocks Lists
Find Best Stocks In Any Market - Bull or Bear Market
Take A Peek At Our Top Ten Stocks Lists: Daily, Weekly, Year-to-Date & Top Trends
Find Best Stocks In Any Market - Bull or Bear Market
Take A Peek At Our Top Ten Stocks Lists: Daily, Weekly, Year-to-Date & Top Trends
Smallcap Stocks With Best Up Trends [0-bearish to 100-bullish]: WideOpenWest [100], Joint [100], FTC Solar[100], Origin Materials[100], Alignment Healthcare[100], Clarus [100], Emergent BioSolutions[100], IES [100], Enovix [100], El Pollo[100], Adtalem Global[100]
Best Smallcap Stocks Year-to-Date:
Janux [482.74%], Viking [313.65%], Longboard [272.5%], Alpine Immune[239.23%], Bakkt [199.55%], Avidity Biosciences[192.48%], Vera [189.47%], Cullinan Oncology[176.9%], Super Micro[175.33%], Y-mAbs [151.47%], Sana [149.33%] Best Smallcap Stocks This Week:
Emergent BioSolutions[102.6%], Deciphera [73.14%], Origin Materials[66.52%], Eyenovia [57.77%], Cue Biopharma[56.04%], Aspen Aerogels[56.02%], Enovix [54.02%], Luna Innovations[53.27%], Codexis [47.37%], Carvana Co[44.31%], Office Properties[43.28%] Best Smallcap Stocks Daily:
Luna Innovations[35.56%], Twist Bioscience[28.77%], WideOpenWest [28.23%], Ardelyx [28.13%], 2U [26.26%], Joint [25.74%], FTC Solar[25.09%], Origin Materials[22.23%], Alignment Healthcare[21.97%], Clarus [18.34%], Aurora Innovation[18.09%]