
 Login Sign Up


| |||||
 |  | ||||

| 12Stocks.com Market Intelligence |
Best SmallCap Stocks
|
| In a hurry? Small Cap Stock Lists: Performance Trends Table, Stock Charts
Sort Small Cap stocks: Daily, Weekly, Year-to-Date, Market Cap & Trends. Filter Small Cap stocks list by sector: Show all, Tech, Finance, Energy, Staples, Retail, Industrial, Materials, Utilities and HealthCare Filter Small Cap stocks list by size: All Large Medium Small and MicroCap |
| 12Stocks.com Small Cap Stocks Performances & Trends Daily | |||||||||
|
|  The overall Smart Investing & Trading Score is 69 (0-bearish to 100-bullish) which puts Small Cap index in short term neutral to bullish trend. The Smart Investing & Trading Score from previous trading session is 49 and hence an improvement of trend.
| ||||||||
Here are the Smart Investing & Trading Scores of the most requested small cap stocks at 12Stocks.com (click stock name for detailed review):
|


| 12Stocks.com: Investing in Smallcap Index with Stocks | |
|
The following table helps investors and traders sort through current performance and trends (as measured by Smart Investing & Trading Score) of various
stocks in the Smallcap Index. Quick View: Move mouse or cursor over stock symbol (ticker) to view short-term technical chart and over stock name to view long term chart. Click on  to add stock symbol to your watchlist and to add stock symbol to your watchlist and  to view watchlist. Click on any ticker or stock name for detailed market intelligence report for that stock. to view watchlist. Click on any ticker or stock name for detailed market intelligence report for that stock. |
12Stocks.com Performance of Stocks in Smallcap Index
| Ticker | Stock Name | Watchlist | Category | Recent Price | Smart Investing & Trading Score | Change % | Weekly Change% |
| BL | BlackLine |   | Technology | 60.79 | 75 | 1.84% | -0.07% |
| TMHC | Taylor Morrison | | Industrials | 57.52 | 80 | 2.26% | -0.07% |
| INVA | Innoviva | | Health Care | 15.24 | 67 | -0.85% | -0.13% |
| PDCO | Patterson | | Services & Goods | 25.73 | 57 | 1.16% | -0.17% |
| SMR | NuScale Power | | Industrials | 6.05 | 83 | 1.26% | -0.17% |
| SONO | Sonos | | Technology | 16.94 | 32 | 0.00% | -0.18% |
| RRR | Red Rock | | Transports | 54.02 | 32 | 0.94% | -0.18% |
| MLI | Mueller Industries | | Industrials | 57.22 | 85 | 0.60% | -0.19% |
| LCII | LCI Industries | | Consumer Staples | 107.11 | 32 | 1.87% | -0.20% |
| EVBG | Everbridge | | Technology | 34.80 | 63 | 0.00% | -0.23% |
| NREF | NexPoint Real | | Financials | 13.23 | 67 | 0.00% | -0.23% |
| CALM | Cal-Maine Foods | | Consumer Staples | 56.72 | 50 | -1.39% | -0.26% |
| PUBM | PubMatic | | Technology | 23.15 | 78 | 0.26% | -0.26% |
| SR | Spire | | Utilities | 61.23 | 75 | -0.73% | -0.28% |
| JOBY | Joby Aviation | | Industrials | 5.34 | 59 | 2.60% | -0.28% |
| HBI | Hanesbrands | | Consumer Staples | 4.46 | 5 | -4.39% | -0.33% |
| PRLB | Proto Labs | | Industrials | 31.26 | 42 | 0.39% | -0.35% |
| ROCK | Gibraltar Industries | | Materials | 71.98 | 27 | 1.05% | -0.38% |
| AEO | American Eagle | | Services & Goods | 24.30 | 78 | -0.72% | -0.39% |
| KLIC | Kulicke and | | Technology | 46.83 | 42 | 1.76% | -0.40% |
| NUS | Nu Skin | | Consumer Staples | 12.26 | 67 | 0.91% | -0.41% |
| ALXO | ALX Oncology | | Health Care | 16.79 | 63 | 1.02% | -0.42% |
| LTH | Life Time | | Services & Goods | 14.09 | 68 | 0.93% | -0.46% |
| EMBC | Embecta | | Health Care | 10.26 | 60 | 0.20% | -0.48% |
| RAMP | LiveRamp | | Technology | 32.46 | 42 | -0.06% | -0.55% |
| For chart view version of above stock list: Chart View ➞ 0 - 25 , 25 - 50 , 50 - 75 , 75 - 100 , 100 - 125 , 125 - 150 , 150 - 175 , 175 - 200 , 200 - 225 , 225 - 250 , 250 - 275 , 275 - 300 , 300 - 325 , 325 - 350 , 350 - 375 , 375 - 400 , 400 - 425 , 425 - 450 , 450 - 475 , 475 - 500 , 500 - 525 , 525 - 550 , 550 - 575 , 575 - 600 , 600 - 625 , 625 - 650 , 650 - 675 , 675 - 700 | ||
 | Click To Change The Sort Order: By Market Cap or Company Size Performance: Year-to-date, Week and Day |  |
| Too many stocks? View smallcap stocks filtered by marketcap & sector |
| Marketcap: All SmallCap Stocks (default-no microcap), Large, Mid-Range, Small |
| Smallcap Sector: Tech, Finance, Energy, Staples, Retail, Industrial, Materials, & Medical |
|
Get the most comprehensive stock market coverage daily at 12Stocks.com ➞ Best Stocks Today ➞ Best Stocks Weekly ➞ Best Stocks Year-to-Date ➞ Best Stocks Trends ➞  Best Stocks Today 12Stocks.com Best Nasdaq Stocks ➞ Best S&P 500 Stocks ➞ Best Tech Stocks ➞ Best Biotech Stocks ➞ |
| Detailed Overview of SmallCap Stocks |
| SmallCap Technical Overview, Leaders & Laggards, Top SmallCap ETF Funds & Detailed SmallCap Stocks List, Charts, Trends & More |
| Smallcap: Technical Analysis, Trends & YTD Performance | |
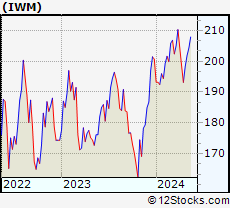
| SmallCap segment as represented by
IWM, an exchange-traded fund [ETF], holds basket of thousands of smallcap stocks from across all major sectors of the US stock market. The smallcap index (contains stocks like Riverbed & Sotheby's) is up by 0.55% and is currently underperforming the overall market by -6.35% year-to-date. Below is a quick view of technical charts and trends: | |
 IWM Weekly Chart |
|
| Long Term Trend: Not Good | |
| Medium Term Trend: Very Good | |
 IWM Daily Chart |
|
| Short Term Trend: Very Good | |
| Overall Trend Score: 69 | |
| YTD Performance: 0.55% | |
| **Trend Scores & Views Are Only For Educational Purposes And Not For Investing | |
| 12Stocks.com: Top Performing Small Cap Index Stocks | ||||||||||||||||||||||||||||||||||||||||||||||||
 The top performing Small Cap Index stocks year to date are
Now, more recently, over last week, the top performing Small Cap Index stocks on the move are


|
||||||||||||||||||||||||||||||||||||||||||||||||
| 12Stocks.com: Investing in Smallcap Index using Exchange Traded Funds | |
|
The following table shows list of key exchange traded funds (ETF) that
help investors track Smallcap index. The following list also includes leveraged ETF funds that track twice or thrice the daily returns of Smallcap indices. Short or inverse ETF funds move in the opposite direction to the index they track and are useful during market pullbacks or during bear markets. Quick View: Move mouse or cursor over ETF symbol (ticker) to view short-term technical chart and over ETF name to view long term chart. Click on ticker or stock name for detailed view. Click on to add stock symbol to your watchlist and to view watchlist. |
12Stocks.com List of ETFs that track Smallcap Index
| Ticker | ETF Name | Watchlist | Recent Price | Smart Investing & Trading Score | Change % | Week % | Year-to-date % |
| IWM | iShares Russell 2000 | | 201.81 | 69 | 0.95 | 1.72 | 0.55% |
| IJR | iShares Core S&P Small-Cap | | 107.17 | 82 | 0.79 | 1.44 | -1% |
| VTWO | Vanguard Russell 2000 ETF | | 81.74 | 37 | 1.10 | 1.89 | 0.79% |
| IWN | iShares Russell 2000 Value | | 154.25 | 57 | 0.90 | 2.06 | -0.7% |
| IJS | iShares S&P Small-Cap 600 Value | | 98.72 | 44 | 0.71 | 1.57 | -4.22% |
| IWO | iShares Russell 2000 Growth | | 256.90 | 27 | 1.01 | 1.51 | 1.86% |
| IJT | iShares S&P Small-Cap 600 Growth | | 127.92 | 57 | 0.95 | 1.45 | 2.22% |
| XSLV | PowerShares S&P SmallCap Low Volatil ETF | | 43.31 | 67 | 0.39 | 1.38 | -1.9% |
| SBB | ProShares Short SmallCap600 | | 16.16 | 41 | -1.28 | -1.37 | 1.44% |
| SAA | ProShares Ultra SmallCap600 | | 23.59 | 82 | 2.86 | 2.39 | -5.45% |
| SDD | ProShares UltraShort SmallCap600 | | 18.84 | 10 | -2.43 | -2.64 | 2.24% |
| SMLV | SPDR SSGA US Small Cap Low Volatil ETF | | 109.56 | 75 | 0.67 | 1.9 | -2.63% |
| 12Stocks.com: Charts, Trends, Fundamental Data and Performances of SmallCap Stocks | |
|
We now take in-depth look at all SmallCap stocks including charts, multi-period performances and overall trends (as measured by Smart Investing & Trading Score). One can sort SmallCap stocks (click link to choose) by Daily, Weekly and by Year-to-Date performances. Also, one can sort by size of the company or by market capitalization. |
| Select Your Default Chart Type: | |||||
| |||||
| Click on stock symbol or name for detailed view. Click on to add stock symbol to your watchlist and to view watchlist. Quick View: Move mouse or cursor over "Daily" to quickly view daily technical stock chart and over "Weekly" to view weekly technical stock chart. | |||||

 | BL BlackLine, Inc. |
| Sector: Technology | |
| SubSector: Application Software | |
| MarketCap: 2972.62 Millions | |
| Recent Price: 60.79 Smart Investing & Trading Score: 75 | |
| Day Percent Change: 1.84% Day Change: 1.10 | |
| Week Change: -0.07% Year-to-date Change: -2.6% | |
| BL Links: Profile News Message Board | |
| Charts:- Daily , Weekly | |
| Add BL to Watchlist: View: Get Complete BL Trend Analysis ➞ | |
 | TMHC Taylor Morrison Home Corporation |
| Sector: Industrials | |
| SubSector: Residential Construction | |
| MarketCap: 1336.76 Millions | |
| Recent Price: 57.52 Smart Investing & Trading Score: 80 | |
| Day Percent Change: 2.26% Day Change: 1.27 | |
| Week Change: -0.07% Year-to-date Change: 7.8% | |
| TMHC Links: Profile News Message Board | |
| Charts:- Daily , Weekly | |
| Add TMHC to Watchlist: View: Get Complete TMHC Trend Analysis ➞ | |
 | INVA Innoviva, Inc. |
| Sector: Health Care | |
| SubSector: Biotechnology | |
| MarketCap: 1023.15 Millions | |
| Recent Price: 15.24 Smart Investing & Trading Score: 67 | |
| Day Percent Change: -0.85% Day Change: -0.13 | |
| Week Change: -0.13% Year-to-date Change: -5.0% | |
| INVA Links: Profile News Message Board | |
| Charts:- Daily , Weekly | |
| Add INVA to Watchlist: View: Get Complete INVA Trend Analysis ➞ | |
 | PDCO Patterson Companies, Inc. |
| Sector: Services & Goods | |
| SubSector: Medical Equipment Wholesale | |
| MarketCap: 1672.2 Millions | |
| Recent Price: 25.73 Smart Investing & Trading Score: 57 | |
| Day Percent Change: 1.16% Day Change: 0.30 | |
| Week Change: -0.17% Year-to-date Change: -9.6% | |
| PDCO Links: Profile News Message Board | |
| Charts:- Daily , Weekly | |
| Add PDCO to Watchlist: View: Get Complete PDCO Trend Analysis ➞ | |
 | SMR NuScale Power Corporation |
| Sector: Industrials | |
| SubSector: Specialty Industrial Machinery | |
| MarketCap: 1510 Millions | |
| Recent Price: 6.05 Smart Investing & Trading Score: 83 | |
| Day Percent Change: 1.26% Day Change: 0.08 | |
| Week Change: -0.17% Year-to-date Change: 87.6% | |
| SMR Links: Profile News Message Board | |
| Charts:- Daily , Weekly | |
| Add SMR to Watchlist: View: Get Complete SMR Trend Analysis ➞ | |
 | SONO Sonos, Inc. |
| Sector: Technology | |
| SubSector: Diversified Electronics | |
| MarketCap: 1047.96 Millions | |
| Recent Price: 16.94 Smart Investing & Trading Score: 32 | |
| Day Percent Change: 0.00% Day Change: 0.00 | |
| Week Change: -0.18% Year-to-date Change: -1.2% | |
| SONO Links: Profile News Message Board | |
| Charts:- Daily , Weekly | |
| Add SONO to Watchlist: View: Get Complete SONO Trend Analysis ➞ | |
 | RRR Red Rock Resorts, Inc. |
| Sector: Transports | |
| SubSector: Rental & Leasing Services | |
| MarketCap: 1144.04 Millions | |
| Recent Price: 54.02 Smart Investing & Trading Score: 32 | |
| Day Percent Change: 0.94% Day Change: 0.50 | |
| Week Change: -0.18% Year-to-date Change: 1.3% | |
| RRR Links: Profile News Message Board | |
| Charts:- Daily , Weekly | |
| Add RRR to Watchlist: View: Get Complete RRR Trend Analysis ➞ | |
 | MLI Mueller Industries, Inc. |
| Sector: Industrials | |
| SubSector: Metal Fabrication | |
| MarketCap: 1259.5 Millions | |
| Recent Price: 57.22 Smart Investing & Trading Score: 85 | |
| Day Percent Change: 0.60% Day Change: 0.34 | |
| Week Change: -0.19% Year-to-date Change: 21.4% | |
| MLI Links: Profile News Message Board | |
| Charts:- Daily , Weekly | |
| Add MLI to Watchlist: View: Get Complete MLI Trend Analysis ➞ | |
 | LCII LCI Industries |
| Sector: Consumer Staples | |
| SubSector: Recreational Vehicles | |
| MarketCap: 1663.59 Millions | |
| Recent Price: 107.11 Smart Investing & Trading Score: 32 | |
| Day Percent Change: 1.87% Day Change: 1.97 | |
| Week Change: -0.2% Year-to-date Change: -14.8% | |
| LCII Links: Profile News Message Board | |
| Charts:- Daily , Weekly | |
| Add LCII to Watchlist: View: Get Complete LCII Trend Analysis ➞ | |
 | EVBG Everbridge, Inc. |
| Sector: Technology | |
| SubSector: Application Software | |
| MarketCap: 3697.92 Millions | |
| Recent Price: 34.80 Smart Investing & Trading Score: 63 | |
| Day Percent Change: 0.00% Day Change: 0.00 | |
| Week Change: -0.23% Year-to-date Change: 43.2% | |
| EVBG Links: Profile News Message Board | |
| Charts:- Daily , Weekly | |
| Add EVBG to Watchlist: View: Get Complete EVBG Trend Analysis ➞ | |
 | NREF NexPoint Real Estate Finance, Inc. |
| Sector: Financials | |
| SubSector: REIT Diversified | |
| MarketCap: 97267 Millions | |
| Recent Price: 13.23 Smart Investing & Trading Score: 67 | |
| Day Percent Change: 0.00% Day Change: 0.00 | |
| Week Change: -0.23% Year-to-date Change: -15.9% | |
| NREF Links: Profile News Message Board | |
| Charts:- Daily , Weekly | |
| Add NREF to Watchlist: View: Get Complete NREF Trend Analysis ➞ | |
 | CALM Cal-Maine Foods, Inc. |
| Sector: Consumer Staples | |
| SubSector: Food - Major Diversified | |
| MarketCap: 2177.13 Millions | |
| Recent Price: 56.72 Smart Investing & Trading Score: 50 | |
| Day Percent Change: -1.39% Day Change: -0.80 | |
| Week Change: -0.26% Year-to-date Change: -1.2% | |
| CALM Links: Profile News Message Board | |
| Charts:- Daily , Weekly | |
| Add CALM to Watchlist: View: Get Complete CALM Trend Analysis ➞ | |
 | PUBM PubMatic, Inc. |
| Sector: Technology | |
| SubSector: Software Application | |
| MarketCap: 56787 Millions | |
| Recent Price: 23.15 Smart Investing & Trading Score: 78 | |
| Day Percent Change: 0.26% Day Change: 0.06 | |
| Week Change: -0.26% Year-to-date Change: 42.0% | |
| PUBM Links: Profile News Message Board | |
| Charts:- Daily , Weekly | |
| Add PUBM to Watchlist: View: Get Complete PUBM Trend Analysis ➞ | |
 | SR Spire Inc. |
| Sector: Utilities | |
| SubSector: Gas Utilities | |
| MarketCap: 3745.87 Millions | |
| Recent Price: 61.23 Smart Investing & Trading Score: 75 | |
| Day Percent Change: -0.73% Day Change: -0.45 | |
| Week Change: -0.28% Year-to-date Change: -1.8% | |
| SR Links: Profile News Message Board | |
| Charts:- Daily , Weekly | |
| Add SR to Watchlist: View: Get Complete SR Trend Analysis ➞ | |
 | JOBY Joby Aviation, Inc. |
| Sector: Industrials | |
| SubSector: Airports & Air Services | |
| MarketCap: 5810 Millions | |
| Recent Price: 5.34 Smart Investing & Trading Score: 59 | |
| Day Percent Change: 2.60% Day Change: 0.13 | |
| Week Change: -0.28% Year-to-date Change: -19.7% | |
| JOBY Links: Profile News Message Board | |
| Charts:- Daily , Weekly | |
| Add JOBY to Watchlist: View: Get Complete JOBY Trend Analysis ➞ | |
 | HBI Hanesbrands Inc. |
| Sector: Consumer Staples | |
| SubSector: Textile - Apparel Clothing | |
| MarketCap: 3559.75 Millions | |
| Recent Price: 4.46 Smart Investing & Trading Score: 5 | |
| Day Percent Change: -4.39% Day Change: -0.21 | |
| Week Change: -0.33% Year-to-date Change: 0.1% | |
| HBI Links: Profile News Message Board | |
| Charts:- Daily , Weekly | |
| Add HBI to Watchlist: View: Get Complete HBI Trend Analysis ➞ | |
 | PRLB Proto Labs, Inc. |
| Sector: Industrials | |
| SubSector: Machine Tools & Accessories | |
| MarketCap: 1944.78 Millions | |
| Recent Price: 31.26 Smart Investing & Trading Score: 42 | |
| Day Percent Change: 0.39% Day Change: 0.12 | |
| Week Change: -0.35% Year-to-date Change: -19.8% | |
| PRLB Links: Profile News Message Board | |
| Charts:- Daily , Weekly | |
| Add PRLB to Watchlist: View: Get Complete PRLB Trend Analysis ➞ | |
 | ROCK Gibraltar Industries, Inc. |
| Sector: Materials | |
| SubSector: Steel & Iron | |
| MarketCap: 1341.08 Millions | |
| Recent Price: 71.98 Smart Investing & Trading Score: 27 | |
| Day Percent Change: 1.05% Day Change: 0.75 | |
| Week Change: -0.38% Year-to-date Change: -8.9% | |
| ROCK Links: Profile News Message Board | |
| Charts:- Daily , Weekly | |
| Add ROCK to Watchlist: View: Get Complete ROCK Trend Analysis ➞ | |
 | AEO American Eagle Outfitters, Inc. |
| Sector: Services & Goods | |
| SubSector: Apparel Stores | |
| MarketCap: 1577.08 Millions | |
| Recent Price: 24.30 Smart Investing & Trading Score: 78 | |
| Day Percent Change: -0.72% Day Change: -0.17 | |
| Week Change: -0.39% Year-to-date Change: 14.8% | |
| AEO Links: Profile News Message Board | |
| Charts:- Daily , Weekly | |
| Add AEO to Watchlist: View: Get Complete AEO Trend Analysis ➞ | |
 | KLIC Kulicke and Soffa Industries, Inc. |
| Sector: Technology | |
| SubSector: Semiconductor Equipment & Materials | |
| MarketCap: 1336.68 Millions | |
| Recent Price: 46.83 Smart Investing & Trading Score: 42 | |
| Day Percent Change: 1.76% Day Change: 0.81 | |
| Week Change: -0.4% Year-to-date Change: -14.4% | |
| KLIC Links: Profile News Message Board | |
| Charts:- Daily , Weekly | |
| Add KLIC to Watchlist: View: Get Complete KLIC Trend Analysis ➞ | |
 | NUS Nu Skin Enterprises, Inc. |
| Sector: Consumer Staples | |
| SubSector: Personal Products | |
| MarketCap: 1230.85 Millions | |
| Recent Price: 12.26 Smart Investing & Trading Score: 67 | |
| Day Percent Change: 0.91% Day Change: 0.11 | |
| Week Change: -0.41% Year-to-date Change: -36.9% | |
| NUS Links: Profile News Message Board | |
| Charts:- Daily , Weekly | |
| Add NUS to Watchlist: View: Get Complete NUS Trend Analysis ➞ | |
 | ALXO ALX Oncology Holdings Inc. |
| Sector: Health Care | |
| SubSector: Biotechnology | |
| MarketCap: 41787 Millions | |
| Recent Price: 16.79 Smart Investing & Trading Score: 63 | |
| Day Percent Change: 1.02% Day Change: 0.17 | |
| Week Change: -0.42% Year-to-date Change: 12.8% | |
| ALXO Links: Profile News Message Board | |
| Charts:- Daily , Weekly | |
| Add ALXO to Watchlist: View: Get Complete ALXO Trend Analysis ➞ | |
 | LTH Life Time Group Holdings, Inc. |
| Sector: Services & Goods | |
| SubSector: Leisure | |
| MarketCap: 3740 Millions | |
| Recent Price: 14.09 Smart Investing & Trading Score: 68 | |
| Day Percent Change: 0.93% Day Change: 0.13 | |
| Week Change: -0.46% Year-to-date Change: -7.0% | |
| LTH Links: Profile News Message Board | |
| Charts:- Daily , Weekly | |
| Add LTH to Watchlist: View: Get Complete LTH Trend Analysis ➞ | |
 | EMBC Embecta Corp. |
| Sector: Health Care | |
| SubSector: Medical Instruments & Supplies | |
| MarketCap: 1260 Millions | |
| Recent Price: 10.26 Smart Investing & Trading Score: 60 | |
| Day Percent Change: 0.20% Day Change: 0.02 | |
| Week Change: -0.48% Year-to-date Change: -46.3% | |
| EMBC Links: Profile News Message Board | |
| Charts:- Daily , Weekly | |
| Add EMBC to Watchlist: View: Get Complete EMBC Trend Analysis ➞ | |
 | RAMP LiveRamp Holdings, Inc. |
| Sector: Technology | |
| SubSector: Information Technology Services | |
| MarketCap: 2124.38 Millions | |
| Recent Price: 32.46 Smart Investing & Trading Score: 42 | |
| Day Percent Change: -0.06% Day Change: -0.02 | |
| Week Change: -0.55% Year-to-date Change: -14.3% | |
| RAMP Links: Profile News Message Board | |
| Charts:- Daily , Weekly | |
| Add RAMP to Watchlist: View: Get Complete RAMP Trend Analysis ➞ | |
| For tabular summary view of above stock list: Summary View ➞ 0 - 25 , 25 - 50 , 50 - 75 , 75 - 100 , 100 - 125 , 125 - 150 , 150 - 175 , 175 - 200 , 200 - 225 , 225 - 250 , 250 - 275 , 275 - 300 , 300 - 325 , 325 - 350 , 350 - 375 , 375 - 400 , 400 - 425 , 425 - 450 , 450 - 475 , 475 - 500 , 500 - 525 , 525 - 550 , 550 - 575 , 575 - 600 , 600 - 625 , 625 - 650 , 650 - 675 , 675 - 700 | ||
| Click To Change The Sort Order: By Market Cap or Company Size Performance: Year-to-date, Week and Day | |
| Select Chart Type: | ||
| Too many stocks? View smallcap stocks filtered by marketcap & sector |
| Marketcap: All SmallCap Stocks (default-no microcap), Large, Mid-Range, Small & MicroCap |
| Sector: Tech, Finance, Energy, Staples, Retail, Industrial, Materials, Utilities & Medical |
|
Best Stocks Today 12Stocks.com |
© 2024 12Stocks.com Terms & Conditions Privacy Contact Us
All Information Provided Only For Education And Not To Be Used For Investing or Trading. See Terms & Conditions


One More Thing ... Get Best Stocks Delivered Daily!
Never Ever Miss A Move With Our Top Ten Stocks Lists
Find Best Stocks In Any Market - Bull or Bear Market
Take A Peek At Our Top Ten Stocks Lists: Daily, Weekly, Year-to-Date & Top Trends
Find Best Stocks In Any Market - Bull or Bear Market
Take A Peek At Our Top Ten Stocks Lists: Daily, Weekly, Year-to-Date & Top Trends
Smallcap Stocks With Best Up Trends [0-bearish to 100-bullish]: WideOpenWest [100], FTC Solar[100], Joint [100], Origin Materials[100], Alignment Healthcare[100], IES [100], Enovix [100], El Pollo[100], Adtalem Global[100], Tidewater [100], Fluence Energy[100]
Best Smallcap Stocks Year-to-Date:
Janux [482.74%], Viking [314.62%], Longboard [272.5%], Alpine Immune[239.34%], Bakkt [199.55%], Avidity Biosciences[195.24%], Vera [189.47%], Cullinan Oncology[176.9%], Super Micro[174.89%], Arcutis Bio[152.48%], Y-mAbs [151.25%] Best Smallcap Stocks This Week:
Emergent BioSolutions[93.75%], Deciphera [73.07%], Eyenovia [68.74%], Origin Materials[66.52%], Aspen Aerogels[55.78%], Enovix [54.02%], Codexis [45.3%], Carvana Co[44.59%], Luna Innovations[42.96%], Cue Biopharma[41.39%], Office Properties[41.29%] Best Smallcap Stocks Daily:
Twist Bioscience[29.18%], WideOpenWest [29.16%], Ardelyx [26.73%], Luna Innovations[26.44%], FTC Solar[25.09%], Joint [23.48%], Origin Materials[22.23%], Alignment Healthcare[21.97%], 2U [20.34%], IES [19.85%], Aurora Innovation[18.09%]