
 Login Sign Up


| |||||
 |  | ||||

| 12Stocks.com Market Intelligence |
Best SmallCap Stocks
|
| In a hurry? Small Cap Stock Lists: Performance Trends Table, Stock Charts
Sort Small Cap stocks: Daily, Weekly, Year-to-Date, Market Cap & Trends. Filter Small Cap stocks list by sector: Show all, Tech, Finance, Energy, Staples, Retail, Industrial, Materials, Utilities and HealthCare Filter Small Cap stocks list by size: All Large Medium Small and MicroCap |
| 12Stocks.com Small Cap Stocks Performances & Trends Daily | |||||||||
|
|  The overall Smart Investing & Trading Score is 69 (0-bearish to 100-bullish) which puts Small Cap index in short term neutral to bullish trend. The Smart Investing & Trading Score from previous trading session is 49 and hence an improvement of trend.
| ||||||||
Here are the Smart Investing & Trading Scores of the most requested small cap stocks at 12Stocks.com (click stock name for detailed review):
|


| 12Stocks.com: Investing in Smallcap Index with Stocks | |
|
The following table helps investors and traders sort through current performance and trends (as measured by Smart Investing & Trading Score) of various
stocks in the Smallcap Index. Quick View: Move mouse or cursor over stock symbol (ticker) to view short-term technical chart and over stock name to view long term chart. Click on  to add stock symbol to your watchlist and to add stock symbol to your watchlist and  to view watchlist. Click on any ticker or stock name for detailed market intelligence report for that stock. to view watchlist. Click on any ticker or stock name for detailed market intelligence report for that stock. |
12Stocks.com Performance of Stocks in Smallcap Index
| Ticker | Stock Name | Watchlist | Category | Recent Price | Smart Investing & Trading Score | Change % | Weekly Change% |
| JJSF | J & J Snack Foods |   | Consumer Staples | 137.96 | 33 | 0.32% | 0.94% |
| PUBM | PubMatic | | Technology | 23.43 | 78 | 1.45% | 0.93% |
| NTCT | NetScout Systems | | Technology | 20.07 | 74 | -0.94% | 0.85% |
| DOOR | Masonite | | Industrials | 132.70 | 78 | 0.00% | 0.83% |
| HOMB | Home Bancshares | | Financials | 24.62 | 93 | 0.86% | 0.82% |
| NUS | Nu Skin | | Consumer Staples | 12.41 | 67 | 2.14% | 0.81% |
| NWN | Northwest Natural | | Utilities | 38.63 | 83 | -0.41% | 0.81% |
| RNST | Renasant | | Financials | 30.09 | 74 | -0.03% | 0.80% |
| SSB | South State | | Financials | 78.57 | 50 | 0.41% | 0.80% |
| CNNE | Cannae | | Financials | 20.15 | 32 | 2.13% | 0.80% |
| APAM | Artisan Partners | | Financials | 42.29 | 32 | 0.86% | 0.79% |
| FCFS | FirstCash | | Financials | 116.48 | 45 | 1.41% | 0.67% |
| ODP | Office Depot | | Services & Goods | 51.72 | 64 | 1.59% | 0.64% |
| VSH | Vishay Inter | | Technology | 22.77 | 75 | 0.80% | 0.62% |
| SHEN | Shenandoah Tele | | Technology | 13.47 | 7 | 1.66% | 0.60% |
| STER | Sterling Check | | Technology | 15.40 | 52 | 0.65% | 0.59% |
| OSIS | OSI Systems | | Industrials | 135.59 | 65 | -0.11% | 0.57% |
| IOSP | Innospec | | Materials | 121.81 | 40 | 0.09% | 0.57% |
| CBT | Cabot | | Materials | 94.11 | 90 | -0.12% | 0.56% |
| JOBY | Joby Aviation | | Industrials | 5.38 | 59 | 3.46% | 0.56% |
| JOE | St. Joe | | Financials | 58.84 | 95 | 1.80% | 0.53% |
| CHCO | City Holding | | Financials | 104.65 | 78 | -0.11% | 0.51% |
| RRR | Red Rock | | Transports | 54.38 | 32 | 1.61% | 0.48% |
| CBZ | CBIZ | | Services & Goods | 73.10 | 40 | 0.76% | 0.47% |
| BXMT | Blackstone Mortgage | | Financials | 17.99 | 42 | -0.06% | 0.45% |
| For chart view version of above stock list: Chart View ➞ 0 - 25 , 25 - 50 , 50 - 75 , 75 - 100 , 100 - 125 , 125 - 150 , 150 - 175 , 175 - 200 , 200 - 225 , 225 - 250 , 250 - 275 , 275 - 300 , 300 - 325 , 325 - 350 , 350 - 375 , 375 - 400 , 400 - 425 , 425 - 450 , 450 - 475 , 475 - 500 , 500 - 525 , 525 - 550 , 550 - 575 , 575 - 600 , 600 - 625 , 625 - 650 , 650 - 675 , 675 - 700 | ||
 | Click To Change The Sort Order: By Market Cap or Company Size Performance: Year-to-date, Week and Day |  |
| Too many stocks? View smallcap stocks filtered by marketcap & sector |
| Marketcap: All SmallCap Stocks (default-no microcap), Large, Mid-Range, Small |
| Smallcap Sector: Tech, Finance, Energy, Staples, Retail, Industrial, Materials, & Medical |
|
Get the most comprehensive stock market coverage daily at 12Stocks.com ➞ Best Stocks Today ➞ Best Stocks Weekly ➞ Best Stocks Year-to-Date ➞ Best Stocks Trends ➞  Best Stocks Today 12Stocks.com Best Nasdaq Stocks ➞ Best S&P 500 Stocks ➞ Best Tech Stocks ➞ Best Biotech Stocks ➞ |
| Detailed Overview of SmallCap Stocks |
| SmallCap Technical Overview, Leaders & Laggards, Top SmallCap ETF Funds & Detailed SmallCap Stocks List, Charts, Trends & More |
| Smallcap: Technical Analysis, Trends & YTD Performance | |
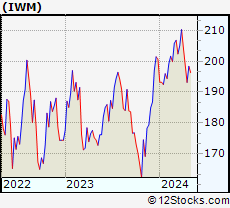
| SmallCap segment as represented by
IWM, an exchange-traded fund [ETF], holds basket of thousands of smallcap stocks from across all major sectors of the US stock market. The smallcap index (contains stocks like Riverbed & Sotheby's) is up by 0.59% and is currently underperforming the overall market by -6.29% year-to-date. Below is a quick view of technical charts and trends: | |
 IWM Weekly Chart |
|
| Long Term Trend: Not Good | |
| Medium Term Trend: Very Good | |
 IWM Daily Chart |
|
| Short Term Trend: Very Good | |
| Overall Trend Score: 69 | |
| YTD Performance: 0.59% | |
| **Trend Scores & Views Are Only For Educational Purposes And Not For Investing | |
| 12Stocks.com: Top Performing Small Cap Index Stocks | ||||||||||||||||||||||||||||||||||||||||||||||||
 The top performing Small Cap Index stocks year to date are
Now, more recently, over last week, the top performing Small Cap Index stocks on the move are


|
||||||||||||||||||||||||||||||||||||||||||||||||
| 12Stocks.com: Investing in Smallcap Index using Exchange Traded Funds | |
|
The following table shows list of key exchange traded funds (ETF) that
help investors track Smallcap index. The following list also includes leveraged ETF funds that track twice or thrice the daily returns of Smallcap indices. Short or inverse ETF funds move in the opposite direction to the index they track and are useful during market pullbacks or during bear markets. Quick View: Move mouse or cursor over ETF symbol (ticker) to view short-term technical chart and over ETF name to view long term chart. Click on ticker or stock name for detailed view. Click on to add stock symbol to your watchlist and to view watchlist. |
12Stocks.com List of ETFs that track Smallcap Index
| Ticker | ETF Name | Watchlist | Recent Price | Smart Investing & Trading Score | Change % | Week % | Year-to-date % |
| IWM | iShares Russell 2000 | | 201.90 | 69 | 0.99 | 1.77 | 0.59% |
| IJR | iShares Core S&P Small-Cap | | 107.13 | 82 | 0.75 | 1.4 | -1.03% |
| VTWO | Vanguard Russell 2000 ETF | | 81.61 | 37 | 0.94 | 1.73 | 0.63% |
| IWN | iShares Russell 2000 Value | | 154.21 | 57 | 0.87 | 2.03 | -0.72% |
| IJS | iShares S&P Small-Cap 600 Value | | 98.72 | 44 | 0.71 | 1.57 | -4.22% |
| IWO | iShares Russell 2000 Growth | | 256.87 | 27 | 0.99 | 1.49 | 1.84% |
| IJT | iShares S&P Small-Cap 600 Growth | | 127.79 | 57 | 0.84 | 1.35 | 2.12% |
| XSLV | PowerShares S&P SmallCap Low Volatil ETF | | 43.28 | 67 | 0.34 | 1.32 | -1.96% |
| SBB | ProShares Short SmallCap600 | | 16.22 | 41 | -0.92 | -1.01 | 1.82% |
| SDD | ProShares UltraShort SmallCap600 | | 18.84 | 10 | -2.43 | -2.64 | 2.24% |
| SAA | ProShares Ultra SmallCap600 | | 23.93 | 82 | 4.36 | 3.88 | -4.07% |
| SMLV | SPDR SSGA US Small Cap Low Volatil ETF | | 109.69 | 75 | 0.78 | 2.01 | -2.52% |
| 12Stocks.com: Charts, Trends, Fundamental Data and Performances of SmallCap Stocks | |
|
We now take in-depth look at all SmallCap stocks including charts, multi-period performances and overall trends (as measured by Smart Investing & Trading Score). One can sort SmallCap stocks (click link to choose) by Daily, Weekly and by Year-to-Date performances. Also, one can sort by size of the company or by market capitalization. |
| Select Your Default Chart Type: | |||||
| |||||
| Click on stock symbol or name for detailed view. Click on to add stock symbol to your watchlist and to view watchlist. Quick View: Move mouse or cursor over "Daily" to quickly view daily technical stock chart and over "Weekly" to view weekly technical stock chart. | |||||

 | JJSF J & J Snack Foods Corp. |
| Sector: Consumer Staples | |
| SubSector: Processed & Packaged Goods | |
| MarketCap: 2706.28 Millions | |
| Recent Price: 137.96 Smart Investing & Trading Score: 33 | |
| Day Percent Change: 0.32% Day Change: 0.44 | |
| Week Change: 0.94% Year-to-date Change: -17.5% | |
| JJSF Links: Profile News Message Board | |
| Charts:- Daily , Weekly | |
| Add JJSF to Watchlist: View: Get Complete JJSF Trend Analysis ➞ | |
 | PUBM PubMatic, Inc. |
| Sector: Technology | |
| SubSector: Software Application | |
| MarketCap: 56787 Millions | |
| Recent Price: 23.43 Smart Investing & Trading Score: 78 | |
| Day Percent Change: 1.45% Day Change: 0.34 | |
| Week Change: 0.93% Year-to-date Change: 43.7% | |
| PUBM Links: Profile News Message Board | |
| Charts:- Daily , Weekly | |
| Add PUBM to Watchlist: View: Get Complete PUBM Trend Analysis ➞ | |
 | NTCT NetScout Systems, Inc. |
| Sector: Technology | |
| SubSector: Business Software & Services | |
| MarketCap: 1657.28 Millions | |
| Recent Price: 20.07 Smart Investing & Trading Score: 74 | |
| Day Percent Change: -0.94% Day Change: -0.19 | |
| Week Change: 0.85% Year-to-date Change: -8.6% | |
| NTCT Links: Profile News Message Board | |
| Charts:- Daily , Weekly | |
| Add NTCT to Watchlist: View: Get Complete NTCT Trend Analysis ➞ | |
 | DOOR Masonite International Corporation |
| Sector: Industrials | |
| SubSector: General Building Materials | |
| MarketCap: 1220.53 Millions | |
| Recent Price: 132.70 Smart Investing & Trading Score: 78 | |
| Day Percent Change: 0.00% Day Change: 0.00 | |
| Week Change: 0.83% Year-to-date Change: 56.7% | |
| DOOR Links: Profile News Message Board | |
| Charts:- Daily , Weekly | |
| Add DOOR to Watchlist: View: Get Complete DOOR Trend Analysis ➞ | |
 | HOMB Home Bancshares, Inc. (Conway, AR) |
| Sector: Financials | |
| SubSector: Money Center Banks | |
| MarketCap: 2090.49 Millions | |
| Recent Price: 24.62 Smart Investing & Trading Score: 93 | |
| Day Percent Change: 0.86% Day Change: 0.21 | |
| Week Change: 0.82% Year-to-date Change: -2.8% | |
| HOMB Links: Profile News Message Board | |
| Charts:- Daily , Weekly | |
| Add HOMB to Watchlist: View: Get Complete HOMB Trend Analysis ➞ | |
 | NUS Nu Skin Enterprises, Inc. |
| Sector: Consumer Staples | |
| SubSector: Personal Products | |
| MarketCap: 1230.85 Millions | |
| Recent Price: 12.41 Smart Investing & Trading Score: 67 | |
| Day Percent Change: 2.14% Day Change: 0.26 | |
| Week Change: 0.81% Year-to-date Change: -36.1% | |
| NUS Links: Profile News Message Board | |
| Charts:- Daily , Weekly | |
| Add NUS to Watchlist: View: Get Complete NUS Trend Analysis ➞ | |
 | NWN Northwest Natural Holding Company |
| Sector: Utilities | |
| SubSector: Gas Utilities | |
| MarketCap: 2058.17 Millions | |
| Recent Price: 38.63 Smart Investing & Trading Score: 83 | |
| Day Percent Change: -0.41% Day Change: -0.16 | |
| Week Change: 0.81% Year-to-date Change: -0.8% | |
| NWN Links: Profile News Message Board | |
| Charts:- Daily , Weekly | |
| Add NWN to Watchlist: View: Get Complete NWN Trend Analysis ➞ | |
 | RNST Renasant Corporation |
| Sector: Financials | |
| SubSector: Money Center Banks | |
| MarketCap: 1279.39 Millions | |
| Recent Price: 30.09 Smart Investing & Trading Score: 74 | |
| Day Percent Change: -0.03% Day Change: -0.01 | |
| Week Change: 0.8% Year-to-date Change: -10.7% | |
| RNST Links: Profile News Message Board | |
| Charts:- Daily , Weekly | |
| Add RNST to Watchlist: View: Get Complete RNST Trend Analysis ➞ | |
 | SSB South State Corporation |
| Sector: Financials | |
| SubSector: Regional - Mid-Atlantic Banks | |
| MarketCap: 2113.49 Millions | |
| Recent Price: 78.57 Smart Investing & Trading Score: 50 | |
| Day Percent Change: 0.41% Day Change: 0.32 | |
| Week Change: 0.8% Year-to-date Change: -7.0% | |
| SSB Links: Profile News Message Board | |
| Charts:- Daily , Weekly | |
| Add SSB to Watchlist: View: Get Complete SSB Trend Analysis ➞ | |
 | CNNE Cannae Holdings, Inc. |
| Sector: Financials | |
| SubSector: Asset Management | |
| MarketCap: 2625.53 Millions | |
| Recent Price: 20.15 Smart Investing & Trading Score: 32 | |
| Day Percent Change: 2.13% Day Change: 0.42 | |
| Week Change: 0.8% Year-to-date Change: 3.3% | |
| CNNE Links: Profile News Message Board | |
| Charts:- Daily , Weekly | |
| Add CNNE to Watchlist: View: Get Complete CNNE Trend Analysis ➞ | |
 | APAM Artisan Partners Asset Management Inc. |
| Sector: Financials | |
| SubSector: Asset Management | |
| MarketCap: 1688.33 Millions | |
| Recent Price: 42.29 Smart Investing & Trading Score: 32 | |
| Day Percent Change: 0.86% Day Change: 0.36 | |
| Week Change: 0.79% Year-to-date Change: -4.3% | |
| APAM Links: Profile News Message Board | |
| Charts:- Daily , Weekly | |
| Add APAM to Watchlist: View: Get Complete APAM Trend Analysis ➞ | |
 | FCFS FirstCash, Inc. |
| Sector: Financials | |
| SubSector: Credit Services | |
| MarketCap: 2795.48 Millions | |
| Recent Price: 116.48 Smart Investing & Trading Score: 45 | |
| Day Percent Change: 1.41% Day Change: 1.62 | |
| Week Change: 0.67% Year-to-date Change: 7.5% | |
| FCFS Links: Profile News Message Board | |
| Charts:- Daily , Weekly | |
| Add FCFS to Watchlist: View: Get Complete FCFS Trend Analysis ➞ | |
 | ODP Office Depot, Inc. |
| Sector: Services & Goods | |
| SubSector: Specialty Retail, Other | |
| MarketCap: 1024.44 Millions | |
| Recent Price: 51.72 Smart Investing & Trading Score: 64 | |
| Day Percent Change: 1.59% Day Change: 0.81 | |
| Week Change: 0.64% Year-to-date Change: -8.1% | |
| ODP Links: Profile News Message Board | |
| Charts:- Daily , Weekly | |
| Add ODP to Watchlist: View: Get Complete ODP Trend Analysis ➞ | |
 | VSH Vishay Intertechnology, Inc. |
| Sector: Technology | |
| SubSector: Semiconductor - Broad Line | |
| MarketCap: 2132.52 Millions | |
| Recent Price: 22.77 Smart Investing & Trading Score: 75 | |
| Day Percent Change: 0.80% Day Change: 0.18 | |
| Week Change: 0.62% Year-to-date Change: -5.0% | |
| VSH Links: Profile News Message Board | |
| Charts:- Daily , Weekly | |
| Add VSH to Watchlist: View: Get Complete VSH Trend Analysis ➞ | |
 | SHEN Shenandoah Telecommunications Company |
| Sector: Technology | |
| SubSector: Telecom Services - Domestic | |
| MarketCap: 2329.67 Millions | |
| Recent Price: 13.47 Smart Investing & Trading Score: 7 | |
| Day Percent Change: 1.66% Day Change: 0.22 | |
| Week Change: 0.6% Year-to-date Change: -37.7% | |
| SHEN Links: Profile News Message Board | |
| Charts:- Daily , Weekly | |
| Add SHEN to Watchlist: View: Get Complete SHEN Trend Analysis ➞ | |
 | STER Sterling Check Corp. |
| Sector: Technology | |
| SubSector: Software - Infrastructure | |
| MarketCap: 1180 Millions | |
| Recent Price: 15.40 Smart Investing & Trading Score: 52 | |
| Day Percent Change: 0.65% Day Change: 0.10 | |
| Week Change: 0.59% Year-to-date Change: 10.6% | |
| STER Links: Profile News Message Board | |
| Charts:- Daily , Weekly | |
| Add STER to Watchlist: View: Get Complete STER Trend Analysis ➞ | |
 | OSIS OSI Systems, Inc. |
| Sector: Industrials | |
| SubSector: Industrial Electrical Equipment | |
| MarketCap: 1100.39 Millions | |
| Recent Price: 135.59 Smart Investing & Trading Score: 65 | |
| Day Percent Change: -0.11% Day Change: -0.16 | |
| Week Change: 0.57% Year-to-date Change: 5.1% | |
| OSIS Links: Profile News Message Board | |
| Charts:- Daily , Weekly | |
| Add OSIS to Watchlist: View: Get Complete OSIS Trend Analysis ➞ | |
 | IOSP Innospec Inc. |
| Sector: Materials | |
| SubSector: Specialty Chemicals | |
| MarketCap: 1665.57 Millions | |
| Recent Price: 121.81 Smart Investing & Trading Score: 40 | |
| Day Percent Change: 0.09% Day Change: 0.11 | |
| Week Change: 0.57% Year-to-date Change: -1.2% | |
| IOSP Links: Profile News Message Board | |
| Charts:- Daily , Weekly | |
| Add IOSP to Watchlist: View: Get Complete IOSP Trend Analysis ➞ | |
 | CBT Cabot Corporation |
| Sector: Materials | |
| SubSector: Specialty Chemicals | |
| MarketCap: 1261.47 Millions | |
| Recent Price: 94.11 Smart Investing & Trading Score: 90 | |
| Day Percent Change: -0.12% Day Change: -0.11 | |
| Week Change: 0.56% Year-to-date Change: 12.7% | |
| CBT Links: Profile News Message Board | |
| Charts:- Daily , Weekly | |
| Add CBT to Watchlist: View: Get Complete CBT Trend Analysis ➞ | |
 | JOBY Joby Aviation, Inc. |
| Sector: Industrials | |
| SubSector: Airports & Air Services | |
| MarketCap: 5810 Millions | |
| Recent Price: 5.38 Smart Investing & Trading Score: 59 | |
| Day Percent Change: 3.46% Day Change: 0.18 | |
| Week Change: 0.56% Year-to-date Change: -19.0% | |
| JOBY Links: Profile News Message Board | |
| Charts:- Daily , Weekly | |
| Add JOBY to Watchlist: View: Get Complete JOBY Trend Analysis ➞ | |
 | JOE The St. Joe Company |
| Sector: Financials | |
| SubSector: Real Estate Development | |
| MarketCap: 1029.39 Millions | |
| Recent Price: 58.84 Smart Investing & Trading Score: 95 | |
| Day Percent Change: 1.80% Day Change: 1.04 | |
| Week Change: 0.53% Year-to-date Change: -2.2% | |
| JOE Links: Profile News Message Board | |
| Charts:- Daily , Weekly | |
| Add JOE to Watchlist: View: Get Complete JOE Trend Analysis ➞ | |
 | CHCO City Holding Company |
| Sector: Financials | |
| SubSector: Regional - Mid-Atlantic Banks | |
| MarketCap: 1059.59 Millions | |
| Recent Price: 104.65 Smart Investing & Trading Score: 78 | |
| Day Percent Change: -0.11% Day Change: -0.12 | |
| Week Change: 0.51% Year-to-date Change: -5.1% | |
| CHCO Links: Profile News Message Board | |
| Charts:- Daily , Weekly | |
| Add CHCO to Watchlist: View: Get Complete CHCO Trend Analysis ➞ | |
 | RRR Red Rock Resorts, Inc. |
| Sector: Transports | |
| SubSector: Rental & Leasing Services | |
| MarketCap: 1144.04 Millions | |
| Recent Price: 54.38 Smart Investing & Trading Score: 32 | |
| Day Percent Change: 1.61% Day Change: 0.86 | |
| Week Change: 0.48% Year-to-date Change: 2.0% | |
| RRR Links: Profile News Message Board | |
| Charts:- Daily , Weekly | |
| Add RRR to Watchlist: View: Get Complete RRR Trend Analysis ➞ | |
 | CBZ CBIZ, Inc. |
| Sector: Services & Goods | |
| SubSector: Business Services | |
| MarketCap: 1121.32 Millions | |
| Recent Price: 73.10 Smart Investing & Trading Score: 40 | |
| Day Percent Change: 0.76% Day Change: 0.55 | |
| Week Change: 0.47% Year-to-date Change: 16.8% | |
| CBZ Links: Profile News Message Board | |
| Charts:- Daily , Weekly | |
| Add CBZ to Watchlist: View: Get Complete CBZ Trend Analysis ➞ | |
 | BXMT Blackstone Mortgage Trust, Inc. |
| Sector: Financials | |
| SubSector: Mortgage Investment | |
| MarketCap: 2820.69 Millions | |
| Recent Price: 17.99 Smart Investing & Trading Score: 42 | |
| Day Percent Change: -0.06% Day Change: -0.01 | |
| Week Change: 0.45% Year-to-date Change: -15.4% | |
| BXMT Links: Profile News Message Board | |
| Charts:- Daily , Weekly | |
| Add BXMT to Watchlist: View: Get Complete BXMT Trend Analysis ➞ | |
| For tabular summary view of above stock list: Summary View ➞ 0 - 25 , 25 - 50 , 50 - 75 , 75 - 100 , 100 - 125 , 125 - 150 , 150 - 175 , 175 - 200 , 200 - 225 , 225 - 250 , 250 - 275 , 275 - 300 , 300 - 325 , 325 - 350 , 350 - 375 , 375 - 400 , 400 - 425 , 425 - 450 , 450 - 475 , 475 - 500 , 500 - 525 , 525 - 550 , 550 - 575 , 575 - 600 , 600 - 625 , 625 - 650 , 650 - 675 , 675 - 700 | ||
| Click To Change The Sort Order: By Market Cap or Company Size Performance: Year-to-date, Week and Day | |
| Select Chart Type: | ||
| Too many stocks? View smallcap stocks filtered by marketcap & sector |
| Marketcap: All SmallCap Stocks (default-no microcap), Large, Mid-Range, Small & MicroCap |
| Sector: Tech, Finance, Energy, Staples, Retail, Industrial, Materials, Utilities & Medical |
|
Best Stocks Today 12Stocks.com |
© 2024 12Stocks.com Terms & Conditions Privacy Contact Us
All Information Provided Only For Education And Not To Be Used For Investing or Trading. See Terms & Conditions


One More Thing ... Get Best Stocks Delivered Daily!
Never Ever Miss A Move With Our Top Ten Stocks Lists
Find Best Stocks In Any Market - Bull or Bear Market
Take A Peek At Our Top Ten Stocks Lists: Daily, Weekly, Year-to-Date & Top Trends
Find Best Stocks In Any Market - Bull or Bear Market
Take A Peek At Our Top Ten Stocks Lists: Daily, Weekly, Year-to-Date & Top Trends
Smallcap Stocks With Best Up Trends [0-bearish to 100-bullish]: WideOpenWest [100], Joint [100], FTC Solar[100], Origin Materials[100], Alignment Healthcare[100], Clarus [100], Emergent BioSolutions[100], IES [100], Enovix [100], El Pollo[100], Adtalem Global[100]
Best Smallcap Stocks Year-to-Date:
Janux [482.74%], Viking [313.65%], Longboard [272.5%], Alpine Immune[239.23%], Bakkt [199.55%], Avidity Biosciences[192.48%], Vera [189.47%], Cullinan Oncology[176.9%], Super Micro[175.33%], Y-mAbs [151.47%], Sana [149.33%] Best Smallcap Stocks This Week:
Emergent BioSolutions[102.6%], Deciphera [73.14%], Origin Materials[66.52%], Eyenovia [57.77%], Cue Biopharma[56.04%], Aspen Aerogels[56.02%], Enovix [54.02%], Luna Innovations[53.27%], Codexis [47.37%], Carvana Co[44.31%], Office Properties[43.28%] Best Smallcap Stocks Daily:
Luna Innovations[35.56%], Twist Bioscience[28.77%], WideOpenWest [28.23%], Ardelyx [28.13%], 2U [26.26%], Joint [25.74%], FTC Solar[25.09%], Origin Materials[22.23%], Alignment Healthcare[21.97%], Clarus [18.34%], Aurora Innovation[18.09%]