
 Login Sign Up


| |||||
 |  | ||||

| 12Stocks.com Market Intelligence |
Best SmallCap Stocks
|
| In a hurry? Small Cap Stock Lists: Performance Trends Table, Stock Charts
Sort Small Cap stocks: Daily, Weekly, Year-to-Date, Market Cap & Trends. Filter Small Cap stocks list by sector: Show all, Tech, Finance, Energy, Staples, Retail, Industrial, Materials, Utilities and HealthCare Filter Small Cap stocks list by size: All Large Medium Small and MicroCap |
| 12Stocks.com Small Cap Stocks Performances & Trends Daily | |||||||||
|
|  The overall Smart Investing & Trading Score is 69 (0-bearish to 100-bullish) which puts Small Cap index in short term neutral to bullish trend. The Smart Investing & Trading Score from previous trading session is 49 and hence an improvement of trend.
| ||||||||
Here are the Smart Investing & Trading Scores of the most requested small cap stocks at 12Stocks.com (click stock name for detailed review):
|


| 12Stocks.com: Investing in Smallcap Index with Stocks | |
|
The following table helps investors and traders sort through current performance and trends (as measured by Smart Investing & Trading Score) of various
stocks in the Smallcap Index. Quick View: Move mouse or cursor over stock symbol (ticker) to view short-term technical chart and over stock name to view long term chart. Click on  to add stock symbol to your watchlist and to add stock symbol to your watchlist and  to view watchlist. Click on any ticker or stock name for detailed market intelligence report for that stock. to view watchlist. Click on any ticker or stock name for detailed market intelligence report for that stock. |
12Stocks.com Performance of Stocks in Smallcap Index
| Ticker | Stock Name | Watchlist | Category | Recent Price | Smart Investing & Trading Score | Change % | Weekly Change% |
| TCBI | Texas Capital |   | Financials | 60.61 | 100 | 1.20% | 4.84% |
| KROS | Keros | | Health Care | 60.65 | 59 | 6.22% | 4.82% |
| USNA | USANA Health | | Health Care | 45.55 | 67 | -3.29% | 4.78% |
| SAFE | Safehold | | Financials | 19.08 | 67 | 2.25% | 4.78% |
| RXO | RXO | | Industrials | 20.29 | 49 | -0.17% | 4.78% |
| EPRT | Essential Properties | | Financials | 26.91 | 100 | 0.34% | 4.75% |
| MTX | Minerals | | Materials | 77.19 | 100 | 2.61% | 4.74% |
| CPK | Chesapeake Utilities | | Utilities | 110.05 | 100 | 0.76% | 4.68% |
| ICFI | ICF | | Services & Goods | 148.50 | 64 | 1.52% | 4.66% |
| TGNA | TEGNA | | Services & Goods | 14.17 | 100 | 0.14% | 4.65% |
| UHT | Universal Health | | Financials | 36.26 | 69 | -1.47% | 4.62% |
| WERN | Werner Enterprises | | Transports | 36.33 | 59 | 1.65% | 4.58% |
| RXT | Rackspace | | Technology | 1.83 | 69 | 5.17% | 4.57% |
| CMC | Commercial Metals | | Materials | 55.90 | 90 | -0.99% | 4.53% |
| CVBF | CVB Financial | | Financials | 17.22 | 100 | 1.71% | 4.49% |
| TWO | Two Harbors | | Financials | 13.09 | 100 | 1.63% | 4.47% |
| MTH | Meritage Homes | | Industrials | 177.04 | 95 | 2.26% | 4.46% |
| TMCI | Treace Medical | | Health Care | 10.85 | 42 | 1.21% | 4.43% |
| PFSI | PennyMac Financial | | Financials | 90.84 | 83 | 3.32% | 4.41% |
| BHVN | Biohaven Pharmaceutical | | Health Care | 40.69 | 39 | 1.98% | 4.41% |
| FIX | Comfort Systems | | Industrials | 315.03 | 85 | 2.38% | 4.31% |
| EHTH | eHealth | | Financials | 4.72 | 49 | 2.72% | 4.30% |
| NNOX | Nano X | | Health Care | 9.35 | 42 | 1.14% | 4.30% |
| SSD | Simpson | | Industrials | 181.05 | 42 | 1.59% | 4.29% |
| AXSM | Axsome | | Health Care | 74.76 | 59 | 0.77% | 4.25% |
| For chart view version of above stock list: Chart View ➞ 0 - 25 , 25 - 50 , 50 - 75 , 75 - 100 , 100 - 125 , 125 - 150 , 150 - 175 , 175 - 200 , 200 - 225 , 225 - 250 , 250 - 275 , 275 - 300 , 300 - 325 , 325 - 350 , 350 - 375 , 375 - 400 , 400 - 425 , 425 - 450 , 450 - 475 , 475 - 500 , 500 - 525 , 525 - 550 , 550 - 575 , 575 - 600 , 600 - 625 , 625 - 650 , 650 - 675 , 675 - 700 | ||
 | Click To Change The Sort Order: By Market Cap or Company Size Performance: Year-to-date, Week and Day |  |
| Too many stocks? View smallcap stocks filtered by marketcap & sector |
| Marketcap: All SmallCap Stocks (default-no microcap), Large, Mid-Range, Small |
| Smallcap Sector: Tech, Finance, Energy, Staples, Retail, Industrial, Materials, & Medical |
|
Get the most comprehensive stock market coverage daily at 12Stocks.com ➞ Best Stocks Today ➞ Best Stocks Weekly ➞ Best Stocks Year-to-Date ➞ Best Stocks Trends ➞  Best Stocks Today 12Stocks.com Best Nasdaq Stocks ➞ Best S&P 500 Stocks ➞ Best Tech Stocks ➞ Best Biotech Stocks ➞ |
| Detailed Overview of SmallCap Stocks |
| SmallCap Technical Overview, Leaders & Laggards, Top SmallCap ETF Funds & Detailed SmallCap Stocks List, Charts, Trends & More |
| Smallcap: Technical Analysis, Trends & YTD Performance | |
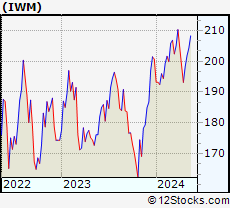
| SmallCap segment as represented by
IWM, an exchange-traded fund [ETF], holds basket of thousands of smallcap stocks from across all major sectors of the US stock market. The smallcap index (contains stocks like Riverbed & Sotheby's) is up by 0.59% and is currently underperforming the overall market by -6.29% year-to-date. Below is a quick view of technical charts and trends: | |
 IWM Weekly Chart |
|
| Long Term Trend: Not Good | |
| Medium Term Trend: Very Good | |
 IWM Daily Chart |
|
| Short Term Trend: Very Good | |
| Overall Trend Score: 69 | |
| YTD Performance: 0.59% | |
| **Trend Scores & Views Are Only For Educational Purposes And Not For Investing | |
| 12Stocks.com: Top Performing Small Cap Index Stocks | ||||||||||||||||||||||||||||||||||||||||||||||||
 The top performing Small Cap Index stocks year to date are
Now, more recently, over last week, the top performing Small Cap Index stocks on the move are


|
||||||||||||||||||||||||||||||||||||||||||||||||
| 12Stocks.com: Investing in Smallcap Index using Exchange Traded Funds | |
|
The following table shows list of key exchange traded funds (ETF) that
help investors track Smallcap index. The following list also includes leveraged ETF funds that track twice or thrice the daily returns of Smallcap indices. Short or inverse ETF funds move in the opposite direction to the index they track and are useful during market pullbacks or during bear markets. Quick View: Move mouse or cursor over ETF symbol (ticker) to view short-term technical chart and over ETF name to view long term chart. Click on ticker or stock name for detailed view. Click on to add stock symbol to your watchlist and to view watchlist. |
12Stocks.com List of ETFs that track Smallcap Index
| Ticker | ETF Name | Watchlist | Recent Price | Smart Investing & Trading Score | Change % | Week % | Year-to-date % |
| IWM | iShares Russell 2000 | | 201.90 | 69 | 0.99 | 1.77 | 0.59% |
| IJR | iShares Core S&P Small-Cap | | 107.13 | 82 | 0.75 | 1.4 | -1.03% |
| VTWO | Vanguard Russell 2000 ETF | | 81.61 | 37 | 0.94 | 1.73 | 0.63% |
| IWN | iShares Russell 2000 Value | | 154.21 | 57 | 0.87 | 2.03 | -0.72% |
| IJS | iShares S&P Small-Cap 600 Value | | 98.72 | 44 | 0.71 | 1.57 | -4.22% |
| IWO | iShares Russell 2000 Growth | | 256.87 | 27 | 0.99 | 1.49 | 1.84% |
| IJT | iShares S&P Small-Cap 600 Growth | | 127.79 | 57 | 0.84 | 1.35 | 2.12% |
| XSLV | PowerShares S&P SmallCap Low Volatil ETF | | 43.28 | 67 | 0.34 | 1.32 | -1.96% |
| SBB | ProShares Short SmallCap600 | | 16.22 | 41 | -0.92 | -1.01 | 1.82% |
| SDD | ProShares UltraShort SmallCap600 | | 18.84 | 10 | -2.43 | -2.64 | 2.24% |
| SAA | ProShares Ultra SmallCap600 | | 23.93 | 82 | 4.36 | 3.88 | -4.07% |
| SMLV | SPDR SSGA US Small Cap Low Volatil ETF | | 109.69 | 75 | 0.78 | 2.01 | -2.52% |
| 12Stocks.com: Charts, Trends, Fundamental Data and Performances of SmallCap Stocks | |
|
We now take in-depth look at all SmallCap stocks including charts, multi-period performances and overall trends (as measured by Smart Investing & Trading Score). One can sort SmallCap stocks (click link to choose) by Daily, Weekly and by Year-to-Date performances. Also, one can sort by size of the company or by market capitalization. |
| Select Your Default Chart Type: | |||||
| |||||
| Click on stock symbol or name for detailed view. Click on to add stock symbol to your watchlist and to view watchlist. Quick View: Move mouse or cursor over "Daily" to quickly view daily technical stock chart and over "Weekly" to view weekly technical stock chart. | |||||

 | TCBI Texas Capital Bancshares, Inc. |
| Sector: Financials | |
| SubSector: Regional - Southwest Banks | |
| MarketCap: 1202.75 Millions | |
| Recent Price: 60.61 Smart Investing & Trading Score: 100 | |
| Day Percent Change: 1.20% Day Change: 0.72 | |
| Week Change: 4.84% Year-to-date Change: -6.2% | |
| TCBI Links: Profile News Message Board | |
| Charts:- Daily , Weekly | |
| Add TCBI to Watchlist: View: Get Complete TCBI Trend Analysis ➞ | |
 | KROS Keros Therapeutics, Inc. |
| Sector: Health Care | |
| SubSector: Biotechnology | |
| MarketCap: 17887 Millions | |
| Recent Price: 60.65 Smart Investing & Trading Score: 59 | |
| Day Percent Change: 6.22% Day Change: 3.55 | |
| Week Change: 4.82% Year-to-date Change: 52.2% | |
| KROS Links: Profile News Message Board | |
| Charts:- Daily , Weekly | |
| Add KROS to Watchlist: View: Get Complete KROS Trend Analysis ➞ | |
 | USNA USANA Health Sciences, Inc. |
| Sector: Health Care | |
| SubSector: Drug Related Products | |
| MarketCap: 1185.13 Millions | |
| Recent Price: 45.55 Smart Investing & Trading Score: 67 | |
| Day Percent Change: -3.29% Day Change: -1.55 | |
| Week Change: 4.78% Year-to-date Change: -15.0% | |
| USNA Links: Profile News Message Board | |
| Charts:- Daily , Weekly | |
| Add USNA to Watchlist: View: Get Complete USNA Trend Analysis ➞ | |
 | SAFE Safehold Inc. |
| Sector: Financials | |
| SubSector: REIT - Diversified | |
| MarketCap: 2994.63 Millions | |
| Recent Price: 19.08 Smart Investing & Trading Score: 67 | |
| Day Percent Change: 2.25% Day Change: 0.42 | |
| Week Change: 4.78% Year-to-date Change: -18.5% | |
| SAFE Links: Profile News Message Board | |
| Charts:- Daily , Weekly | |
| Add SAFE to Watchlist: View: Get Complete SAFE Trend Analysis ➞ | |
 | RXO RXO, Inc. |
| Sector: Industrials | |
| SubSector: Trucking | |
| MarketCap: 2550 Millions | |
| Recent Price: 20.29 Smart Investing & Trading Score: 49 | |
| Day Percent Change: -0.17% Day Change: -0.04 | |
| Week Change: 4.78% Year-to-date Change: -13.2% | |
| RXO Links: Profile News Message Board | |
| Charts:- Daily , Weekly | |
| Add RXO to Watchlist: View: Get Complete RXO Trend Analysis ➞ | |
 | EPRT Essential Properties Realty Trust, Inc. |
| Sector: Financials | |
| SubSector: REIT - Diversified | |
| MarketCap: 1424.43 Millions | |
| Recent Price: 26.91 Smart Investing & Trading Score: 100 | |
| Day Percent Change: 0.34% Day Change: 0.09 | |
| Week Change: 4.75% Year-to-date Change: 5.3% | |
| EPRT Links: Profile News Message Board | |
| Charts:- Daily , Weekly | |
| Add EPRT to Watchlist: View: Get Complete EPRT Trend Analysis ➞ | |
 | MTX Minerals Technologies Inc. |
| Sector: Materials | |
| SubSector: Chemicals - Major Diversified | |
| MarketCap: 1155.36 Millions | |
| Recent Price: 77.19 Smart Investing & Trading Score: 100 | |
| Day Percent Change: 2.61% Day Change: 1.96 | |
| Week Change: 4.74% Year-to-date Change: 8.3% | |
| MTX Links: Profile News Message Board | |
| Charts:- Daily , Weekly | |
| Add MTX to Watchlist: View: Get Complete MTX Trend Analysis ➞ | |
 | CPK Chesapeake Utilities Corporation |
| Sector: Utilities | |
| SubSector: Gas Utilities | |
| MarketCap: 1465.77 Millions | |
| Recent Price: 110.05 Smart Investing & Trading Score: 100 | |
| Day Percent Change: 0.76% Day Change: 0.83 | |
| Week Change: 4.68% Year-to-date Change: 4.2% | |
| CPK Links: Profile News Message Board | |
| Charts:- Daily , Weekly | |
| Add CPK to Watchlist: View: Get Complete CPK Trend Analysis ➞ | |
 | ICFI ICF International, Inc. |
| Sector: Services & Goods | |
| SubSector: Management Services | |
| MarketCap: 1218.75 Millions | |
| Recent Price: 148.50 Smart Investing & Trading Score: 64 | |
| Day Percent Change: 1.52% Day Change: 2.23 | |
| Week Change: 4.66% Year-to-date Change: 10.8% | |
| ICFI Links: Profile News Message Board | |
| Charts:- Daily , Weekly | |
| Add ICFI to Watchlist: View: Get Complete ICFI Trend Analysis ➞ | |
 | TGNA TEGNA Inc. |
| Sector: Services & Goods | |
| SubSector: Broadcasting - TV | |
| MarketCap: 2791.83 Millions | |
| Recent Price: 14.17 Smart Investing & Trading Score: 100 | |
| Day Percent Change: 0.14% Day Change: 0.02 | |
| Week Change: 4.65% Year-to-date Change: -7.4% | |
| TGNA Links: Profile News Message Board | |
| Charts:- Daily , Weekly | |
| Add TGNA to Watchlist: View: Get Complete TGNA Trend Analysis ➞ | |
 | UHT Universal Health Realty Income Trust |
| Sector: Financials | |
| SubSector: REIT - Healthcare Facilities | |
| MarketCap: 1121.14 Millions | |
| Recent Price: 36.26 Smart Investing & Trading Score: 69 | |
| Day Percent Change: -1.47% Day Change: -0.54 | |
| Week Change: 4.62% Year-to-date Change: -16.2% | |
| UHT Links: Profile News Message Board | |
| Charts:- Daily , Weekly | |
| Add UHT to Watchlist: View: Get Complete UHT Trend Analysis ➞ | |
 | WERN Werner Enterprises, Inc. |
| Sector: Transports | |
| SubSector: Trucking | |
| MarketCap: 2409.65 Millions | |
| Recent Price: 36.33 Smart Investing & Trading Score: 59 | |
| Day Percent Change: 1.65% Day Change: 0.59 | |
| Week Change: 4.58% Year-to-date Change: -14.3% | |
| WERN Links: Profile News Message Board | |
| Charts:- Daily , Weekly | |
| Add WERN to Watchlist: View: Get Complete WERN Trend Analysis ➞ | |
 | RXT Rackspace Technology, Inc. |
| Sector: Technology | |
| SubSector: Software Infrastructure | |
| MarketCap: 40287 Millions | |
| Recent Price: 1.83 Smart Investing & Trading Score: 69 | |
| Day Percent Change: 5.17% Day Change: 0.09 | |
| Week Change: 4.57% Year-to-date Change: -8.7% | |
| RXT Links: Profile News Message Board | |
| Charts:- Daily , Weekly | |
| Add RXT to Watchlist: View: Get Complete RXT Trend Analysis ➞ | |
 | CMC Commercial Metals Company |
| Sector: Materials | |
| SubSector: Steel & Iron | |
| MarketCap: 1724.78 Millions | |
| Recent Price: 55.90 Smart Investing & Trading Score: 90 | |
| Day Percent Change: -0.99% Day Change: -0.56 | |
| Week Change: 4.53% Year-to-date Change: 11.7% | |
| CMC Links: Profile News Message Board | |
| Charts:- Daily , Weekly | |
| Add CMC to Watchlist: View: Get Complete CMC Trend Analysis ➞ | |
 | CVBF CVB Financial Corp. |
| Sector: Financials | |
| SubSector: Regional - Pacific Banks | |
| MarketCap: 2699.99 Millions | |
| Recent Price: 17.22 Smart Investing & Trading Score: 100 | |
| Day Percent Change: 1.71% Day Change: 0.29 | |
| Week Change: 4.49% Year-to-date Change: -14.7% | |
| CVBF Links: Profile News Message Board | |
| Charts:- Daily , Weekly | |
| Add CVBF to Watchlist: View: Get Complete CVBF Trend Analysis ➞ | |
 | TWO Two Harbors Investment Corp. |
| Sector: Financials | |
| SubSector: Mortgage Investment | |
| MarketCap: 1979.59 Millions | |
| Recent Price: 13.09 Smart Investing & Trading Score: 100 | |
| Day Percent Change: 1.63% Day Change: 0.21 | |
| Week Change: 4.47% Year-to-date Change: -6.0% | |
| TWO Links: Profile News Message Board | |
| Charts:- Daily , Weekly | |
| Add TWO to Watchlist: View: Get Complete TWO Trend Analysis ➞ | |
 | MTH Meritage Homes Corporation |
| Sector: Industrials | |
| SubSector: Residential Construction | |
| MarketCap: 1440.36 Millions | |
| Recent Price: 177.04 Smart Investing & Trading Score: 95 | |
| Day Percent Change: 2.26% Day Change: 3.92 | |
| Week Change: 4.46% Year-to-date Change: 1.6% | |
| MTH Links: Profile News Message Board | |
| Charts:- Daily , Weekly | |
| Add MTH to Watchlist: View: Get Complete MTH Trend Analysis ➞ | |
 | TMCI Treace Medical Concepts, Inc. |
| Sector: Health Care | |
| SubSector: Medical Devices | |
| MarketCap: 1550 Millions | |
| Recent Price: 10.85 Smart Investing & Trading Score: 42 | |
| Day Percent Change: 1.21% Day Change: 0.13 | |
| Week Change: 4.43% Year-to-date Change: -14.8% | |
| TMCI Links: Profile News Message Board | |
| Charts:- Daily , Weekly | |
| Add TMCI to Watchlist: View: Get Complete TMCI Trend Analysis ➞ | |
 | PFSI PennyMac Financial Services, Inc. |
| Sector: Financials | |
| SubSector: Mortgage Investment | |
| MarketCap: 1588.09 Millions | |
| Recent Price: 90.84 Smart Investing & Trading Score: 83 | |
| Day Percent Change: 3.32% Day Change: 2.92 | |
| Week Change: 4.41% Year-to-date Change: 2.8% | |
| PFSI Links: Profile News Message Board | |
| Charts:- Daily , Weekly | |
| Add PFSI to Watchlist: View: Get Complete PFSI Trend Analysis ➞ | |
 | BHVN Biohaven Pharmaceutical Holding Company Ltd. |
| Sector: Health Care | |
| SubSector: Biotechnology | |
| MarketCap: 2024.25 Millions | |
| Recent Price: 40.69 Smart Investing & Trading Score: 39 | |
| Day Percent Change: 1.98% Day Change: 0.79 | |
| Week Change: 4.41% Year-to-date Change: -4.9% | |
| BHVN Links: Profile News Message Board | |
| Charts:- Daily , Weekly | |
| Add BHVN to Watchlist: View: Get Complete BHVN Trend Analysis ➞ | |
 | FIX Comfort Systems USA, Inc. |
| Sector: Industrials | |
| SubSector: General Contractors | |
| MarketCap: 1440.63 Millions | |
| Recent Price: 315.03 Smart Investing & Trading Score: 85 | |
| Day Percent Change: 2.38% Day Change: 7.32 | |
| Week Change: 4.31% Year-to-date Change: 53.2% | |
| FIX Links: Profile News Message Board | |
| Charts:- Daily , Weekly | |
| Add FIX to Watchlist: View: Get Complete FIX Trend Analysis ➞ | |
 | EHTH eHealth, Inc. |
| Sector: Financials | |
| SubSector: Insurance Brokers | |
| MarketCap: 2813.57 Millions | |
| Recent Price: 4.72 Smart Investing & Trading Score: 49 | |
| Day Percent Change: 2.72% Day Change: 0.13 | |
| Week Change: 4.3% Year-to-date Change: -45.8% | |
| EHTH Links: Profile News Message Board | |
| Charts:- Daily , Weekly | |
| Add EHTH to Watchlist: View: Get Complete EHTH Trend Analysis ➞ | |
 | NNOX Nano X Imaging Ltd. |
| Sector: Health Care | |
| SubSector: Medical Devices | |
| MarketCap: 22587 Millions | |
| Recent Price: 9.35 Smart Investing & Trading Score: 42 | |
| Day Percent Change: 1.14% Day Change: 0.11 | |
| Week Change: 4.3% Year-to-date Change: 46.7% | |
| NNOX Links: Profile News Message Board | |
| Charts:- Daily , Weekly | |
| Add NNOX to Watchlist: View: Get Complete NNOX Trend Analysis ➞ | |
 | SSD Simpson Manufacturing Co., Inc. |
| Sector: Industrials | |
| SubSector: Small Tools & Accessories | |
| MarketCap: 2850.16 Millions | |
| Recent Price: 181.05 Smart Investing & Trading Score: 42 | |
| Day Percent Change: 1.59% Day Change: 2.84 | |
| Week Change: 4.29% Year-to-date Change: -8.6% | |
| SSD Links: Profile News Message Board | |
| Charts:- Daily , Weekly | |
| Add SSD to Watchlist: View: Get Complete SSD Trend Analysis ➞ | |
 | AXSM Axsome Therapeutics, Inc. |
| Sector: Health Care | |
| SubSector: Biotechnology | |
| MarketCap: 2284.25 Millions | |
| Recent Price: 74.76 Smart Investing & Trading Score: 59 | |
| Day Percent Change: 0.77% Day Change: 0.57 | |
| Week Change: 4.25% Year-to-date Change: -6.1% | |
| AXSM Links: Profile News Message Board | |
| Charts:- Daily , Weekly | |
| Add AXSM to Watchlist: View: Get Complete AXSM Trend Analysis ➞ | |
| For tabular summary view of above stock list: Summary View ➞ 0 - 25 , 25 - 50 , 50 - 75 , 75 - 100 , 100 - 125 , 125 - 150 , 150 - 175 , 175 - 200 , 200 - 225 , 225 - 250 , 250 - 275 , 275 - 300 , 300 - 325 , 325 - 350 , 350 - 375 , 375 - 400 , 400 - 425 , 425 - 450 , 450 - 475 , 475 - 500 , 500 - 525 , 525 - 550 , 550 - 575 , 575 - 600 , 600 - 625 , 625 - 650 , 650 - 675 , 675 - 700 | ||
| Click To Change The Sort Order: By Market Cap or Company Size Performance: Year-to-date, Week and Day | |
| Select Chart Type: | ||
| Too many stocks? View smallcap stocks filtered by marketcap & sector |
| Marketcap: All SmallCap Stocks (default-no microcap), Large, Mid-Range, Small & MicroCap |
| Sector: Tech, Finance, Energy, Staples, Retail, Industrial, Materials, Utilities & Medical |
|
Best Stocks Today 12Stocks.com |
© 2024 12Stocks.com Terms & Conditions Privacy Contact Us
All Information Provided Only For Education And Not To Be Used For Investing or Trading. See Terms & Conditions


One More Thing ... Get Best Stocks Delivered Daily!
Never Ever Miss A Move With Our Top Ten Stocks Lists
Find Best Stocks In Any Market - Bull or Bear Market
Take A Peek At Our Top Ten Stocks Lists: Daily, Weekly, Year-to-Date & Top Trends
Find Best Stocks In Any Market - Bull or Bear Market
Take A Peek At Our Top Ten Stocks Lists: Daily, Weekly, Year-to-Date & Top Trends
Smallcap Stocks With Best Up Trends [0-bearish to 100-bullish]: WideOpenWest [100], Joint [100], FTC Solar[100], Origin Materials[100], Alignment Healthcare[100], Clarus [100], Emergent BioSolutions[100], IES [100], Enovix [100], El Pollo[100], Adtalem Global[100]
Best Smallcap Stocks Year-to-Date:
Janux [482.74%], Viking [313.65%], Longboard [272.5%], Alpine Immune[239.23%], Bakkt [199.55%], Avidity Biosciences[192.48%], Vera [189.47%], Cullinan Oncology[176.9%], Super Micro[175.33%], Y-mAbs [151.47%], Sana [149.33%] Best Smallcap Stocks This Week:
Emergent BioSolutions[102.6%], Deciphera [73.14%], Origin Materials[66.52%], Eyenovia [57.77%], Cue Biopharma[56.04%], Aspen Aerogels[56.02%], Enovix [54.02%], Luna Innovations[53.27%], Codexis [47.37%], Carvana Co[44.31%], Office Properties[43.28%] Best Smallcap Stocks Daily:
Luna Innovations[35.56%], Twist Bioscience[28.77%], WideOpenWest [28.23%], Ardelyx [28.13%], 2U [26.26%], Joint [25.74%], FTC Solar[25.09%], Origin Materials[22.23%], Alignment Healthcare[21.97%], Clarus [18.34%], Aurora Innovation[18.09%]