
 Login Sign Up


| |||||
 |  | ||||

| 12Stocks.com Market Intelligence |
Best SmallCap Stocks
|
| In a hurry? Small Cap Stock Lists: Performance Trends Table, Stock Charts
Sort Small Cap stocks: Daily, Weekly, Year-to-Date, Market Cap & Trends. Filter Small Cap stocks list by sector: Show all, Tech, Finance, Energy, Staples, Retail, Industrial, Materials, Utilities and HealthCare Filter Small Cap stocks list by size: All Large Medium Small and MicroCap |
| 12Stocks.com Small Cap Stocks Performances & Trends Daily | |||||||||
|
|  The overall Smart Investing & Trading Score is 82 (0-bearish to 100-bullish) which puts Small Cap index in short term bullish trend. The Smart Investing & Trading Score from previous trading session is 49 and hence an improvement of trend.
| ||||||||
Here are the Smart Investing & Trading Scores of the most requested small cap stocks at 12Stocks.com (click stock name for detailed review):
|


| 12Stocks.com: Investing in Smallcap Index with Stocks | |
|
The following table helps investors and traders sort through current performance and trends (as measured by Smart Investing & Trading Score) of various
stocks in the Smallcap Index. Quick View: Move mouse or cursor over stock symbol (ticker) to view short-term technical chart and over stock name to view long term chart. Click on  to add stock symbol to your watchlist and to add stock symbol to your watchlist and  to view watchlist. Click on any ticker or stock name for detailed market intelligence report for that stock. to view watchlist. Click on any ticker or stock name for detailed market intelligence report for that stock. |
12Stocks.com Performance of Stocks in Smallcap Index
| Ticker | Stock Name | Watchlist | Category | Recent Price | Smart Investing & Trading Score | Change % | Weekly Change% |
| EBS | Emergent BioSolutions |   | Health Care | 3.88 | 100 | 17.73% | 102.34% |
| DCPH | Deciphera | | Health Care | 25.39 | 88 | 0.02% | 73.28% |
| ENVX | Enovix | | Industrials | 9.82 | 100 | 14.98% | 51.85% |
| CVNA | Carvana Co | | Services & Goods | 117.35 | 100 | 0.73% | 39.19% |
| PSTX | Poseida | | Health Care | 2.87 | 64 | 2.87% | 34.74% |
| OPI | Office Properties | | Financials | 2.69 | 74 | 5.08% | 33.83% |
| TREE | LendingTree | | Financials | 50.57 | 95 | 2.51% | 33.43% |
| LUNG | Pulmonx | | Health Care | 9.65 | 95 | 2.88% | 32.55% |
| VTYX | Ventyx Biosciences | | Health Care | 5.17 | 69 | 6.16% | 31.22% |
| TWOU | 2U | | Technology | 0.31 | 59 | 15.94% | 29.55% |
| OM | Outset Medical | | Health Care | 3.09 | 74 | 3.00% | 28.75% |
| NOVA | Sunnova Energy | | Services & Goods | 5.06 | 74 | 14.48% | 26.50% |
| PRME | Prime Medicine | | Health Care | 5.59 | 69 | 7.71% | 26.19% |
| VIR | Vir | | Health Care | 10.38 | 74 | 13.07% | 26.12% |
| TWST | Twist Bioscience | | Health Care | 39.43 | 52 | 23.18% | 25.02% |
| ALHC | Alignment Healthcare | | Health Care | 6.50 | 100 | 21.97% | 24.31% |
| ATGE | Adtalem Global | | Services & Goods | 61.23 | 90 | 16.86% | 23.26% |
| HTLF | Heartland Financial | | Financials | 43.77 | 100 | 1.19% | 22.55% |
| TGTX | TG | | Health Care | 16.49 | 74 | 0.43% | 22.42% |
| XNCR | Xencor | | Health Care | 24.46 | 100 | 3.51% | 22.42% |
| ORIC | ORIC | | Health Care | 9.81 | 49 | 3.05% | 21.56% |
| PRCT | PROCEPT BioRobotics | | Health Care | 62.71 | 100 | 2.02% | 21.09% |
| KOD | Kodiak Sciences | | Health Care | 3.95 | 44 | 6.76% | 20.43% |
| SLQT | SelectQuote | | Financials | 1.94 | 69 | 7.50% | 20.19% |
| LNZA | LanzaTech Global | | Industrials | 2.67 | 42 | 6.18% | 19.78% |
| For chart view version of above stock list: Chart View ➞ 0 - 25 , 25 - 50 , 50 - 75 , 75 - 100 , 100 - 125 , 125 - 150 , 150 - 175 , 175 - 200 , 200 - 225 , 225 - 250 , 250 - 275 , 275 - 300 , 300 - 325 , 325 - 350 , 350 - 375 , 375 - 400 , 400 - 425 , 425 - 450 , 450 - 475 , 475 - 500 , 500 - 525 , 525 - 550 , 550 - 575 , 575 - 600 , 600 - 625 , 625 - 650 , 650 - 675 , 675 - 700 | ||
 | Click To Change The Sort Order: By Market Cap or Company Size Performance: Year-to-date, Week and Day |  |
| Too many stocks? View smallcap stocks filtered by marketcap & sector |
| Marketcap: All SmallCap Stocks (default-no microcap), Large, Mid-Range, Small |
| Smallcap Sector: Tech, Finance, Energy, Staples, Retail, Industrial, Materials, & Medical |
|
Get the most comprehensive stock market coverage daily at 12Stocks.com ➞ Best Stocks Today ➞ Best Stocks Weekly ➞ Best Stocks Year-to-Date ➞ Best Stocks Trends ➞  Best Stocks Today 12Stocks.com Best Nasdaq Stocks ➞ Best S&P 500 Stocks ➞ Best Tech Stocks ➞ Best Biotech Stocks ➞ |
| Detailed Overview of SmallCap Stocks |
| SmallCap Technical Overview, Leaders & Laggards, Top SmallCap ETF Funds & Detailed SmallCap Stocks List, Charts, Trends & More |
| Smallcap: Technical Analysis, Trends & YTD Performance | |
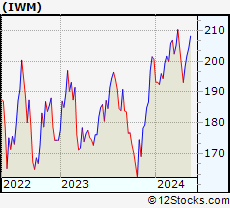
| SmallCap segment as represented by
IWM, an exchange-traded fund [ETF], holds basket of thousands of smallcap stocks from across all major sectors of the US stock market. The smallcap index (contains stocks like Riverbed & Sotheby's) is up by 0.22% and is currently underperforming the overall market by -6.27% year-to-date. Below is a quick view of technical charts and trends: | |
 IWM Weekly Chart |
|
| Long Term Trend: Deteriorating | |
| Medium Term Trend: Very Good | |
 IWM Daily Chart |
|
| Short Term Trend: Very Good | |
| Overall Trend Score: 82 | |
| YTD Performance: 0.22% | |
| **Trend Scores & Views Are Only For Educational Purposes And Not For Investing | |
| 12Stocks.com: Top Performing Small Cap Index Stocks | ||||||||||||||||||||||||||||||||||||||||||||||||
 The top performing Small Cap Index stocks year to date are
Now, more recently, over last week, the top performing Small Cap Index stocks on the move are


|
||||||||||||||||||||||||||||||||||||||||||||||||
| 12Stocks.com: Investing in Smallcap Index using Exchange Traded Funds | |
|
The following table shows list of key exchange traded funds (ETF) that
help investors track Smallcap index. The following list also includes leveraged ETF funds that track twice or thrice the daily returns of Smallcap indices. Short or inverse ETF funds move in the opposite direction to the index they track and are useful during market pullbacks or during bear markets. Quick View: Move mouse or cursor over ETF symbol (ticker) to view short-term technical chart and over ETF name to view long term chart. Click on ticker or stock name for detailed view. Click on to add stock symbol to your watchlist and to view watchlist. |
12Stocks.com List of ETFs that track Smallcap Index
| Ticker | ETF Name | Watchlist | Recent Price | Smart Investing & Trading Score | Change % | Week % | Year-to-date % |
| IWM | iShares Russell 2000 | | 201.15 | 82 | 0.61 | 1.39 | 0.22% |
| IJR | iShares Core S&P Small-Cap | | 106.83 | 50 | 0.47 | 1.12 | -1.31% |
| SDD | ProShares UltraShort SmallCap600 | | 18.35 | 56 | -4.97 | -5.17 | -0.42% |
| SBB | ProShares Short SmallCap600 | | 16.33 | 49 | -0.25 | -0.34 | 2.51% |
| SAA | ProShares Ultra SmallCap600 | | 23.93 | 49 | 4.36 | 3.88 | -4.07% |
| 12Stocks.com: Charts, Trends, Fundamental Data and Performances of SmallCap Stocks | |
|
We now take in-depth look at all SmallCap stocks including charts, multi-period performances and overall trends (as measured by Smart Investing & Trading Score). One can sort SmallCap stocks (click link to choose) by Daily, Weekly and by Year-to-Date performances. Also, one can sort by size of the company or by market capitalization. |
| Select Your Default Chart Type: | |||||
| |||||
| Click on stock symbol or name for detailed view. Click on to add stock symbol to your watchlist and to view watchlist. Quick View: Move mouse or cursor over "Daily" to quickly view daily technical stock chart and over "Weekly" to view weekly technical stock chart. | |||||

 | EBS Emergent BioSolutions Inc. |
| Sector: Health Care | |
| SubSector: Biotechnology | |
| MarketCap: 2417.65 Millions | |
| Recent Price: 3.88 Smart Investing & Trading Score: 100 | |
| Day Percent Change: 17.73% Day Change: 0.58 | |
| Week Change: 102.34% Year-to-date Change: 61.9% | |
| EBS Links: Profile News Message Board | |
| Charts:- Daily , Weekly | |
| Add EBS to Watchlist: View: Get Complete EBS Trend Analysis ➞ | |
 | DCPH Deciphera Pharmaceuticals, Inc. |
| Sector: Health Care | |
| SubSector: Biotechnology | |
| MarketCap: 2329.95 Millions | |
| Recent Price: 25.39 Smart Investing & Trading Score: 88 | |
| Day Percent Change: 0.02% Day Change: 0.01 | |
| Week Change: 73.28% Year-to-date Change: 57.4% | |
| DCPH Links: Profile News Message Board | |
| Charts:- Daily , Weekly | |
| Add DCPH to Watchlist: View: Get Complete DCPH Trend Analysis ➞ | |
 | ENVX Enovix Corporation |
| Sector: Industrials | |
| SubSector: Electrical Equipment & Parts | |
| MarketCap: 2740 Millions | |
| Recent Price: 9.82 Smart Investing & Trading Score: 100 | |
| Day Percent Change: 14.98% Day Change: 1.28 | |
| Week Change: 51.85% Year-to-date Change: -22.0% | |
| ENVX Links: Profile News Message Board | |
| Charts:- Daily , Weekly | |
| Add ENVX to Watchlist: View: Get Complete ENVX Trend Analysis ➞ | |
 | CVNA Carvana Co. |
| Sector: Services & Goods | |
| SubSector: Auto Dealerships | |
| MarketCap: 5585.31 Millions | |
| Recent Price: 117.35 Smart Investing & Trading Score: 100 | |
| Day Percent Change: 0.73% Day Change: 0.85 | |
| Week Change: 39.19% Year-to-date Change: 121.7% | |
| CVNA Links: Profile News Message Board | |
| Charts:- Daily , Weekly | |
| Add CVNA to Watchlist: View: Get Complete CVNA Trend Analysis ➞ | |
 | PSTX Poseida Therapeutics, Inc. |
| Sector: Health Care | |
| SubSector: Biotechnology | |
| MarketCap: 64487 Millions | |
| Recent Price: 2.87 Smart Investing & Trading Score: 64 | |
| Day Percent Change: 2.87% Day Change: 0.08 | |
| Week Change: 34.74% Year-to-date Change: -14.7% | |
| PSTX Links: Profile News Message Board | |
| Charts:- Daily , Weekly | |
| Add PSTX to Watchlist: View: Get Complete PSTX Trend Analysis ➞ | |
 | OPI Office Properties Income Trust |
| Sector: Financials | |
| SubSector: REIT - Office | |
| MarketCap: 1245.66 Millions | |
| Recent Price: 2.69 Smart Investing & Trading Score: 74 | |
| Day Percent Change: 5.08% Day Change: 0.13 | |
| Week Change: 33.83% Year-to-date Change: -63.3% | |
| OPI Links: Profile News Message Board | |
| Charts:- Daily , Weekly | |
| Add OPI to Watchlist: View: Get Complete OPI Trend Analysis ➞ | |
 | TREE LendingTree, Inc. |
| Sector: Financials | |
| SubSector: Mortgage Investment | |
| MarketCap: 2745.99 Millions | |
| Recent Price: 50.57 Smart Investing & Trading Score: 95 | |
| Day Percent Change: 2.51% Day Change: 1.24 | |
| Week Change: 33.43% Year-to-date Change: 66.8% | |
| TREE Links: Profile News Message Board | |
| Charts:- Daily , Weekly | |
| Add TREE to Watchlist: View: Get Complete TREE Trend Analysis ➞ | |
 | LUNG Pulmonx Corporation |
| Sector: Health Care | |
| SubSector: Medical Devices | |
| MarketCap: 18187 Millions | |
| Recent Price: 9.65 Smart Investing & Trading Score: 95 | |
| Day Percent Change: 2.88% Day Change: 0.27 | |
| Week Change: 32.55% Year-to-date Change: -24.3% | |
| LUNG Links: Profile News Message Board | |
| Charts:- Daily , Weekly | |
| Add LUNG to Watchlist: View: Get Complete LUNG Trend Analysis ➞ | |
 | VTYX Ventyx Biosciences, Inc. |
| Sector: Health Care | |
| SubSector: Biotechnology | |
| MarketCap: 1950 Millions | |
| Recent Price: 5.17 Smart Investing & Trading Score: 69 | |
| Day Percent Change: 6.16% Day Change: 0.30 | |
| Week Change: 31.22% Year-to-date Change: 108.9% | |
| VTYX Links: Profile News Message Board | |
| Charts:- Daily , Weekly | |
| Add VTYX to Watchlist: View: Get Complete VTYX Trend Analysis ➞ | |
 | TWOU 2U, Inc. |
| Sector: Technology | |
| SubSector: Application Software | |
| MarketCap: 1090.12 Millions | |
| Recent Price: 0.31 Smart Investing & Trading Score: 59 | |
| Day Percent Change: 15.94% Day Change: 0.04 | |
| Week Change: 29.55% Year-to-date Change: -74.7% | |
| TWOU Links: Profile News Message Board | |
| Charts:- Daily , Weekly | |
| Add TWOU to Watchlist: View: Get Complete TWOU Trend Analysis ➞ | |
 | OM Outset Medical, Inc. |
| Sector: Health Care | |
| SubSector: Medical Devices | |
| MarketCap: 21787 Millions | |
| Recent Price: 3.09 Smart Investing & Trading Score: 74 | |
| Day Percent Change: 3.00% Day Change: 0.09 | |
| Week Change: 28.75% Year-to-date Change: -42.9% | |
| OM Links: Profile News Message Board | |
| Charts:- Daily , Weekly | |
| Add OM to Watchlist: View: Get Complete OM Trend Analysis ➞ | |
 | NOVA Sunnova Energy International Inc. |
| Sector: Services & Goods | |
| SubSector: Management Services | |
| MarketCap: 1180.45 Millions | |
| Recent Price: 5.06 Smart Investing & Trading Score: 74 | |
| Day Percent Change: 14.48% Day Change: 0.64 | |
| Week Change: 26.5% Year-to-date Change: -66.8% | |
| NOVA Links: Profile News Message Board | |
| Charts:- Daily , Weekly | |
| Add NOVA to Watchlist: View: Get Complete NOVA Trend Analysis ➞ | |
 | PRME Prime Medicine, Inc. |
| Sector: Health Care | |
| SubSector: Biotechnology | |
| MarketCap: 1440 Millions | |
| Recent Price: 5.59 Smart Investing & Trading Score: 69 | |
| Day Percent Change: 7.71% Day Change: 0.40 | |
| Week Change: 26.19% Year-to-date Change: -38.7% | |
| PRME Links: Profile News Message Board | |
| Charts:- Daily , Weekly | |
| Add PRME to Watchlist: View: Get Complete PRME Trend Analysis ➞ | |
 | VIR Vir Biotechnology, Inc. |
| Sector: Health Care | |
| SubSector: Biotechnology | |
| MarketCap: 3916.75 Millions | |
| Recent Price: 10.38 Smart Investing & Trading Score: 74 | |
| Day Percent Change: 13.07% Day Change: 1.20 | |
| Week Change: 26.12% Year-to-date Change: 3.2% | |
| VIR Links: Profile News Message Board | |
| Charts:- Daily , Weekly | |
| Add VIR to Watchlist: View: Get Complete VIR Trend Analysis ➞ | |
 | TWST Twist Bioscience Corporation |
| Sector: Health Care | |
| SubSector: Medical Laboratories & Research | |
| MarketCap: 1065 Millions | |
| Recent Price: 39.43 Smart Investing & Trading Score: 52 | |
| Day Percent Change: 23.18% Day Change: 7.42 | |
| Week Change: 25.02% Year-to-date Change: 7.0% | |
| TWST Links: Profile News Message Board | |
| Charts:- Daily , Weekly | |
| Add TWST to Watchlist: View: Get Complete TWST Trend Analysis ➞ | |
 | ALHC Alignment Healthcare, Inc. |
| Sector: Health Care | |
| SubSector: Healthcare Plans | |
| MarketCap: 1100 Millions | |
| Recent Price: 6.50 Smart Investing & Trading Score: 100 | |
| Day Percent Change: 21.97% Day Change: 1.17 | |
| Week Change: 24.31% Year-to-date Change: -26.6% | |
| ALHC Links: Profile News Message Board | |
| Charts:- Daily , Weekly | |
| Add ALHC to Watchlist: View: Get Complete ALHC Trend Analysis ➞ | |
 | ATGE Adtalem Global Education Inc. |
| Sector: Services & Goods | |
| SubSector: Education & Training Services | |
| MarketCap: 1273.86 Millions | |
| Recent Price: 61.23 Smart Investing & Trading Score: 90 | |
| Day Percent Change: 16.86% Day Change: 8.84 | |
| Week Change: 23.26% Year-to-date Change: 3.9% | |
| ATGE Links: Profile News Message Board | |
| Charts:- Daily , Weekly | |
| Add ATGE to Watchlist: View: Get Complete ATGE Trend Analysis ➞ | |
 | HTLF Heartland Financial USA, Inc. |
| Sector: Financials | |
| SubSector: Regional - Southwest Banks | |
| MarketCap: 1143.85 Millions | |
| Recent Price: 43.77 Smart Investing & Trading Score: 100 | |
| Day Percent Change: 1.19% Day Change: 0.52 | |
| Week Change: 22.55% Year-to-date Change: 16.4% | |
| HTLF Links: Profile News Message Board | |
| Charts:- Daily , Weekly | |
| Add HTLF to Watchlist: View: Get Complete HTLF Trend Analysis ➞ | |
 | TGTX TG Therapeutics, Inc. |
| Sector: Health Care | |
| SubSector: Biotechnology | |
| MarketCap: 1022.85 Millions | |
| Recent Price: 16.49 Smart Investing & Trading Score: 74 | |
| Day Percent Change: 0.43% Day Change: 0.07 | |
| Week Change: 22.42% Year-to-date Change: -3.5% | |
| TGTX Links: Profile News Message Board | |
| Charts:- Daily , Weekly | |
| Add TGTX to Watchlist: View: Get Complete TGTX Trend Analysis ➞ | |
 | XNCR Xencor, Inc. |
| Sector: Health Care | |
| SubSector: Biotechnology | |
| MarketCap: 1744.35 Millions | |
| Recent Price: 24.46 Smart Investing & Trading Score: 100 | |
| Day Percent Change: 3.51% Day Change: 0.83 | |
| Week Change: 22.42% Year-to-date Change: 15.2% | |
| XNCR Links: Profile News Message Board | |
| Charts:- Daily , Weekly | |
| Add XNCR to Watchlist: View: Get Complete XNCR Trend Analysis ➞ | |
 | ORIC ORIC Pharmaceuticals, Inc. |
| Sector: Health Care | |
| SubSector: Biotechnology | |
| MarketCap: 12787 Millions | |
| Recent Price: 9.81 Smart Investing & Trading Score: 49 | |
| Day Percent Change: 3.05% Day Change: 0.29 | |
| Week Change: 21.56% Year-to-date Change: 6.4% | |
| ORIC Links: Profile News Message Board | |
| Charts:- Daily , Weekly | |
| Add ORIC to Watchlist: View: Get Complete ORIC Trend Analysis ➞ | |
 | PRCT PROCEPT BioRobotics Corporation |
| Sector: Health Care | |
| SubSector: Medical Devices | |
| MarketCap: 1600 Millions | |
| Recent Price: 62.71 Smart Investing & Trading Score: 100 | |
| Day Percent Change: 2.02% Day Change: 1.24 | |
| Week Change: 21.09% Year-to-date Change: 48.1% | |
| PRCT Links: Profile News Message Board | |
| Charts:- Daily , Weekly | |
| Add PRCT to Watchlist: View: Get Complete PRCT Trend Analysis ➞ | |
 | KOD Kodiak Sciences Inc. |
| Sector: Health Care | |
| SubSector: Biotechnology | |
| MarketCap: 2132.15 Millions | |
| Recent Price: 3.95 Smart Investing & Trading Score: 44 | |
| Day Percent Change: 6.76% Day Change: 0.25 | |
| Week Change: 20.43% Year-to-date Change: 29.9% | |
| KOD Links: Profile News Message Board | |
| Charts:- Daily , Weekly | |
| Add KOD to Watchlist: View: Get Complete KOD Trend Analysis ➞ | |
 | SLQT SelectQuote, Inc. |
| Sector: Financials | |
| SubSector: Insurance Brokers | |
| MarketCap: 38257 Millions | |
| Recent Price: 1.94 Smart Investing & Trading Score: 69 | |
| Day Percent Change: 7.50% Day Change: 0.14 | |
| Week Change: 20.19% Year-to-date Change: 41.2% | |
| SLQT Links: Profile News Message Board | |
| Charts:- Daily , Weekly | |
| Add SLQT to Watchlist: View: Get Complete SLQT Trend Analysis ➞ | |
 | LNZA LanzaTech Global, Inc. |
| Sector: Industrials | |
| SubSector: Waste Management | |
| MarketCap: 1340 Millions | |
| Recent Price: 2.67 Smart Investing & Trading Score: 42 | |
| Day Percent Change: 6.18% Day Change: 0.16 | |
| Week Change: 19.78% Year-to-date Change: -46.1% | |
| LNZA Links: Profile News Message Board | |
| Charts:- Daily , Weekly | |
| Add LNZA to Watchlist: View: Get Complete LNZA Trend Analysis ➞ | |
| For tabular summary view of above stock list: Summary View ➞ 0 - 25 , 25 - 50 , 50 - 75 , 75 - 100 , 100 - 125 , 125 - 150 , 150 - 175 , 175 - 200 , 200 - 225 , 225 - 250 , 250 - 275 , 275 - 300 , 300 - 325 , 325 - 350 , 350 - 375 , 375 - 400 , 400 - 425 , 425 - 450 , 450 - 475 , 475 - 500 , 500 - 525 , 525 - 550 , 550 - 575 , 575 - 600 , 600 - 625 , 625 - 650 , 650 - 675 , 675 - 700 | ||
| Click To Change The Sort Order: By Market Cap or Company Size Performance: Year-to-date, Week and Day | |
| Select Chart Type: | ||
| Too many stocks? View smallcap stocks filtered by marketcap & sector |
| Marketcap: All SmallCap Stocks (default-no microcap), Large, Mid-Range, Small & MicroCap |
| Sector: Tech, Finance, Energy, Staples, Retail, Industrial, Materials, Utilities & Medical |
|
Best Stocks Today 12Stocks.com |
© 2024 12Stocks.com Terms & Conditions Privacy Contact Us
All Information Provided Only For Education And Not To Be Used For Investing or Trading. See Terms & Conditions


One More Thing ... Get Best Stocks Delivered Daily!
Never Ever Miss A Move With Our Top Ten Stocks Lists
Find Best Stocks In Any Market - Bull or Bear Market
Take A Peek At Our Top Ten Stocks Lists: Daily, Weekly, Year-to-Date & Top Trends
Find Best Stocks In Any Market - Bull or Bear Market
Take A Peek At Our Top Ten Stocks Lists: Daily, Weekly, Year-to-Date & Top Trends
Smallcap Stocks With Best Up Trends [0-bearish to 100-bullish]: Origin Materials[100], Alignment Healthcare[100], Emergent BioSolutions[100], Enovix [100], Clearfield [100], Fluence Energy[100], TPI Composites[100], Janux [100], Conduent [100], Bloom Energy[100], E.W. Scripps[100]
Best Smallcap Stocks Year-to-Date:
Janux [482.74%], Viking [306.72%], Longboard [272.5%], Alpine Immune[239.34%], Bakkt [199.55%], Avidity Biosciences[195.24%], Vera [189.47%], Cullinan Oncology[176.9%], Super Micro[173.85%], Arcutis Bio[169.66%], Y-mAbs [154.69%] Best Smallcap Stocks This Week:
Emergent BioSolutions[102.34%], Deciphera [73.28%], Eyenovia [68.74%], Origin Materials[66.52%], Aspen Aerogels[54.66%], Enovix [51.85%], TPI Composites[41.91%], Codexis [41.73%], Cue Biopharma[41.39%], WideOpenWest [41.07%], Carvana Co[39.19%] Best Smallcap Stocks Daily:
WideOpenWest [29.16%], Ardelyx [28.65%], FTC Solar[25.09%], IES [23.96%], Twist Bioscience[23.18%], Origin Materials[22.23%], Alignment Healthcare[21.97%], Joint [18.43%], Emergent BioSolutions[17.73%], Butterfly [17.42%], Vaxxinity [17.27%]