
 Login Sign Up


| |||||
 |  | ||||

| 12Stocks.com Market Intelligence |
Best SmallCap Stocks
|
| In a hurry? Small Cap Stock Lists: Performance Trends Table, Stock Charts
Sort Small Cap stocks: Daily, Weekly, Year-to-Date, Market Cap & Trends. Filter Small Cap stocks list by sector: Show all, Tech, Finance, Energy, Staples, Retail, Industrial, Materials, Utilities and HealthCare Filter Small Cap stocks list by size: All Large Medium Small and MicroCap |
| 12Stocks.com Small Cap Stocks Performances & Trends Daily | |||||||||
|
|  The overall Smart Investing & Trading Score is 44 (0-bearish to 100-bullish) which puts Small Cap index in short term neutral trend. The Smart Investing & Trading Score from previous trading session is 86 and hence a deterioration of trend.
| ||||||||
Here are the Smart Investing & Trading Scores of the most requested small cap stocks at 12Stocks.com (click stock name for detailed review):
|


| 12Stocks.com: Investing in Smallcap Index with Stocks | |
|
The following table helps investors and traders sort through current performance and trends (as measured by Smart Investing & Trading Score) of various
stocks in the Smallcap Index. Quick View: Move mouse or cursor over stock symbol (ticker) to view short-term technical chart and over stock name to view long term chart. Click on  to add stock symbol to your watchlist and to add stock symbol to your watchlist and  to view watchlist. Click on any ticker or stock name for detailed market intelligence report for that stock. to view watchlist. Click on any ticker or stock name for detailed market intelligence report for that stock. |
12Stocks.com Performance of Stocks in Smallcap Index
| Ticker | Stock Name | Watchlist | Category | Recent Price | Smart Investing & Trading Score | Change % | YTD Change% |
| MLR | Miller Industries |   | Consumer Staples | 58.73 | 58 | -3.40% | 38.87% |
| FGEN | FibroGen | | Health Care | 1.23 | 52 | 2.50% | 38.78% |
| LMAT | LeMaitre Vascular | | Health Care | 78.55 | 51 | -0.42% | 38.39% |
| EGY | VAALCO Energy | | Energy | 6.21 | 5 | -2.66% | 38.31% |
| GEO | GEO Group | | Financials | 14.97 | 95 | 2.96% | 38.23% |
| KODK | Eastman Kodak | | Technology | 5.38 | 90 | 0.75% | 37.95% |
| CLFD | Clearfield | | Technology | 39.89 | 95 | 4.26% | 37.17% |
| AGS | PlayAGS | | Services & Goods | 11.54 | 63 | -0.09% | 36.89% |
| NGVC | Natural Grocers | | Services & Goods | 21.90 | 100 | 1.48% | 36.88% |
| SLCA | U.S. Silica | | Materials | 15.48 | 61 | -0.06% | 36.87% |
| PCT | PureCycle | | Industrials | 5.55 | 74 | 6.94% | 36.87% |
| WLFC | Willis Lease | | Transports | 66.89 | 88 | 3.03% | 36.85% |
| ABUS | Arbutus Biopharma | | Health Care | 3.42 | 90 | 1.79% | 36.80% |
| KIND | Nextdoor | | Services & Goods | 2.53 | 88 | 4.55% | 36.76% |
| DAKT | Daktronics | | Technology | 11.57 | 95 | 3.67% | 36.44% |
| ELF | e.l.f. Beauty | | Consumer Staples | 196.45 | 77 | 5.10% | 36.10% |
| TK | Teekay | | Transports | 9.73 | 64 | -0.61% | 36.08% |
| CVLT | Commvault Systems | | Technology | 108.48 | 31 | 0.83% | 35.85% |
| PTCT | PTC | | Health Care | 37.43 | 95 | 2.94% | 35.81% |
| SIGA | SIGA | | Health Care | 7.58 | 57 | 1.34% | 35.36% |
| UCTT | Ultra Clean | | Technology | 46.20 | 65 | -0.39% | 35.33% |
| LXFR | Luxfer | | Industrials | 12.08 | 66 | -1.95% | 35.12% |
| WIRE | Encore Wire | | Technology | 288.55 | 78 | -0.06% | 35.09% |
| BTMD | biote | | Health Care | 6.70 | 74 | 0.60% | 35.08% |
| GNK | Genco Shipping | | Transports | 22.40 | 63 | -0.53% | 35.02% |


| Too many stocks? View smallcap stocks filtered by marketcap & sector |
| Marketcap: All SmallCap Stocks (default-no microcap), Large, Mid-Range, Small |
| Smallcap Sector: Tech, Finance, Energy, Staples, Retail, Industrial, Materials, & Medical |
|
Get the most comprehensive stock market coverage daily at 12Stocks.com ➞ Best Stocks Today ➞ Best Stocks Weekly ➞ Best Stocks Year-to-Date ➞ Best Stocks Trends ➞  Best Stocks Today 12Stocks.com Best Nasdaq Stocks ➞ Best S&P 500 Stocks ➞ Best Tech Stocks ➞ Best Biotech Stocks ➞ |
| Detailed Overview of SmallCap Stocks |
| SmallCap Technical Overview, Leaders & Laggards, Top SmallCap ETF Funds & Detailed SmallCap Stocks List, Charts, Trends & More |
| Smallcap: Technical Analysis, Trends & YTD Performance | |
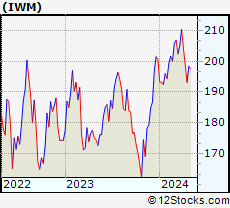
| SmallCap segment as represented by
IWM, an exchange-traded fund [ETF], holds basket of thousands of smallcap stocks from across all major sectors of the US stock market. The smallcap index (contains stocks like Riverbed & Sotheby's) is up by 1.94% and is currently underperforming the overall market by -7.88% year-to-date. Below is a quick view of technical charts and trends: | |
 IWM Weekly Chart |
|
| Long Term Trend: Not Good | |
| Medium Term Trend: Not Good | |
 IWM Daily Chart |
|
| Short Term Trend: Good | |
| Overall Trend Score: 44 | |
| YTD Performance: 1.94% | |
| **Trend Scores & Views Are Only For Educational Purposes And Not For Investing | |
| 12Stocks.com: Top Performing Small Cap Index Stocks | ||||||||||||||||||||||||||||||||||||||||||||||||
 The top performing Small Cap Index stocks year to date are
Now, more recently, over last week, the top performing Small Cap Index stocks on the move are


|
||||||||||||||||||||||||||||||||||||||||||||||||
| 12Stocks.com: Investing in Smallcap Index using Exchange Traded Funds | |
|
The following table shows list of key exchange traded funds (ETF) that
help investors track Smallcap index. The following list also includes leveraged ETF funds that track twice or thrice the daily returns of Smallcap indices. Short or inverse ETF funds move in the opposite direction to the index they track and are useful during market pullbacks or during bear markets. Quick View: Move mouse or cursor over ETF symbol (ticker) to view short-term technical chart and over ETF name to view long term chart. Click on ticker or stock name for detailed view. Click on to add stock symbol to your watchlist and to view watchlist. |
12Stocks.com List of ETFs that track Smallcap Index
| Ticker | ETF Name | Watchlist | Recent Price | Smart Investing & Trading Score | Change % | Week % | Year-to-date % |
| IWM | iShares Russell 2000 | | 204.61 | 44 | -0.56 | -0.56 | 1.94% |
| VTWO | Vanguard Russell 2000 ETF | | 82.66 | 39 | 0.16 | 0.16 | 1.92% |
| IJR | iShares Core S&P Small-Cap | | 109.26 | 39 | -0.36 | -0.36 | 0.93% |
| IWN | iShares Russell 2000 Value | | 154.99 | 44 | -0.57 | -0.57 | -0.22% |
| IWO | iShares Russell 2000 Growth | | 262.77 | 20 | -0.32 | -0.32 | 4.18% |
| IJS | iShares S&P Small-Cap 600 Value | | 100.24 | 54 | 0.50 | 0.5 | -2.75% |
| IJT | iShares S&P Small-Cap 600 Growth | | 130.54 | 65 | 0.26 | 0.26 | 4.32% |
| XSLV | PowerShares S&P SmallCap Low Volatil ETF | | 43.86 | 49 | 0.46 | 0.46 | -0.66% |
| SDD | ProShares UltraShort SmallCap600 | | 18.25 | 56 | 0.77 | 0.77 | -0.96% |
| SAA | ProShares Ultra SmallCap600 | | 24.36 | 54 | 0.83 | 0.83 | -2.36% |
| SMLV | SPDR SSGA US Small Cap Low Volatil ETF | | 109.28 | 37 | -0.70 | -0.7 | -2.88% |
| SBB | ProShares Short SmallCap600 | | 16.04 | 66 | 0.44 | 0.44 | 0.69% |
| 12Stocks.com: Charts, Trends, Fundamental Data and Performances of SmallCap Stocks | |
|
We now take in-depth look at all SmallCap stocks including charts, multi-period performances and overall trends (as measured by Smart Investing & Trading Score). One can sort SmallCap stocks (click link to choose) by Daily, Weekly and by Year-to-Date performances. Also, one can sort by size of the company or by market capitalization. |
| Select Your Default Chart Type: | |||||
| |||||
| Click on stock symbol or name for detailed view. Click on to add stock symbol to your watchlist and to view watchlist. Quick View: Move mouse or cursor over "Daily" to quickly view daily technical stock chart and over "Weekly" to view weekly technical stock chart. | |||||

 | MLR Miller Industries, Inc. |
| Sector: Consumer Staples | |
| SubSector: Auto Parts | |
| MarketCap: 335.239 Millions | |
| Recent Price: 58.73 Smart Investing & Trading Score: 58 | |
| Day Percent Change: -3.40% Day Change: -2.07 | |
| Week Change: -3.4% Year-to-date Change: 38.9% | |
| MLR Links: Profile News Message Board | |
| Charts:- Daily , Weekly | |
| Add MLR to Watchlist: View: Get Complete MLR Trend Analysis ➞ | |
 | FGEN FibroGen, Inc. |
| Sector: Health Care | |
| SubSector: Biotechnology | |
| MarketCap: 2502.95 Millions | |
| Recent Price: 1.23 Smart Investing & Trading Score: 52 | |
| Day Percent Change: 2.50% Day Change: 0.03 | |
| Week Change: 2.5% Year-to-date Change: 38.8% | |
| FGEN Links: Profile News Message Board | |
| Charts:- Daily , Weekly | |
| Add FGEN to Watchlist: View: Get Complete FGEN Trend Analysis ➞ | |
 | LMAT LeMaitre Vascular, Inc. |
| Sector: Health Care | |
| SubSector: Medical Instruments & Supplies | |
| MarketCap: 522.16 Millions | |
| Recent Price: 78.55 Smart Investing & Trading Score: 51 | |
| Day Percent Change: -0.42% Day Change: -0.33 | |
| Week Change: -0.42% Year-to-date Change: 38.4% | |
| LMAT Links: Profile News Message Board | |
| Charts:- Daily , Weekly | |
| Add LMAT to Watchlist: View: Get Complete LMAT Trend Analysis ➞ | |
 | EGY VAALCO Energy, Inc. |
| Sector: Energy | |
| SubSector: Independent Oil & Gas | |
| MarketCap: 59.5593 Millions | |
| Recent Price: 6.21 Smart Investing & Trading Score: 5 | |
| Day Percent Change: -2.66% Day Change: -0.17 | |
| Week Change: -2.66% Year-to-date Change: 38.3% | |
| EGY Links: Profile News Message Board | |
| Charts:- Daily , Weekly | |
| Add EGY to Watchlist: View: Get Complete EGY Trend Analysis ➞ | |
 | GEO The GEO Group, Inc. |
| Sector: Financials | |
| SubSector: REIT - Healthcare Facilities | |
| MarketCap: 1678.34 Millions | |
| Recent Price: 14.97 Smart Investing & Trading Score: 95 | |
| Day Percent Change: 2.96% Day Change: 0.43 | |
| Week Change: 2.96% Year-to-date Change: 38.2% | |
| GEO Links: Profile News Message Board | |
| Charts:- Daily , Weekly | |
| Add GEO to Watchlist: View: Get Complete GEO Trend Analysis ➞ | |
 | KODK Eastman Kodak Company |
| Sector: Technology | |
| SubSector: Electronic Equipment | |
| MarketCap: 78.47 Millions | |
| Recent Price: 5.38 Smart Investing & Trading Score: 90 | |
| Day Percent Change: 0.75% Day Change: 0.04 | |
| Week Change: 0.75% Year-to-date Change: 38.0% | |
| KODK Links: Profile News Message Board | |
| Charts:- Daily , Weekly | |
| Add KODK to Watchlist: View: Get Complete KODK Trend Analysis ➞ | |
 | CLFD Clearfield, Inc. |
| Sector: Technology | |
| SubSector: Communication Equipment | |
| MarketCap: 138.439 Millions | |
| Recent Price: 39.89 Smart Investing & Trading Score: 95 | |
| Day Percent Change: 4.26% Day Change: 1.63 | |
| Week Change: 4.26% Year-to-date Change: 37.2% | |
| CLFD Links: Profile News Message Board | |
| Charts:- Daily , Weekly | |
| Add CLFD to Watchlist: View: Get Complete CLFD Trend Analysis ➞ | |
 | AGS PlayAGS, Inc. |
| Sector: Services & Goods | |
| SubSector: Gaming Activities | |
| MarketCap: 77.1289 Millions | |
| Recent Price: 11.54 Smart Investing & Trading Score: 63 | |
| Day Percent Change: -0.09% Day Change: -0.01 | |
| Week Change: -0.09% Year-to-date Change: 36.9% | |
| AGS Links: Profile News Message Board | |
| Charts:- Daily , Weekly | |
| Add AGS to Watchlist: View: Get Complete AGS Trend Analysis ➞ | |
 | NGVC Natural Grocers by Vitamin Cottage, Inc. |
| Sector: Services & Goods | |
| SubSector: Grocery Stores | |
| MarketCap: 185.475 Millions | |
| Recent Price: 21.90 Smart Investing & Trading Score: 100 | |
| Day Percent Change: 1.48% Day Change: 0.32 | |
| Week Change: 1.48% Year-to-date Change: 36.9% | |
| NGVC Links: Profile News Message Board | |
| Charts:- Daily , Weekly | |
| Add NGVC to Watchlist: View: Get Complete NGVC Trend Analysis ➞ | |
 | SLCA U.S. Silica Holdings, Inc. |
| Sector: Materials | |
| SubSector: Industrial Metals & Minerals | |
| MarketCap: 93 Millions | |
| Recent Price: 15.48 Smart Investing & Trading Score: 61 | |
| Day Percent Change: -0.06% Day Change: -0.01 | |
| Week Change: -0.06% Year-to-date Change: 36.9% | |
| SLCA Links: Profile News Message Board | |
| Charts:- Daily , Weekly | |
| Add SLCA to Watchlist: View: Get Complete SLCA Trend Analysis ➞ | |
 | PCT PureCycle Technologies, Inc. |
| Sector: Industrials | |
| SubSector: Pollution & Treatment Controls | |
| MarketCap: 1610 Millions | |
| Recent Price: 5.55 Smart Investing & Trading Score: 74 | |
| Day Percent Change: 6.94% Day Change: 0.36 | |
| Week Change: 6.94% Year-to-date Change: 36.9% | |
| PCT Links: Profile News Message Board | |
| Charts:- Daily , Weekly | |
| Add PCT to Watchlist: View: Get Complete PCT Trend Analysis ➞ | |
 | WLFC Willis Lease Finance Corporation |
| Sector: Transports | |
| SubSector: Rental & Leasing Services | |
| MarketCap: 122.044 Millions | |
| Recent Price: 66.89 Smart Investing & Trading Score: 88 | |
| Day Percent Change: 3.03% Day Change: 1.97 | |
| Week Change: 3.03% Year-to-date Change: 36.9% | |
| WLFC Links: Profile News Message Board | |
| Charts:- Daily , Weekly | |
| Add WLFC to Watchlist: View: Get Complete WLFC Trend Analysis ➞ | |
 | ABUS Arbutus Biopharma Corporation |
| Sector: Health Care | |
| SubSector: Biotechnology | |
| MarketCap: 110.885 Millions | |
| Recent Price: 3.42 Smart Investing & Trading Score: 90 | |
| Day Percent Change: 1.79% Day Change: 0.06 | |
| Week Change: 1.79% Year-to-date Change: 36.8% | |
| ABUS Links: Profile News Message Board | |
| Charts:- Daily , Weekly | |
| Add ABUS to Watchlist: View: Get Complete ABUS Trend Analysis ➞ | |
 | KIND Nextdoor Holdings, Inc. |
| Sector: Services & Goods | |
| SubSector: Internet Content & Information | |
| MarketCap: 1170 Millions | |
| Recent Price: 2.53 Smart Investing & Trading Score: 88 | |
| Day Percent Change: 4.55% Day Change: 0.11 | |
| Week Change: 4.55% Year-to-date Change: 36.8% | |
| KIND Links: Profile News Message Board | |
| Charts:- Daily , Weekly | |
| Add KIND to Watchlist: View: Get Complete KIND Trend Analysis ➞ | |
 | DAKT Daktronics, Inc. |
| Sector: Technology | |
| SubSector: Computer Based Systems | |
| MarketCap: 223.539 Millions | |
| Recent Price: 11.57 Smart Investing & Trading Score: 95 | |
| Day Percent Change: 3.67% Day Change: 0.41 | |
| Week Change: 3.67% Year-to-date Change: 36.4% | |
| DAKT Links: Profile News Message Board | |
| Charts:- Daily , Weekly | |
| Add DAKT to Watchlist: View: Get Complete DAKT Trend Analysis ➞ | |
 | ELF e.l.f. Beauty, Inc. |
| Sector: Consumer Staples | |
| SubSector: Personal Products | |
| MarketCap: 497.985 Millions | |
| Recent Price: 196.45 Smart Investing & Trading Score: 77 | |
| Day Percent Change: 5.10% Day Change: 9.54 | |
| Week Change: 5.1% Year-to-date Change: 36.1% | |
| ELF Links: Profile News Message Board | |
| Charts:- Daily , Weekly | |
| Add ELF to Watchlist: View: Get Complete ELF Trend Analysis ➞ | |
 | TK Teekay Corporation |
| Sector: Transports | |
| SubSector: Shipping | |
| MarketCap: 257.914 Millions | |
| Recent Price: 9.73 Smart Investing & Trading Score: 64 | |
| Day Percent Change: -0.61% Day Change: -0.06 | |
| Week Change: -0.61% Year-to-date Change: 36.1% | |
| TK Links: Profile News Message Board | |
| Charts:- Daily , Weekly | |
| Add TK to Watchlist: View: Get Complete TK Trend Analysis ➞ | |
 | CVLT Commvault Systems, Inc. |
| Sector: Technology | |
| SubSector: Application Software | |
| MarketCap: 1607.22 Millions | |
| Recent Price: 108.48 Smart Investing & Trading Score: 31 | |
| Day Percent Change: 0.83% Day Change: 0.90 | |
| Week Change: 0.83% Year-to-date Change: 35.9% | |
| CVLT Links: Profile News Message Board | |
| Charts:- Daily , Weekly | |
| Add CVLT to Watchlist: View: Get Complete CVLT Trend Analysis ➞ | |
 | PTCT PTC Therapeutics, Inc. |
| Sector: Health Care | |
| SubSector: Biotechnology | |
| MarketCap: 2795.85 Millions | |
| Recent Price: 37.43 Smart Investing & Trading Score: 95 | |
| Day Percent Change: 2.94% Day Change: 1.07 | |
| Week Change: 2.94% Year-to-date Change: 35.8% | |
| PTCT Links: Profile News Message Board | |
| Charts:- Daily , Weekly | |
| Add PTCT to Watchlist: View: Get Complete PTCT Trend Analysis ➞ | |
 | SIGA SIGA Technologies, Inc. |
| Sector: Health Care | |
| SubSector: Biotechnology | |
| MarketCap: 424.285 Millions | |
| Recent Price: 7.58 Smart Investing & Trading Score: 57 | |
| Day Percent Change: 1.34% Day Change: 0.10 | |
| Week Change: 1.34% Year-to-date Change: 35.4% | |
| SIGA Links: Profile News Message Board | |
| Charts:- Daily , Weekly | |
| Add SIGA to Watchlist: View: Get Complete SIGA Trend Analysis ➞ | |
 | UCTT Ultra Clean Holdings, Inc. |
| Sector: Technology | |
| SubSector: Semiconductor Equipment & Materials | |
| MarketCap: 528.518 Millions | |
| Recent Price: 46.20 Smart Investing & Trading Score: 65 | |
| Day Percent Change: -0.39% Day Change: -0.18 | |
| Week Change: -0.39% Year-to-date Change: 35.3% | |
| UCTT Links: Profile News Message Board | |
| Charts:- Daily , Weekly | |
| Add UCTT to Watchlist: View: Get Complete UCTT Trend Analysis ➞ | |
 | LXFR Luxfer Holdings PLC |
| Sector: Industrials | |
| SubSector: Diversified Machinery | |
| MarketCap: 406.716 Millions | |
| Recent Price: 12.08 Smart Investing & Trading Score: 66 | |
| Day Percent Change: -1.95% Day Change: -0.24 | |
| Week Change: -1.95% Year-to-date Change: 35.1% | |
| LXFR Links: Profile News Message Board | |
| Charts:- Daily , Weekly | |
| Add LXFR to Watchlist: View: Get Complete LXFR Trend Analysis ➞ | |
 | WIRE Encore Wire Corporation |
| Sector: Technology | |
| SubSector: Diversified Electronics | |
| MarketCap: 898.896 Millions | |
| Recent Price: 288.55 Smart Investing & Trading Score: 78 | |
| Day Percent Change: -0.06% Day Change: -0.18 | |
| Week Change: -0.06% Year-to-date Change: 35.1% | |
| WIRE Links: Profile News Message Board | |
| Charts:- Daily , Weekly | |
| Add WIRE to Watchlist: View: Get Complete WIRE Trend Analysis ➞ | |
 | BTMD biote Corp. |
| Sector: Health Care | |
| SubSector: Medical Care Facilities | |
| MarketCap: 468 Millions | |
| Recent Price: 6.70 Smart Investing & Trading Score: 74 | |
| Day Percent Change: 0.60% Day Change: 0.04 | |
| Week Change: 0.6% Year-to-date Change: 35.1% | |
| BTMD Links: Profile News Message Board | |
| Charts:- Daily , Weekly | |
| Add BTMD to Watchlist: View: Get Complete BTMD Trend Analysis ➞ | |
 | GNK Genco Shipping & Trading Limited |
| Sector: Transports | |
| SubSector: Shipping | |
| MarketCap: 251.614 Millions | |
| Recent Price: 22.40 Smart Investing & Trading Score: 63 | |
| Day Percent Change: -0.53% Day Change: -0.12 | |
| Week Change: -0.53% Year-to-date Change: 35.0% | |
| GNK Links: Profile News Message Board | |
| Charts:- Daily , Weekly | |
| Add GNK to Watchlist: View: Get Complete GNK Trend Analysis ➞ | |
| Too many stocks? View smallcap stocks filtered by marketcap & sector |
| Marketcap: All SmallCap Stocks (default-no microcap), Large, Mid-Range, Small & MicroCap |
| Sector: Tech, Finance, Energy, Staples, Retail, Industrial, Materials, Utilities & Medical |
|
Best Stocks Today 12Stocks.com |
© 2024 12Stocks.com Terms & Conditions Privacy Contact Us
All Information Provided Only For Education And Not To Be Used For Investing or Trading. See Terms & Conditions


One More Thing ... Get Best Stocks Delivered Daily!
Never Ever Miss A Move With Our Top Ten Stocks Lists
Find Best Stocks In Any Market - Bull or Bear Market
Take A Peek At Our Top Ten Stocks Lists: Daily, Weekly, Year-to-Date & Top Trends
Find Best Stocks In Any Market - Bull or Bear Market
Take A Peek At Our Top Ten Stocks Lists: Daily, Weekly, Year-to-Date & Top Trends
Smallcap Stocks With Best Up Trends [0-bearish to 100-bullish]: MarineMax [100], Novavax [100], Omeros [100], Agios [100], Pulse Biosciences[100], Innodata [100], Telephone and[100], Sportsman s[100], Sleep Number[100], Safe Bulkers[100], Sight Sciences[100]
Best Smallcap Stocks Year-to-Date:
CareMax [450.52%], Janux [411.68%], Novavax [279.58%], Summit [238.7%], Viking [234.61%], Longboard [209.82%], Avidity Biosciences[197.68%], Stoke [194.87%], Vital Farms[174.59%], Sweetgreen [172.74%], Super Micro[171.09%] Best Smallcap Stocks This Week:
MarineMax [27%], Olema [21.49%], Novavax [21.22%], Omeros [20.83%], Agios [20.61%], Pulse Biosciences[17.66%], Liquidia [14.22%], Innodata [14.18%], Telephone and[13.27%], FuelCell Energy[11.91%], Zevia PBC[11.38%] Best Smallcap Stocks Daily:
MarineMax [27.00%], Olema [21.49%], Novavax [21.22%], Omeros [20.83%], Agios [20.61%], Pulse Biosciences[17.66%], Liquidia [14.22%], Innodata [14.18%], Telephone and[13.27%], FuelCell Energy[11.91%], Zevia PBC[11.38%]