
 Login Sign Up


| |||||
 |  | ||||

| 12Stocks.com Market Intelligence |
Best S&P 500 Stocks
|
On this page, you will find the most comprehensive analysis of S&P 500 stocks and ETFs - from latest trends to performances to charts ➞. First, here are the year-to-date (YTD) performances of the most requested S&P 500 stocks at 12Stocks.com (click stock for review):
| NVIDIA 77% | ||
| Merck 19% | ||
| Amazon.com 19% | ||
| Google 19% | ||
| Caterpillar 18% | ||
| Walmart 15% | ||
| JPMorgan Chase 14% | ||
| Goldman Sachs 12% | ||
| Chevron 12% | ||
| Microsoft 7% | ||
| Johnson & Johnson -6% | ||
| McDonald s -8% | ||
| Starbucks -8% | ||
| Apple -10% | ||
| Gilead -19% | ||
| Boeing -33% | ||
| Intel -38% | ||
| Quick: S&P 500 Stocks Lists: Performances & Trends, S&P 500 Stock Charts
Sort S&P 500 stocks: Daily, Weekly, Year-to-Date, Market Cap & Trends. Filter S&P 500 stocks list by sector: Show all, Tech, Finance, Energy, Staples, Retail, Industrial, Materials, Utilities and HealthCare |
| 12Stocks.com S&P 500 Stocks Performances & Trends Daily Report | |||||||||
|
| 
The overall Smart Investing & Trading Score is 78 (0-bearish to 100-bullish) which puts S&P 500 index in short term neutral to bullish trend. The Smart Investing & Trading Score from previous trading session is 63 and hence an improvement of trend. | ||||||||
Here are the Smart Investing & Trading Scores of the most requested S&P 500 stocks at 12Stocks.com (click stock name for detailed review):
|


| 12Stocks.com: Top Performing S&P 500 Index Stocks | ||||||||||||||||||||||||||||||||||||||||||||||||
 The top performing S&P 500 Index stocks year to date are
Now, more recently, over last week, the top performing S&P 500 Index stocks on the move are


|
||||||||||||||||||||||||||||||||||||||||||||||||
| 12Stocks.com: Investing in S&P 500 Index with Stocks | |
|
The following table helps investors and traders sort through current performance and trends (as measured by Smart Investing & Trading Score) of various
stocks in the S&P 500 Index. Quick View: Move mouse or cursor over stock symbol (ticker) to view short-term technical chart and over stock name to view long term chart. Click on  to add stock symbol to your watchlist and to add stock symbol to your watchlist and  to view watchlist. Click on any ticker or stock name for detailed market intelligence report for that stock. to view watchlist. Click on any ticker or stock name for detailed market intelligence report for that stock. |
12Stocks.com Performance of Stocks in S&P 500 Index
| Ticker | Stock Name | Watchlist | Category | Recent Price | Smart Investing & Trading Score | Change % | Weekly Change% |
| VFC | V.F |   | Consumer Staples | 12.89 | 57 | 1.98% | 1.98% |
| ZBH | Zimmer Biomet | | Health Care | 121.71 | 30 | 1.98% | 1.98% |
| RCL | Royal Caribbean | | Services & Goods | 143.36 | 95 | 1.97% | 1.97% |
| DE | Deere & | | Industrials | 400.96 | 83 | 1.94% | 1.94% |
| AMT | American Tower | | Financials | 174.99 | 42 | 1.92% | 1.92% |
| PPL | PPL | | Utilities | 27.53 | 93 | 1.89% | 1.89% |
| CAT | Caterpillar | | Industrials | 349.80 | 53 | 1.87% | 1.87% |
| EMN | Eastman Chemical | | Materials | 97.34 | 83 | 1.86% | 1.86% |
| HIG | Hartford Financial | | Financials | 97.07 | 49 | 1.86% | 1.86% |
| CCI | Crown Castle | | Technology | 95.32 | 28 | 1.86% | 1.86% |
| TEL | TE Connectivity | | Technology | 142.82 | 68 | 1.86% | 1.86% |
| UHS | Universal Health | | Health Care | 169.12 | 95 | 1.84% | 1.84% |
| NXPI | NXP Semiconductors | | Technology | 247.13 | 100 | 1.83% | 1.83% |
| MET | MetLife | | Financials | 71.70 | 75 | 1.82% | 1.82% |
| WBA | Walgreens Boots | | Services & Goods | 18.02 | 59 | 1.81% | 1.81% |
| AZO | AutoZone | | Services & Goods | 2998.78 | 66 | 1.79% | 1.79% |
| AMD | Advanced Micro | | Technology | 160.20 | 49 | 1.78% | 1.78% |
| QRVO | Qorvo | | Technology | 118.83 | 100 | 1.78% | 1.78% |
| PXD | Pioneer Natural | | Energy | 273.60 | 83 | 1.76% | 1.76% |
| HST | Host Hotels | | Financials | 19.19 | 37 | 1.75% | 1.75% |
| SPG | Simon Property | | Financials | 144.83 | 75 | 1.74% | 1.74% |
| MDLZ | Mondelez | | Consumer Staples | 71.83 | 57 | 1.73% | 1.73% |
| ENPH | Enphase | | Technology | 113.86 | 68 | 1.72% | 1.72% |
| FE | First | | Utilities | 38.78 | 100 | 1.70% | 1.70% |
| INCY | Incyte | | Health Care | 52.56 | 49 | 1.70% | 1.70% |
| For chart view version of above stock list: Chart View ➞ 0 - 25 , 25 - 50 , 50 - 75 , 75 - 100 , 100 - 125 , 125 - 150 , 150 - 175 , 175 - 200 , 200 - 225 , 225 - 250 , 250 - 275 , 275 - 300 , 300 - 325 , 325 - 350 , 350 - 375 , 375 - 400 , 400 - 425 , 425 - 450 , 450 - 475 , 475 - 500 | ||
 | Click To Change The Sort Order: By Market Cap or Company Size Performance: Year-to-date, Week and Day |  |
|
Get the most comprehensive stock market coverage daily at 12Stocks.com ➞ Best Stocks Today ➞ Best Stocks Weekly ➞ Best Stocks Year-to-Date ➞ Best Stocks Trends ➞  Best Stocks Today 12Stocks.com Best Nasdaq Stocks ➞ Best S&P 500 Stocks ➞ Best Tech Stocks ➞ Best Biotech Stocks ➞ |
| Detailed Overview of S&P 500 Stocks |
| S&P 500 Technical Overview, Leaders & Laggards, Top S&P 500 ETF Funds & Detailed S&P 500 Stocks List, Charts, Trends & More |
| S&P 500: Technical Analysis, Trends & YTD Performance | |
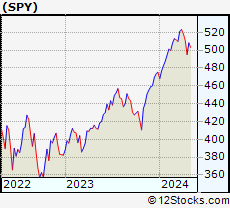
| S&P 500 index as represented by
SPY, an exchange-traded fund [ETF], holds basket of five hundred (mostly largecap) stocks from across all major sectors of the US stock market. The S&P 500 index (contains stocks like Apple and Exxon) is up by 7.31% and is currently outperforming the overall market by 0.75% year-to-date. Below is a quick view of technical charts and trends: | |
 SPY Weekly Chart |
|
| Long Term Trend: Good | |
| Medium Term Trend: Not Good | |
 SPY Daily Chart |
|
| Short Term Trend: Very Good | |
| Overall Trend Score: 78 | |
| YTD Performance: 7.31% | |
| **Trend Scores & Views Are Only For Educational Purposes And Not For Investing | |
| 12Stocks.com: Investing in S&P 500 Index using Exchange Traded Funds | |
|
The following table shows list of key exchange traded funds (ETF) that
help investors track S&P 500 index. The following list also includes leveraged ETF funds that track twice or thrice the daily returns of S&P 500 indices. Short or inverse ETF funds move in the opposite direction to the index they track and are useful during market pullbacks or during bear markets. Quick View: Move mouse or cursor over ETF symbol (ticker) to view short-term technical chart and over ETF name to view long term chart. Click on ticker or stock name for detailed view. Click on to add stock symbol to your watchlist and to view watchlist. |
12Stocks.com List of ETFs that track S&P 500 Index
| Ticker | ETF Name | Watchlist | Recent Price | Smart Investing & Trading Score | Change % | Week % | Year-to-date % |
| SPY | SPDR S&P 500 ETF | | 510.06 | 78 | 0.35 | 0.35 | 7.31% |
| IVV | iShares Core S&P 500 ETF | | 512.59 | 78 | 0.36 | 0.36 | 7.32% |
| VOO | Vanguard 500 ETF | | 468.84 | 78 | 0.35 | 0.35 | 7.34% |
| OEF | iShares S&P 100 | | 242.09 | 78 | 0.22 | 0.22 | 8.37% |
| SSO | ProShares Ultra S&P500 | | 73.19 | 78 | 0.66 | 0.66 | 12.48% |
| UPRO | ProShares UltraPro S&P500 | | 64.44 | 70 | 0.97 | 0.97 | 17.72% |
| SPXL | Direxion Daily S&P500 Bull 3X ETF | | 122.36 | 70 | 1.01 | 1.01 | 17.67% |
| SH | ProShares Short S&P500 | | 12.25 | 35 | -0.24 | -0.24 | -5.7% |
| SDS | ProShares UltraShort S&P500 | | 26.36 | 23 | -0.64 | -0.64 | -11.9% |
| SPXU | ProShares UltraPro Short S&P500 | | 35.17 | 35 | -0.93 | -0.93 | -18.21% |
| SPXS | Direxion Daily S&P 500 Bear 3X ETF | | 9.52 | 25 | -0.94 | -0.94 | -17.58% |
| 12Stocks.com: Charts, Trends, Fundamental Data and Performances of S&P 500 Stocks | |
|
We now take in-depth look at all S&P 500 stocks including charts, multi-period performances and overall trends (as measured by Smart Investing & Trading Score). One can sort S&P 500 stocks (click link to choose) by Daily, Weekly and by Year-to-Date performances. Also, one can sort by size of the company or by market capitalization. |
| Select Your Default Chart Type: | |||||
| |||||
| Click on stock symbol or name for detailed view. Click on to add stock symbol to your watchlist and to view watchlist. Quick View: Move mouse or cursor over "Daily" to quickly view daily technical stock chart and over "Weekly" to view weekly technical stock chart. | |||||

 | VFC V.F. Corporation |
| Sector: Consumer Staples | |
| SubSector: Textile - Apparel Clothing | |
| MarketCap: 23607.5 Millions | |
| Recent Price: 12.89 Smart Investing & Trading Score: 57 | |
| Day Percent Change: 1.98% Day Change: 0.25 | |
| Week Change: 1.98% Year-to-date Change: -31.4% | |
| VFC Links: Profile News Message Board | |
| Charts:- Daily , Weekly | |
| Add VFC to Watchlist: View: Get VFC Trend Analysis ➞ | |
 | ZBH Zimmer Biomet Holdings, Inc. |
| Sector: Health Care | |
| SubSector: Medical Appliances & Equipment | |
| MarketCap: 19339.4 Millions | |
| Recent Price: 121.71 Smart Investing & Trading Score: 30 | |
| Day Percent Change: 1.98% Day Change: 2.36 | |
| Week Change: 1.98% Year-to-date Change: 0.0% | |
| ZBH Links: Profile News Message Board | |
| Charts:- Daily , Weekly | |
| Add ZBH to Watchlist: View: Get ZBH Trend Analysis ➞ | |
 | RCL Royal Caribbean Cruises Ltd. |
| Sector: Services & Goods | |
| SubSector: Resorts & Casinos | |
| MarketCap: 7294.14 Millions | |
| Recent Price: 143.36 Smart Investing & Trading Score: 95 | |
| Day Percent Change: 1.97% Day Change: 2.77 | |
| Week Change: 1.97% Year-to-date Change: 10.7% | |
| RCL Links: Profile News Message Board | |
| Charts:- Daily , Weekly | |
| Add RCL to Watchlist: View: Get RCL Trend Analysis ➞ | |
 | DE Deere & Company |
| Sector: Industrials | |
| SubSector: Farm & Construction Machinery | |
| MarketCap: 39168.7 Millions | |
| Recent Price: 400.96 Smart Investing & Trading Score: 83 | |
| Day Percent Change: 1.94% Day Change: 7.63 | |
| Week Change: 1.94% Year-to-date Change: 0.3% | |
| DE Links: Profile News Message Board | |
| Charts:- Daily , Weekly | |
| Add DE to Watchlist: View: Get DE Trend Analysis ➞ | |
 | AMT American Tower Corporation (REIT) |
| Sector: Financials | |
| SubSector: REIT - Diversified | |
| MarketCap: 92527 Millions | |
| Recent Price: 174.99 Smart Investing & Trading Score: 42 | |
| Day Percent Change: 1.92% Day Change: 3.30 | |
| Week Change: 1.92% Year-to-date Change: -18.9% | |
| AMT Links: Profile News Message Board | |
| Charts:- Daily , Weekly | |
| Add AMT to Watchlist: View: Get AMT Trend Analysis ➞ | |
 | PPL PPL Corporation |
| Sector: Utilities | |
| SubSector: Electric Utilities | |
| MarketCap: 16588.8 Millions | |
| Recent Price: 27.53 Smart Investing & Trading Score: 93 | |
| Day Percent Change: 1.89% Day Change: 0.51 | |
| Week Change: 1.89% Year-to-date Change: 1.6% | |
| PPL Links: Profile News Message Board | |
| Charts:- Daily , Weekly | |
| Add PPL to Watchlist: View: Get PPL Trend Analysis ➞ | |
 | CAT Caterpillar Inc. |
| Sector: Industrials | |
| SubSector: Farm & Construction Machinery | |
| MarketCap: 58636 Millions | |
| Recent Price: 349.80 Smart Investing & Trading Score: 53 | |
| Day Percent Change: 1.87% Day Change: 6.42 | |
| Week Change: 1.87% Year-to-date Change: 18.3% | |
| CAT Links: Profile News Message Board | |
| Charts:- Daily , Weekly | |
| Add CAT to Watchlist: View: Get CAT Trend Analysis ➞ | |
 | EMN Eastman Chemical Company |
| Sector: Materials | |
| SubSector: Chemicals - Major Diversified | |
| MarketCap: 6217.06 Millions | |
| Recent Price: 97.34 Smart Investing & Trading Score: 83 | |
| Day Percent Change: 1.86% Day Change: 1.78 | |
| Week Change: 1.86% Year-to-date Change: 8.4% | |
| EMN Links: Profile News Message Board | |
| Charts:- Daily , Weekly | |
| Add EMN to Watchlist: View: Get EMN Trend Analysis ➞ | |
 | HIG The Hartford Financial Services Group, Inc. |
| Sector: Financials | |
| SubSector: Property & Casualty Insurance | |
| MarketCap: 12582.8 Millions | |
| Recent Price: 97.07 Smart Investing & Trading Score: 49 | |
| Day Percent Change: 1.86% Day Change: 1.77 | |
| Week Change: 1.86% Year-to-date Change: 20.8% | |
| HIG Links: Profile News Message Board | |
| Charts:- Daily , Weekly | |
| Add HIG to Watchlist: View: Get HIG Trend Analysis ➞ | |
 | CCI Crown Castle International Corp. (REIT) |
| Sector: Technology | |
| SubSector: Diversified Communication Services | |
| MarketCap: 57615.4 Millions | |
| Recent Price: 95.32 Smart Investing & Trading Score: 28 | |
| Day Percent Change: 1.86% Day Change: 1.74 | |
| Week Change: 1.86% Year-to-date Change: -17.3% | |
| CCI Links: Profile News Message Board | |
| Charts:- Daily , Weekly | |
| Add CCI to Watchlist: View: Get CCI Trend Analysis ➞ | |
 | TEL TE Connectivity Ltd. |
| Sector: Technology | |
| SubSector: Diversified Electronics | |
| MarketCap: 20044.9 Millions | |
| Recent Price: 142.82 Smart Investing & Trading Score: 68 | |
| Day Percent Change: 1.86% Day Change: 2.61 | |
| Week Change: 1.86% Year-to-date Change: 1.7% | |
| TEL Links: Profile News Message Board | |
| Charts:- Daily , Weekly | |
| Add TEL to Watchlist: View: Get TEL Trend Analysis ➞ | |
 | UHS Universal Health Services, Inc. |
| Sector: Health Care | |
| SubSector: Hospitals | |
| MarketCap: 7217.66 Millions | |
| Recent Price: 169.12 Smart Investing & Trading Score: 95 | |
| Day Percent Change: 1.84% Day Change: 3.06 | |
| Week Change: 1.84% Year-to-date Change: 10.9% | |
| UHS Links: Profile News Message Board | |
| Charts:- Daily , Weekly | |
| Add UHS to Watchlist: View: Get UHS Trend Analysis ➞ | |
 | NXPI NXP Semiconductors N.V. |
| Sector: Technology | |
| SubSector: Semiconductor - Broad Line | |
| MarketCap: 22497.9 Millions | |
| Recent Price: 247.13 Smart Investing & Trading Score: 100 | |
| Day Percent Change: 1.83% Day Change: 4.43 | |
| Week Change: 1.83% Year-to-date Change: 7.6% | |
| NXPI Links: Profile News Message Board | |
| Charts:- Daily , Weekly | |
| Add NXPI to Watchlist: View: Get NXPI Trend Analysis ➞ | |
 | MET MetLife, Inc. |
| Sector: Financials | |
| SubSector: Life Insurance | |
| MarketCap: 26272.9 Millions | |
| Recent Price: 71.70 Smart Investing & Trading Score: 75 | |
| Day Percent Change: 1.82% Day Change: 1.28 | |
| Week Change: 1.82% Year-to-date Change: 8.4% | |
| MET Links: Profile News Message Board | |
| Charts:- Daily , Weekly | |
| Add MET to Watchlist: View: Get MET Trend Analysis ➞ | |
 | WBA Walgreens Boots Alliance, Inc. |
| Sector: Services & Goods | |
| SubSector: Drug Stores | |
| MarketCap: 46184.1 Millions | |
| Recent Price: 18.02 Smart Investing & Trading Score: 59 | |
| Day Percent Change: 1.81% Day Change: 0.32 | |
| Week Change: 1.81% Year-to-date Change: -31.0% | |
| WBA Links: Profile News Message Board | |
| Charts:- Daily , Weekly | |
| Add WBA to Watchlist: View: Get WBA Trend Analysis ➞ | |
 | AZO AutoZone, Inc. |
| Sector: Services & Goods | |
| SubSector: Auto Parts Stores | |
| MarketCap: 19128 Millions | |
| Recent Price: 2998.78 Smart Investing & Trading Score: 66 | |
| Day Percent Change: 1.79% Day Change: 52.80 | |
| Week Change: 1.79% Year-to-date Change: 16.0% | |
| AZO Links: Profile News Message Board | |
| Charts:- Daily , Weekly | |
| Add AZO to Watchlist: View: Get AZO Trend Analysis ➞ | |
 | AMD Advanced Micro Devices, Inc. |
| Sector: Technology | |
| SubSector: Semiconductor - Broad Line | |
| MarketCap: 54275.1 Millions | |
| Recent Price: 160.20 Smart Investing & Trading Score: 49 | |
| Day Percent Change: 1.78% Day Change: 2.80 | |
| Week Change: 1.78% Year-to-date Change: 8.7% | |
| AMD Links: Profile News Message Board | |
| Charts:- Daily , Weekly | |
| Add AMD to Watchlist: View: Get AMD Trend Analysis ➞ | |
 | QRVO Qorvo, Inc. |
| Sector: Technology | |
| SubSector: Semiconductor - Broad Line | |
| MarketCap: 9524.32 Millions | |
| Recent Price: 118.83 Smart Investing & Trading Score: 100 | |
| Day Percent Change: 1.78% Day Change: 2.08 | |
| Week Change: 1.78% Year-to-date Change: 5.5% | |
| QRVO Links: Profile News Message Board | |
| Charts:- Daily , Weekly | |
| Add QRVO to Watchlist: View: Get QRVO Trend Analysis ➞ | |
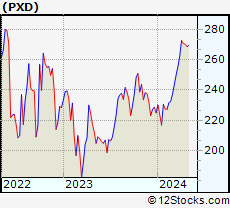 | PXD Pioneer Natural Resources Company |
| Sector: Energy | |
| SubSector: Independent Oil & Gas | |
| MarketCap: 11846.2 Millions | |
| Recent Price: 273.60 Smart Investing & Trading Score: 83 | |
| Day Percent Change: 1.76% Day Change: 4.73 | |
| Week Change: 1.76% Year-to-date Change: 21.7% | |
| PXD Links: Profile News Message Board | |
| Charts:- Daily , Weekly | |
| Add PXD to Watchlist: View: Get PXD Trend Analysis ➞ | |
 | HST Host Hotels & Resorts, Inc. |
| Sector: Financials | |
| SubSector: REIT - Hotel/Motel | |
| MarketCap: 8253.74 Millions | |
| Recent Price: 19.19 Smart Investing & Trading Score: 37 | |
| Day Percent Change: 1.75% Day Change: 0.33 | |
| Week Change: 1.75% Year-to-date Change: -1.4% | |
| HST Links: Profile News Message Board | |
| Charts:- Daily , Weekly | |
| Add HST to Watchlist: View: Get HST Trend Analysis ➞ | |
 | SPG Simon Property Group, Inc. |
| Sector: Financials | |
| SubSector: REIT - Retail | |
| MarketCap: 17959.6 Millions | |
| Recent Price: 144.83 Smart Investing & Trading Score: 75 | |
| Day Percent Change: 1.74% Day Change: 2.47 | |
| Week Change: 1.74% Year-to-date Change: 1.5% | |
| SPG Links: Profile News Message Board | |
| Charts:- Daily , Weekly | |
| Add SPG to Watchlist: View: Get SPG Trend Analysis ➞ | |
 | MDLZ Mondelez International, Inc. |
| Sector: Consumer Staples | |
| SubSector: Confectioners | |
| MarketCap: 68385.8 Millions | |
| Recent Price: 71.83 Smart Investing & Trading Score: 57 | |
| Day Percent Change: 1.73% Day Change: 1.22 | |
| Week Change: 1.73% Year-to-date Change: -0.8% | |
| MDLZ Links: Profile News Message Board | |
| Charts:- Daily , Weekly | |
| Add MDLZ to Watchlist: View: Get MDLZ Trend Analysis ➞ | |
 | ENPH Enphase Energy, Inc. |
| Sector: Technology | |
| SubSector: Semiconductor Equipment & Materials | |
| MarketCap: 4047.48 Millions | |
| Recent Price: 113.86 Smart Investing & Trading Score: 68 | |
| Day Percent Change: 1.72% Day Change: 1.93 | |
| Week Change: 1.72% Year-to-date Change: -13.8% | |
| ENPH Links: Profile News Message Board | |
| Charts:- Daily , Weekly | |
| Add ENPH to Watchlist: View: Get ENPH Trend Analysis ➞ | |
 | FE FirstEnergy Corp. |
| Sector: Utilities | |
| SubSector: Electric Utilities | |
| MarketCap: 20754.1 Millions | |
| Recent Price: 38.78 Smart Investing & Trading Score: 100 | |
| Day Percent Change: 1.70% Day Change: 0.65 | |
| Week Change: 1.7% Year-to-date Change: 5.8% | |
| FE Links: Profile News Message Board | |
| Charts:- Daily , Weekly | |
| Add FE to Watchlist: View: Get FE Trend Analysis ➞ | |
 | INCY Incyte Corporation |
| Sector: Health Care | |
| SubSector: Biotechnology | |
| MarketCap: 15343.2 Millions | |
| Recent Price: 52.56 Smart Investing & Trading Score: 49 | |
| Day Percent Change: 1.70% Day Change: 0.88 | |
| Week Change: 1.7% Year-to-date Change: -16.3% | |
| INCY Links: Profile News Message Board | |
| Charts:- Daily , Weekly | |
| Add INCY to Watchlist: View: Get INCY Trend Analysis ➞ | |
| For tabular summary view of above stock list: Summary View ➞ 0 - 25 , 25 - 50 , 50 - 75 , 75 - 100 , 100 - 125 , 125 - 150 , 150 - 175 , 175 - 200 , 200 - 225 , 225 - 250 , 250 - 275 , 275 - 300 , 300 - 325 , 325 - 350 , 350 - 375 , 375 - 400 , 400 - 425 , 425 - 450 , 450 - 475 , 475 - 500 | ||
| Click To Change The Sort Order: By Market Cap or Company Size Performance: Year-to-date, Week and Day | |
| Select Chart Type: | ||
|
Best Stocks Today 12Stocks.com |
© 2024 12Stocks.com Terms & Conditions Privacy Contact Us
All Information Provided Only For Education And Not To Be Used For Investing or Trading. See Terms & Conditions


One More Thing ... Get Best Stocks Delivered Daily!
Never Ever Miss A Move With Our Top Ten Stocks Lists
Find Best Stocks In Any Market - Bull or Bear Market
Take A Peek At Our Top Ten Stocks Lists: Daily, Weekly, Year-to-Date & Top Trends
Find Best Stocks In Any Market - Bull or Bear Market
Take A Peek At Our Top Ten Stocks Lists: Daily, Weekly, Year-to-Date & Top Trends
S&P 500 Stocks With Best Up Trends [0-bearish to 100-bullish]: Tesla [100], Albemarle [100], Domino s[100], Quest Diagnostics[100], AES [100], Carrier Global[100], Teradyne [100], DaVita [100], Skyworks Solutions[100], Moderna [100], NextEra [100]
Best S&P 500 Stocks Year-to-Date:
NVIDIA [77.21%], Constellation [61.05%], NRG [43.04%], Chipotle Mexican[40.34%], Eaton [35.58%], Marathon [35.15%], Targa Resources[34.91%], Micron [34.01%], Western Digital[33.4%], Diamondback [32.74%], DaVita [31.86%] Best S&P 500 Stocks This Week:
Tesla [15.31%], Albemarle [7.57%], Domino s[5.62%], Paper[4.4%], ON Semiconductor[4.06%], Quest Diagnostics[3.9%], Freeport-McMoRan [3.78%], AES [3.78%], Boeing [3.75%], Carrier Global[3.65%], Teradyne [3.64%] Best S&P 500 Stocks Daily:
Tesla [15.31%], Albemarle [7.57%], Domino s[5.62%], Paper[4.40%], ON Semiconductor[4.06%], Quest Diagnostics[3.90%], Freeport-McMoRan [3.78%], AES [3.78%], Boeing [3.75%], Carrier Global[3.65%], Teradyne [3.64%]