
 Login Sign Up


| |||||
 |  | ||||

| 12Stocks.com Market Intelligence |
Best S&P 500 Stocks
|
On this page, you will find the most comprehensive analysis of S&P 500 stocks and ETFs - from latest trends to performances to charts ➞. First, here are the year-to-date (YTD) performances of the most requested S&P 500 stocks at 12Stocks.com (click stock for review):
| NVIDIA 77% | ||
| Merck 19% | ||
| Amazon.com 19% | ||
| Google 19% | ||
| Caterpillar 18% | ||
| Walmart 15% | ||
| JPMorgan Chase 14% | ||
| Goldman Sachs 12% | ||
| Chevron 12% | ||
| Microsoft 7% | ||
| Johnson & Johnson -6% | ||
| McDonald s -8% | ||
| Starbucks -8% | ||
| Apple -10% | ||
| Gilead -19% | ||
| Boeing -33% | ||
| Intel -38% | ||
| Quick: S&P 500 Stocks Lists: Performances & Trends, S&P 500 Stock Charts
Sort S&P 500 stocks: Daily, Weekly, Year-to-Date, Market Cap & Trends. Filter S&P 500 stocks list by sector: Show all, Tech, Finance, Energy, Staples, Retail, Industrial, Materials, Utilities and HealthCare |
| 12Stocks.com S&P 500 Stocks Performances & Trends Daily Report | |||||||||
|
| 
The overall Smart Investing & Trading Score is 78 (0-bearish to 100-bullish) which puts S&P 500 index in short term neutral to bullish trend. The Smart Investing & Trading Score from previous trading session is 63 and hence an improvement of trend. | ||||||||
Here are the Smart Investing & Trading Scores of the most requested S&P 500 stocks at 12Stocks.com (click stock name for detailed review):
|


| 12Stocks.com: Top Performing S&P 500 Index Stocks | ||||||||||||||||||||||||||||||||||||||||||||||||
 The top performing S&P 500 Index stocks year to date are
Now, more recently, over last week, the top performing S&P 500 Index stocks on the move are


|
||||||||||||||||||||||||||||||||||||||||||||||||
| 12Stocks.com: Investing in S&P 500 Index with Stocks | |
|
The following table helps investors and traders sort through current performance and trends (as measured by Smart Investing & Trading Score) of various
stocks in the S&P 500 Index. Quick View: Move mouse or cursor over stock symbol (ticker) to view short-term technical chart and over stock name to view long term chart. Click on  to add stock symbol to your watchlist and to add stock symbol to your watchlist and  to view watchlist. Click on any ticker or stock name for detailed market intelligence report for that stock. to view watchlist. Click on any ticker or stock name for detailed market intelligence report for that stock. |
12Stocks.com Performance of Stocks in S&P 500 Index
| Ticker | Stock Name | Watchlist | Category | Recent Price | Smart Investing & Trading Score | Change % | Weekly Change% |
| EIX | Edison |   | Utilities | 71.33 | 93 | 1.70% | 1.70% |
| ES | Eversource | | Utilities | 60.46 | 93 | 1.68% | 1.68% |
| CLX | Clorox | | Consumer Staples | 148.92 | 100 | 1.67% | 1.67% |
| PNW | Pinnacle West | | Utilities | 74.91 | 93 | 1.66% | 1.66% |
| PFG | Principal Financial | | Financials | 80.43 | 75 | 1.66% | 1.66% |
| AEP | American Electric | | Utilities | 86.67 | 93 | 1.65% | 1.65% |
| AXON | Axovant | | Health Care | 313.30 | 78 | 1.64% | 1.64% |
| BWA | BorgWarner | | Consumer Staples | 33.73 | 67 | 1.63% | 1.63% |
| TAP | Molson Coors | | Consumer Staples | 63.56 | 51 | 1.63% | 1.63% |
| AIG | American | | Financials | 75.74 | 85 | 1.62% | 1.62% |
| T | AT&T | | Technology | 17.02 | 69 | 1.61% | 1.61% |
| WEC | WEC | | Utilities | 82.80 | 86 | 1.61% | 1.61% |
| SO | Southern | | Utilities | 74.39 | 88 | 1.61% | 1.61% |
| NRG | NRG | | Utilities | 73.95 | 75 | 1.57% | 1.57% |
| PYPL | PayPal Holdings | | Financials | 66.99 | 100 | 1.56% | 1.56% |
| AMP | Ameriprise Financial | | Financials | 416.35 | 71 | 1.55% | 1.55% |
| CB | Chubb | | Financials | 249.22 | 73 | 1.54% | 1.54% |
| HCA | HCA Healthcare | | Health Care | 311.42 | 48 | 1.54% | 1.54% |
| VTR | Ventas | | Financials | 44.67 | 74 | 1.52% | 1.52% |
| CDW | CDW | | Technology | 245.94 | 90 | 1.52% | 1.52% |
| PCAR | PACCAR Inc | | Consumer Staples | 113.64 | 51 | 1.50% | 1.50% |
| MAA | Mid-America Apartment | | Financials | 131.13 | 100 | 1.47% | 1.47% |
| ATO | Atmos | | Utilities | 118.64 | 93 | 1.46% | 1.46% |
| IEX | IDEX | | Industrials | 223.88 | 44 | 1.46% | 1.46% |
| TSCO | Tractor Supply | | Services & Goods | 277.88 | 100 | 1.45% | 1.45% |
| For chart view version of above stock list: Chart View ➞ 0 - 25 , 25 - 50 , 50 - 75 , 75 - 100 , 100 - 125 , 125 - 150 , 150 - 175 , 175 - 200 , 200 - 225 , 225 - 250 , 250 - 275 , 275 - 300 , 300 - 325 , 325 - 350 , 350 - 375 , 375 - 400 , 400 - 425 , 425 - 450 , 450 - 475 , 475 - 500 | ||
 | Click To Change The Sort Order: By Market Cap or Company Size Performance: Year-to-date, Week and Day |  |
|
Get the most comprehensive stock market coverage daily at 12Stocks.com ➞ Best Stocks Today ➞ Best Stocks Weekly ➞ Best Stocks Year-to-Date ➞ Best Stocks Trends ➞  Best Stocks Today 12Stocks.com Best Nasdaq Stocks ➞ Best S&P 500 Stocks ➞ Best Tech Stocks ➞ Best Biotech Stocks ➞ |
| Detailed Overview of S&P 500 Stocks |
| S&P 500 Technical Overview, Leaders & Laggards, Top S&P 500 ETF Funds & Detailed S&P 500 Stocks List, Charts, Trends & More |
| S&P 500: Technical Analysis, Trends & YTD Performance | |
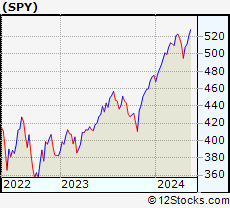
| S&P 500 index as represented by
SPY, an exchange-traded fund [ETF], holds basket of five hundred (mostly largecap) stocks from across all major sectors of the US stock market. The S&P 500 index (contains stocks like Apple and Exxon) is up by 7.31% and is currently outperforming the overall market by 0.75% year-to-date. Below is a quick view of technical charts and trends: | |
 SPY Weekly Chart |
|
| Long Term Trend: Good | |
| Medium Term Trend: Not Good | |
 SPY Daily Chart |
|
| Short Term Trend: Very Good | |
| Overall Trend Score: 78 | |
| YTD Performance: 7.31% | |
| **Trend Scores & Views Are Only For Educational Purposes And Not For Investing | |
| 12Stocks.com: Investing in S&P 500 Index using Exchange Traded Funds | |
|
The following table shows list of key exchange traded funds (ETF) that
help investors track S&P 500 index. The following list also includes leveraged ETF funds that track twice or thrice the daily returns of S&P 500 indices. Short or inverse ETF funds move in the opposite direction to the index they track and are useful during market pullbacks or during bear markets. Quick View: Move mouse or cursor over ETF symbol (ticker) to view short-term technical chart and over ETF name to view long term chart. Click on ticker or stock name for detailed view. Click on to add stock symbol to your watchlist and to view watchlist. |
12Stocks.com List of ETFs that track S&P 500 Index
| Ticker | ETF Name | Watchlist | Recent Price | Smart Investing & Trading Score | Change % | Week % | Year-to-date % |
| SPY | SPDR S&P 500 ETF | | 510.06 | 78 | 0.35 | 0.35 | 7.31% |
| IVV | iShares Core S&P 500 ETF | | 512.59 | 78 | 0.36 | 0.36 | 7.32% |
| VOO | Vanguard 500 ETF | | 468.84 | 78 | 0.35 | 0.35 | 7.34% |
| OEF | iShares S&P 100 | | 242.09 | 78 | 0.22 | 0.22 | 8.37% |
| SSO | ProShares Ultra S&P500 | | 73.19 | 78 | 0.66 | 0.66 | 12.48% |
| UPRO | ProShares UltraPro S&P500 | | 64.44 | 70 | 0.97 | 0.97 | 17.72% |
| SPXL | Direxion Daily S&P500 Bull 3X ETF | | 122.36 | 70 | 1.01 | 1.01 | 17.67% |
| SH | ProShares Short S&P500 | | 12.25 | 35 | -0.24 | -0.24 | -5.7% |
| SDS | ProShares UltraShort S&P500 | | 26.36 | 23 | -0.64 | -0.64 | -11.9% |
| SPXU | ProShares UltraPro Short S&P500 | | 35.17 | 35 | -0.93 | -0.93 | -18.21% |
| SPXS | Direxion Daily S&P 500 Bear 3X ETF | | 9.52 | 25 | -0.94 | -0.94 | -17.58% |
| 12Stocks.com: Charts, Trends, Fundamental Data and Performances of S&P 500 Stocks | |
|
We now take in-depth look at all S&P 500 stocks including charts, multi-period performances and overall trends (as measured by Smart Investing & Trading Score). One can sort S&P 500 stocks (click link to choose) by Daily, Weekly and by Year-to-Date performances. Also, one can sort by size of the company or by market capitalization. |
| Select Your Default Chart Type: | |||||
| |||||
| Click on stock symbol or name for detailed view. Click on to add stock symbol to your watchlist and to view watchlist. Quick View: Move mouse or cursor over "Daily" to quickly view daily technical stock chart and over "Weekly" to view weekly technical stock chart. | |||||

 | EIX Edison International |
| Sector: Utilities | |
| SubSector: Electric Utilities | |
| MarketCap: 19358.1 Millions | |
| Recent Price: 71.33 Smart Investing & Trading Score: 93 | |
| Day Percent Change: 1.70% Day Change: 1.19 | |
| Week Change: 1.7% Year-to-date Change: -0.2% | |
| EIX Links: Profile News Message Board | |
| Charts:- Daily , Weekly | |
| Add EIX to Watchlist: View: Get EIX Trend Analysis ➞ | |
 | ES Eversource Energy |
| Sector: Utilities | |
| SubSector: Diversified Utilities | |
| MarketCap: 23963.4 Millions | |
| Recent Price: 60.46 Smart Investing & Trading Score: 93 | |
| Day Percent Change: 1.68% Day Change: 1.00 | |
| Week Change: 1.68% Year-to-date Change: -2.0% | |
| ES Links: Profile News Message Board | |
| Charts:- Daily , Weekly | |
| Add ES to Watchlist: View: Get ES Trend Analysis ➞ | |
 | CLX The Clorox Company |
| Sector: Consumer Staples | |
| SubSector: Housewares & Accessories | |
| MarketCap: 23688.3 Millions | |
| Recent Price: 148.92 Smart Investing & Trading Score: 100 | |
| Day Percent Change: 1.67% Day Change: 2.44 | |
| Week Change: 1.67% Year-to-date Change: 4.4% | |
| CLX Links: Profile News Message Board | |
| Charts:- Daily , Weekly | |
| Add CLX to Watchlist: View: Get CLX Trend Analysis ➞ | |
 | PNW Pinnacle West Capital Corporation |
| Sector: Utilities | |
| SubSector: Electric Utilities | |
| MarketCap: 8240.24 Millions | |
| Recent Price: 74.91 Smart Investing & Trading Score: 93 | |
| Day Percent Change: 1.66% Day Change: 1.22 | |
| Week Change: 1.66% Year-to-date Change: 4.3% | |
| PNW Links: Profile News Message Board | |
| Charts:- Daily , Weekly | |
| Add PNW to Watchlist: View: Get PNW Trend Analysis ➞ | |
 | PFG Principal Financial Group, Inc. |
| Sector: Financials | |
| SubSector: Life Insurance | |
| MarketCap: 8178.86 Millions | |
| Recent Price: 80.43 Smart Investing & Trading Score: 75 | |
| Day Percent Change: 1.66% Day Change: 1.31 | |
| Week Change: 1.66% Year-to-date Change: 2.2% | |
| PFG Links: Profile News Message Board | |
| Charts:- Daily , Weekly | |
| Add PFG to Watchlist: View: Get PFG Trend Analysis ➞ | |
 | AEP American Electric Power Company, Inc. |
| Sector: Utilities | |
| SubSector: Electric Utilities | |
| MarketCap: 38380 Millions | |
| Recent Price: 86.67 Smart Investing & Trading Score: 93 | |
| Day Percent Change: 1.65% Day Change: 1.41 | |
| Week Change: 1.65% Year-to-date Change: 6.7% | |
| AEP Links: Profile News Message Board | |
| Charts:- Daily , Weekly | |
| Add AEP to Watchlist: View: Get AEP Trend Analysis ➞ | |
 | AXON Axovant Sciences Ltd. |
| Sector: Health Care | |
| SubSector: Biotechnology | |
| MarketCap: 1492.04 Millions | |
| Recent Price: 313.30 Smart Investing & Trading Score: 78 | |
| Day Percent Change: 1.64% Day Change: 5.07 | |
| Week Change: 1.64% Year-to-date Change: 21.3% | |
| AXON Links: Profile News Message Board | |
| Charts:- Daily , Weekly | |
| Add AXON to Watchlist: View: Get AXON Trend Analysis ➞ | |
 | BWA BorgWarner Inc. |
| Sector: Consumer Staples | |
| SubSector: Auto Parts | |
| MarketCap: 4604.09 Millions | |
| Recent Price: 33.73 Smart Investing & Trading Score: 67 | |
| Day Percent Change: 1.63% Day Change: 0.54 | |
| Week Change: 1.63% Year-to-date Change: -5.9% | |
| BWA Links: Profile News Message Board | |
| Charts:- Daily , Weekly | |
| Add BWA to Watchlist: View: Get BWA Trend Analysis ➞ | |
 | TAP Molson Coors Beverage Company |
| Sector: Consumer Staples | |
| SubSector: Beverages - Brewers | |
| MarketCap: 8619.97 Millions | |
| Recent Price: 63.56 Smart Investing & Trading Score: 51 | |
| Day Percent Change: 1.63% Day Change: 1.02 | |
| Week Change: 1.63% Year-to-date Change: 3.8% | |
| TAP Links: Profile News Message Board | |
| Charts:- Daily , Weekly | |
| Add TAP to Watchlist: View: Get TAP Trend Analysis ➞ | |
 | AIG American International Group, Inc. |
| Sector: Financials | |
| SubSector: Property & Casualty Insurance | |
| MarketCap: 21219 Millions | |
| Recent Price: 75.74 Smart Investing & Trading Score: 85 | |
| Day Percent Change: 1.62% Day Change: 1.21 | |
| Week Change: 1.62% Year-to-date Change: 11.8% | |
| AIG Links: Profile News Message Board | |
| Charts:- Daily , Weekly | |
| Add AIG to Watchlist: View: Get AIG Trend Analysis ➞ | |
 | T AT&T Inc. |
| Sector: Technology | |
| SubSector: Telecom Services - Domestic | |
| MarketCap: 224847 Millions | |
| Recent Price: 17.02 Smart Investing & Trading Score: 69 | |
| Day Percent Change: 1.61% Day Change: 0.27 | |
| Week Change: 1.61% Year-to-date Change: 1.4% | |
| T Links: Profile News Message Board | |
| Charts:- Daily , Weekly | |
| Add T to Watchlist: View: Get T Trend Analysis ➞ | |
 | WEC WEC Energy Group, Inc. |
| Sector: Utilities | |
| SubSector: Electric Utilities | |
| MarketCap: 24852 Millions | |
| Recent Price: 82.80 Smart Investing & Trading Score: 86 | |
| Day Percent Change: 1.61% Day Change: 1.31 | |
| Week Change: 1.61% Year-to-date Change: -1.6% | |
| WEC Links: Profile News Message Board | |
| Charts:- Daily , Weekly | |
| Add WEC to Watchlist: View: Get WEC Trend Analysis ➞ | |
 | SO The Southern Company |
| Sector: Utilities | |
| SubSector: Electric Utilities | |
| MarketCap: 54483.6 Millions | |
| Recent Price: 74.39 Smart Investing & Trading Score: 88 | |
| Day Percent Change: 1.61% Day Change: 1.18 | |
| Week Change: 1.61% Year-to-date Change: 6.1% | |
| SO Links: Profile News Message Board | |
| Charts:- Daily , Weekly | |
| Add SO to Watchlist: View: Get SO Trend Analysis ➞ | |
 | NRG NRG Energy, Inc. |
| Sector: Utilities | |
| SubSector: Diversified Utilities | |
| MarketCap: 6510.7 Millions | |
| Recent Price: 73.95 Smart Investing & Trading Score: 75 | |
| Day Percent Change: 1.57% Day Change: 1.14 | |
| Week Change: 1.57% Year-to-date Change: 43.0% | |
| NRG Links: Profile News Message Board | |
| Charts:- Daily , Weekly | |
| Add NRG to Watchlist: View: Get NRG Trend Analysis ➞ | |
 | PYPL PayPal Holdings, Inc. |
| Sector: Financials | |
| SubSector: Credit Services | |
| MarketCap: 108949 Millions | |
| Recent Price: 66.99 Smart Investing & Trading Score: 100 | |
| Day Percent Change: 1.56% Day Change: 1.03 | |
| Week Change: 1.56% Year-to-date Change: 9.1% | |
| PYPL Links: Profile News Message Board | |
| Charts:- Daily , Weekly | |
| Add PYPL to Watchlist: View: Get PYPL Trend Analysis ➞ | |
 | AMP Ameriprise Financial, Inc. |
| Sector: Financials | |
| SubSector: Asset Management | |
| MarketCap: 13270.5 Millions | |
| Recent Price: 416.35 Smart Investing & Trading Score: 71 | |
| Day Percent Change: 1.55% Day Change: 6.34 | |
| Week Change: 1.55% Year-to-date Change: 9.6% | |
| AMP Links: Profile News Message Board | |
| Charts:- Daily , Weekly | |
| Add AMP to Watchlist: View: Get AMP Trend Analysis ➞ | |
 | CB Chubb Limited |
| Sector: Financials | |
| SubSector: Property & Casualty Insurance | |
| MarketCap: 51615.9 Millions | |
| Recent Price: 249.22 Smart Investing & Trading Score: 73 | |
| Day Percent Change: 1.54% Day Change: 3.77 | |
| Week Change: 1.54% Year-to-date Change: 10.3% | |
| CB Links: Profile News Message Board | |
| Charts:- Daily , Weekly | |
| Add CB to Watchlist: View: Get CB Trend Analysis ➞ | |
 | HCA HCA Healthcare, Inc. |
| Sector: Health Care | |
| SubSector: Hospitals | |
| MarketCap: 29466.6 Millions | |
| Recent Price: 311.42 Smart Investing & Trading Score: 48 | |
| Day Percent Change: 1.54% Day Change: 4.73 | |
| Week Change: 1.54% Year-to-date Change: 15.1% | |
| HCA Links: Profile News Message Board | |
| Charts:- Daily , Weekly | |
| Add HCA to Watchlist: View: Get HCA Trend Analysis ➞ | |
 | VTR Ventas, Inc. |
| Sector: Financials | |
| SubSector: REIT - Healthcare Facilities | |
| MarketCap: 11180.4 Millions | |
| Recent Price: 44.67 Smart Investing & Trading Score: 74 | |
| Day Percent Change: 1.52% Day Change: 0.67 | |
| Week Change: 1.52% Year-to-date Change: -10.4% | |
| VTR Links: Profile News Message Board | |
| Charts:- Daily , Weekly | |
| Add VTR to Watchlist: View: Get VTR Trend Analysis ➞ | |
 | CDW CDW Corporation |
| Sector: Technology | |
| SubSector: Information Technology Services | |
| MarketCap: 12775 Millions | |
| Recent Price: 245.94 Smart Investing & Trading Score: 90 | |
| Day Percent Change: 1.52% Day Change: 3.68 | |
| Week Change: 1.52% Year-to-date Change: 8.2% | |
| CDW Links: Profile News Message Board | |
| Charts:- Daily , Weekly | |
| Add CDW to Watchlist: View: Get CDW Trend Analysis ➞ | |
 | PCAR PACCAR Inc |
| Sector: Consumer Staples | |
| SubSector: Trucks & Other Vehicles | |
| MarketCap: 19117.7 Millions | |
| Recent Price: 113.64 Smart Investing & Trading Score: 51 | |
| Day Percent Change: 1.50% Day Change: 1.68 | |
| Week Change: 1.5% Year-to-date Change: 16.4% | |
| PCAR Links: Profile News Message Board | |
| Charts:- Daily , Weekly | |
| Add PCAR to Watchlist: View: Get PCAR Trend Analysis ➞ | |
 | MAA Mid-America Apartment Communities, Inc. |
| Sector: Financials | |
| SubSector: REIT - Residential | |
| MarketCap: 11385.5 Millions | |
| Recent Price: 131.13 Smart Investing & Trading Score: 100 | |
| Day Percent Change: 1.47% Day Change: 1.90 | |
| Week Change: 1.47% Year-to-date Change: -2.5% | |
| MAA Links: Profile News Message Board | |
| Charts:- Daily , Weekly | |
| Add MAA to Watchlist: View: Get MAA Trend Analysis ➞ | |
 | ATO Atmos Energy Corporation |
| Sector: Utilities | |
| SubSector: Gas Utilities | |
| MarketCap: 11449 Millions | |
| Recent Price: 118.64 Smart Investing & Trading Score: 93 | |
| Day Percent Change: 1.46% Day Change: 1.71 | |
| Week Change: 1.46% Year-to-date Change: 2.4% | |
| ATO Links: Profile News Message Board | |
| Charts:- Daily , Weekly | |
| Add ATO to Watchlist: View: Get ATO Trend Analysis ➞ | |
 | IEX IDEX Corporation |
| Sector: Industrials | |
| SubSector: Diversified Machinery | |
| MarketCap: 9721.46 Millions | |
| Recent Price: 223.88 Smart Investing & Trading Score: 44 | |
| Day Percent Change: 1.46% Day Change: 3.22 | |
| Week Change: 1.46% Year-to-date Change: 3.1% | |
| IEX Links: Profile News Message Board | |
| Charts:- Daily , Weekly | |
| Add IEX to Watchlist: View: Get IEX Trend Analysis ➞ | |
 | TSCO Tractor Supply Company |
| Sector: Services & Goods | |
| SubSector: Specialty Retail, Other | |
| MarketCap: 9692.94 Millions | |
| Recent Price: 277.88 Smart Investing & Trading Score: 100 | |
| Day Percent Change: 1.45% Day Change: 3.98 | |
| Week Change: 1.45% Year-to-date Change: 29.2% | |
| TSCO Links: Profile News Message Board | |
| Charts:- Daily , Weekly | |
| Add TSCO to Watchlist: View: Get TSCO Trend Analysis ➞ | |
| For tabular summary view of above stock list: Summary View ➞ 0 - 25 , 25 - 50 , 50 - 75 , 75 - 100 , 100 - 125 , 125 - 150 , 150 - 175 , 175 - 200 , 200 - 225 , 225 - 250 , 250 - 275 , 275 - 300 , 300 - 325 , 325 - 350 , 350 - 375 , 375 - 400 , 400 - 425 , 425 - 450 , 450 - 475 , 475 - 500 | ||
| Click To Change The Sort Order: By Market Cap or Company Size Performance: Year-to-date, Week and Day | |
| Select Chart Type: | ||
|
Best Stocks Today 12Stocks.com |
© 2024 12Stocks.com Terms & Conditions Privacy Contact Us
All Information Provided Only For Education And Not To Be Used For Investing or Trading. See Terms & Conditions


One More Thing ... Get Best Stocks Delivered Daily!
Never Ever Miss A Move With Our Top Ten Stocks Lists
Find Best Stocks In Any Market - Bull or Bear Market
Take A Peek At Our Top Ten Stocks Lists: Daily, Weekly, Year-to-Date & Top Trends
Find Best Stocks In Any Market - Bull or Bear Market
Take A Peek At Our Top Ten Stocks Lists: Daily, Weekly, Year-to-Date & Top Trends
S&P 500 Stocks With Best Up Trends [0-bearish to 100-bullish]: Tesla [100], Albemarle [100], Domino s[100], Quest Diagnostics[100], AES [100], Carrier Global[100], Teradyne [100], DaVita [100], Skyworks Solutions[100], Moderna [100], NextEra [100]
Best S&P 500 Stocks Year-to-Date:
NVIDIA [77.21%], Constellation [61.05%], NRG [43.04%], Chipotle Mexican[40.34%], Eaton [35.58%], Marathon [35.15%], Targa Resources[34.91%], Micron [34.01%], Western Digital[33.4%], Diamondback [32.74%], DaVita [31.86%] Best S&P 500 Stocks This Week:
Tesla [15.31%], Albemarle [7.57%], Domino s[5.62%], Paper[4.4%], ON Semiconductor[4.06%], Quest Diagnostics[3.9%], Freeport-McMoRan [3.78%], AES [3.78%], Boeing [3.75%], Carrier Global[3.65%], Teradyne [3.64%] Best S&P 500 Stocks Daily:
Tesla [15.31%], Albemarle [7.57%], Domino s[5.62%], Paper[4.40%], ON Semiconductor[4.06%], Quest Diagnostics[3.90%], Freeport-McMoRan [3.78%], AES [3.78%], Boeing [3.75%], Carrier Global[3.65%], Teradyne [3.64%]