
 Login Sign Up


| |||||
 |  | ||||

| 12Stocks.com Market Intelligence |
Best S&P 500 Stocks
|
On this page, you will find the most comprehensive analysis of S&P 500 stocks and ETFs - from latest trends to performances to charts ➞. First, here are the year-to-date (YTD) performances of the most requested S&P 500 stocks at 12Stocks.com (click stock for review):
| NVIDIA 61% | ||
| Caterpillar 23% | ||
| Merck 16% | ||
| Amazon.com 16% | ||
| Walmart 14% | ||
| Google 14% | ||
| JPMorgan Chase 14% | ||
| Chevron 10% | ||
| Goldman Sachs 10% | ||
| Microsoft 9% | ||
| Johnson & Johnson -5% | ||
| McDonald s -7% | ||
| Starbucks -8% | ||
| Apple -12% | ||
| Gilead -17% | ||
| Intel -31% | ||
| Boeing -37% | ||
| Quick: S&P 500 Stocks Lists: Performances & Trends, S&P 500 Stock Charts
Sort S&P 500 stocks: Daily, Weekly, Year-to-Date, Market Cap & Trends. Filter S&P 500 stocks list by sector: Show all, Tech, Finance, Energy, Staples, Retail, Industrial, Materials, Utilities and HealthCare |
| 12Stocks.com S&P 500 Stocks Performances & Trends Daily Report | |||||||||
|
| 
The overall Smart Investing & Trading Score is 58 (0-bearish to 100-bullish) which puts S&P 500 index in short term neutral trend. The Smart Investing & Trading Score from previous trading session is 51 and an improvement of trend continues. | ||||||||
Here are the Smart Investing & Trading Scores of the most requested S&P 500 stocks at 12Stocks.com (click stock name for detailed review):
|


| 12Stocks.com: Top Performing S&P 500 Index Stocks | ||||||||||||||||||||||||||||||||||||||||||||||||
 The top performing S&P 500 Index stocks year to date are
Now, more recently, over last week, the top performing S&P 500 Index stocks on the move are


|
||||||||||||||||||||||||||||||||||||||||||||||||
| 12Stocks.com: Investing in S&P 500 Index with Stocks | |
|
The following table helps investors and traders sort through current performance and trends (as measured by Smart Investing & Trading Score) of various
stocks in the S&P 500 Index. Quick View: Move mouse or cursor over stock symbol (ticker) to view short-term technical chart and over stock name to view long term chart. Click on  to add stock symbol to your watchlist and to add stock symbol to your watchlist and  to view watchlist. Click on any ticker or stock name for detailed market intelligence report for that stock. to view watchlist. Click on any ticker or stock name for detailed market intelligence report for that stock. |
12Stocks.com Performance of Stocks in S&P 500 Index
| Ticker | Stock Name | Watchlist | Category | Recent Price | Smart Investing & Trading Score | Change % | Weekly Change% |
| GWW | W.W. Grainger |   | Services & Goods | 958.32 | 58 | 0.26% | 1.66% |
| STE | STERIS | | Health Care | 202.80 | 39 | -1.55% | 1.65% |
| EXR | Extra Space | | Financials | 134.64 | 35 | 1.02% | 1.65% |
| VRTX | Vertex | | Health Care | 400.76 | 42 | -1.02% | 1.64% |
| WM | Waste Management | | Industrials | 210.43 | 90 | 0.79% | 1.62% |
| MSI | Motorola Solutions | | Technology | 345.11 | 63 | -0.13% | 1.61% |
| TTWO | Take-Two Interactive | | Technology | 142.83 | 42 | 0.78% | 1.59% |
| EBAY | eBay | | Services & Goods | 51.18 | 68 | -0.14% | 1.57% |
| MA | Mastercard | | Financials | 462.50 | 58 | -0.07% | 1.56% |
| L | Loews | | Financials | 76.81 | 81 | 0.12% | 1.55% |
| HII | Huntington Ingalls | | Industrials | 275.84 | 51 | 0.50% | 1.54% |
| AMGN | Amgen | | Health Care | 273.01 | 64 | -0.19% | 1.52% |
| FOX | Twenty-First Century | | Services & Goods | 29.31 | 74 | 0.45% | 1.52% |
| SBAC | SBA | | Technology | 199.00 | 35 | 0.35% | 1.50% |
| GNRC | Generac Holdings | | Industrials | 137.18 | 100 | 0.79% | 1.50% |
| JCI | Johnson Controls | | Consumer Staples | 64.61 | 61 | -0.86% | 1.49% |
| NVR | NVR | | Industrials | 7798.28 | 63 | -0.47% | 1.47% |
| ZBH | Zimmer Biomet | | Health Care | 121.17 | 37 | -0.29% | 1.46% |
| CARR | Carrier Global | | Industrials | 54.77 | 45 | -0.67% | 1.43% |
| MPC | Marathon | | Energy | 199.14 | 68 | -0.26% | 1.41% |
| IFF | Flavors | | Materials | 85.14 | 88 | -0.34% | 1.39% |
| IBM | Business | | Technology | 184.10 | 45 | 1.05% | 1.39% |
| FSLR | First Solar | | Technology | 177.48 | 71 | -1.45% | 1.39% |
| CNC | Centene | | Health Care | 76.19 | 93 | 0.46% | 1.38% |
| XRAY | DENTSPLY SIRONA | | Health Care | 30.92 | 32 | 0.19% | 1.38% |
| For chart view version of above stock list: Chart View ➞ 0 - 25 , 25 - 50 , 50 - 75 , 75 - 100 , 100 - 125 , 125 - 150 , 150 - 175 , 175 - 200 , 200 - 225 , 225 - 250 , 250 - 275 , 275 - 300 , 300 - 325 , 325 - 350 , 350 - 375 , 375 - 400 , 400 - 425 , 425 - 450 , 450 - 475 , 475 - 500 | ||
 | Click To Change The Sort Order: By Market Cap or Company Size Performance: Year-to-date, Week and Day |  |
|
Get the most comprehensive stock market coverage daily at 12Stocks.com ➞ Best Stocks Today ➞ Best Stocks Weekly ➞ Best Stocks Year-to-Date ➞ Best Stocks Trends ➞  Best Stocks Today 12Stocks.com Best Nasdaq Stocks ➞ Best S&P 500 Stocks ➞ Best Tech Stocks ➞ Best Biotech Stocks ➞ |
| Detailed Overview of S&P 500 Stocks |
| S&P 500 Technical Overview, Leaders & Laggards, Top S&P 500 ETF Funds & Detailed S&P 500 Stocks List, Charts, Trends & More |
| S&P 500: Technical Analysis, Trends & YTD Performance | |
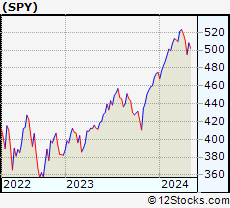
| S&P 500 index as represented by
SPY, an exchange-traded fund [ETF], holds basket of five hundred (mostly largecap) stocks from across all major sectors of the US stock market. The S&P 500 index (contains stocks like Apple and Exxon) is up by 6.33% and is currently outperforming the overall market by 0.67% year-to-date. Below is a quick view of technical charts and trends: | |
 SPY Weekly Chart |
|
| Long Term Trend: Good | |
| Medium Term Trend: Not Good | |
 SPY Daily Chart |
|
| Short Term Trend: Very Good | |
| Overall Trend Score: 58 | |
| YTD Performance: 6.33% | |
| **Trend Scores & Views Are Only For Educational Purposes And Not For Investing | |
| 12Stocks.com: Investing in S&P 500 Index using Exchange Traded Funds | |
|
The following table shows list of key exchange traded funds (ETF) that
help investors track S&P 500 index. The following list also includes leveraged ETF funds that track twice or thrice the daily returns of S&P 500 indices. Short or inverse ETF funds move in the opposite direction to the index they track and are useful during market pullbacks or during bear markets. Quick View: Move mouse or cursor over ETF symbol (ticker) to view short-term technical chart and over ETF name to view long term chart. Click on ticker or stock name for detailed view. Click on to add stock symbol to your watchlist and to view watchlist. |
12Stocks.com List of ETFs that track S&P 500 Index
| Ticker | ETF Name | Watchlist | Recent Price | Smart Investing & Trading Score | Change % | Week % | Year-to-date % |
| SPY | SPDR S&P 500 ETF | | 505.41 | 58 | -0.05 | 2.07 | 6.33% |
| IVV | iShares Core S&P 500 ETF | | 507.97 | 63 | -0.04 | 2.1 | 6.35% |
| VOO | Vanguard 500 ETF | | 464.50 | 63 | -0.07 | 2.07 | 6.34% |
| OEF | iShares S&P 100 | | 239.79 | 58 | -0.07 | 2.18 | 7.34% |
| SSO | ProShares Ultra S&P500 | | 71.95 | 58 | -0.12 | 4.11 | 10.57% |
| UPRO | ProShares UltraPro S&P500 | | 62.88 | 58 | -0.08 | 6.29 | 14.87% |
| SPXL | Direxion Daily S&P500 Bull 3X ETF | | 119.35 | 63 | -0.13 | 6.04 | 14.77% |
| SH | ProShares Short S&P500 | | 12.33 | 42 | -0.08 | -2.07 | -5.08% |
| SDS | ProShares UltraShort S&P500 | | 26.80 | 37 | 0.07 | -3.94 | -10.43% |
| SPXU | ProShares UltraPro Short S&P500 | | 36.04 | 42 | 0.14 | -5.97 | -16.19% |
| SPXS | Direxion Daily S&P 500 Bear 3X ETF | | 9.75 | 32 | 0.00 | -5.89 | -15.58% |
| 12Stocks.com: Charts, Trends, Fundamental Data and Performances of S&P 500 Stocks | |
|
We now take in-depth look at all S&P 500 stocks including charts, multi-period performances and overall trends (as measured by Smart Investing & Trading Score). One can sort S&P 500 stocks (click link to choose) by Daily, Weekly and by Year-to-Date performances. Also, one can sort by size of the company or by market capitalization. |
| Select Your Default Chart Type: | |||||
| |||||
| Click on stock symbol or name for detailed view. Click on to add stock symbol to your watchlist and to view watchlist. Quick View: Move mouse or cursor over "Daily" to quickly view daily technical stock chart and over "Weekly" to view weekly technical stock chart. | |||||

 | GWW W.W. Grainger, Inc. |
| Sector: Services & Goods | |
| SubSector: Industrial Equipment Wholesale | |
| MarketCap: 12794.8 Millions | |
| Recent Price: 958.32 Smart Investing & Trading Score: 58 | |
| Day Percent Change: 0.26% Day Change: 2.53 | |
| Week Change: 1.66% Year-to-date Change: 15.6% | |
| GWW Links: Profile News Message Board | |
| Charts:- Daily , Weekly | |
| Add GWW to Watchlist: View: Get GWW Trend Analysis ➞ | |
 | STE STERIS plc |
| Sector: Health Care | |
| SubSector: Medical Instruments & Supplies | |
| MarketCap: 10875 Millions | |
| Recent Price: 202.80 Smart Investing & Trading Score: 39 | |
| Day Percent Change: -1.55% Day Change: -3.19 | |
| Week Change: 1.65% Year-to-date Change: -7.8% | |
| STE Links: Profile News Message Board | |
| Charts:- Daily , Weekly | |
| Add STE to Watchlist: View: Get STE Trend Analysis ➞ | |
 | EXR Extra Space Storage Inc. |
| Sector: Financials | |
| SubSector: REIT - Industrial | |
| MarketCap: 11203.9 Millions | |
| Recent Price: 134.64 Smart Investing & Trading Score: 35 | |
| Day Percent Change: 1.02% Day Change: 1.36 | |
| Week Change: 1.65% Year-to-date Change: -16.0% | |
| EXR Links: Profile News Message Board | |
| Charts:- Daily , Weekly | |
| Add EXR to Watchlist: View: Get EXR Trend Analysis ➞ | |
 | VRTX Vertex Pharmaceuticals Incorporated |
| Sector: Health Care | |
| SubSector: Biotechnology | |
| MarketCap: 57669.6 Millions | |
| Recent Price: 400.76 Smart Investing & Trading Score: 42 | |
| Day Percent Change: -1.02% Day Change: -4.15 | |
| Week Change: 1.64% Year-to-date Change: -1.5% | |
| VRTX Links: Profile News Message Board | |
| Charts:- Daily , Weekly | |
| Add VRTX to Watchlist: View: Get VRTX Trend Analysis ➞ | |
 | WM Waste Management, Inc. |
| Sector: Industrials | |
| SubSector: Waste Management | |
| MarketCap: 46977.4 Millions | |
| Recent Price: 210.43 Smart Investing & Trading Score: 90 | |
| Day Percent Change: 0.79% Day Change: 1.65 | |
| Week Change: 1.62% Year-to-date Change: 17.5% | |
| WM Links: Profile News Message Board | |
| Charts:- Daily , Weekly | |
| Add WM to Watchlist: View: Get WM Trend Analysis ➞ | |
 | MSI Motorola Solutions, Inc. |
| Sector: Technology | |
| SubSector: Communication Equipment | |
| MarketCap: 26573.3 Millions | |
| Recent Price: 345.11 Smart Investing & Trading Score: 63 | |
| Day Percent Change: -0.13% Day Change: -0.44 | |
| Week Change: 1.61% Year-to-date Change: 10.2% | |
| MSI Links: Profile News Message Board | |
| Charts:- Daily , Weekly | |
| Add MSI to Watchlist: View: Get MSI Trend Analysis ➞ | |
 | TTWO Take-Two Interactive Software, Inc. |
| Sector: Technology | |
| SubSector: Multimedia & Graphics Software | |
| MarketCap: 12479.6 Millions | |
| Recent Price: 142.83 Smart Investing & Trading Score: 42 | |
| Day Percent Change: 0.78% Day Change: 1.11 | |
| Week Change: 1.59% Year-to-date Change: -11.3% | |
| TTWO Links: Profile News Message Board | |
| Charts:- Daily , Weekly | |
| Add TTWO to Watchlist: View: Get TTWO Trend Analysis ➞ | |
 | EBAY eBay Inc. |
| Sector: Services & Goods | |
| SubSector: Specialty Retail, Other | |
| MarketCap: 23152.3 Millions | |
| Recent Price: 51.18 Smart Investing & Trading Score: 68 | |
| Day Percent Change: -0.14% Day Change: -0.07 | |
| Week Change: 1.57% Year-to-date Change: 17.3% | |
| EBAY Links: Profile News Message Board | |
| Charts:- Daily , Weekly | |
| Add EBAY to Watchlist: View: Get EBAY Trend Analysis ➞ | |
 | MA Mastercard Incorporated |
| Sector: Financials | |
| SubSector: Credit Services | |
| MarketCap: 234809 Millions | |
| Recent Price: 462.50 Smart Investing & Trading Score: 58 | |
| Day Percent Change: -0.07% Day Change: -0.32 | |
| Week Change: 1.56% Year-to-date Change: 8.4% | |
| MA Links: Profile News Message Board | |
| Charts:- Daily , Weekly | |
| Add MA to Watchlist: View: Get MA Trend Analysis ➞ | |
 | L Loews Corporation |
| Sector: Financials | |
| SubSector: Property & Casualty Insurance | |
| MarketCap: 10768.2 Millions | |
| Recent Price: 76.81 Smart Investing & Trading Score: 81 | |
| Day Percent Change: 0.12% Day Change: 0.09 | |
| Week Change: 1.55% Year-to-date Change: 10.4% | |
| L Links: Profile News Message Board | |
| Charts:- Daily , Weekly | |
| Add L to Watchlist: View: Get L Trend Analysis ➞ | |
 | HII Huntington Ingalls Industries, Inc. |
| Sector: Industrials | |
| SubSector: Aerospace/Defense Products & Services | |
| MarketCap: 7276.11 Millions | |
| Recent Price: 275.84 Smart Investing & Trading Score: 51 | |
| Day Percent Change: 0.50% Day Change: 1.37 | |
| Week Change: 1.54% Year-to-date Change: 6.2% | |
| HII Links: Profile News Message Board | |
| Charts:- Daily , Weekly | |
| Add HII to Watchlist: View: Get HII Trend Analysis ➞ | |
 | AMGN Amgen Inc. |
| Sector: Health Care | |
| SubSector: Biotechnology | |
| MarketCap: 121030 Millions | |
| Recent Price: 273.01 Smart Investing & Trading Score: 64 | |
| Day Percent Change: -0.19% Day Change: -0.53 | |
| Week Change: 1.52% Year-to-date Change: -5.2% | |
| AMGN Links: Profile News Message Board | |
| Charts:- Daily , Weekly | |
| Add AMGN to Watchlist: View: Get AMGN Trend Analysis ➞ | |
 | FOX Twenty-First Century Fox, Inc. |
| Sector: Services & Goods | |
| SubSector: Entertainment - Diversified | |
| MarketCap: 24211.2 Millions | |
| Recent Price: 29.31 Smart Investing & Trading Score: 74 | |
| Day Percent Change: 0.45% Day Change: 0.13 | |
| Week Change: 1.52% Year-to-date Change: 6.0% | |
| FOX Links: Profile News Message Board | |
| Charts:- Daily , Weekly | |
| Add FOX to Watchlist: View: Get FOX Trend Analysis ➞ | |
 | SBAC SBA Communications Corporation |
| Sector: Technology | |
| SubSector: Diversified Communication Services | |
| MarketCap: 26712.3 Millions | |
| Recent Price: 199.00 Smart Investing & Trading Score: 35 | |
| Day Percent Change: 0.35% Day Change: 0.70 | |
| Week Change: 1.5% Year-to-date Change: -21.6% | |
| SBAC Links: Profile News Message Board | |
| Charts:- Daily , Weekly | |
| Add SBAC to Watchlist: View: Get SBAC Trend Analysis ➞ | |
 | GNRC Generac Holdings Inc. |
| Sector: Industrials | |
| SubSector: Diversified Machinery | |
| MarketCap: 5736.26 Millions | |
| Recent Price: 137.18 Smart Investing & Trading Score: 100 | |
| Day Percent Change: 0.79% Day Change: 1.08 | |
| Week Change: 1.5% Year-to-date Change: 6.1% | |
| GNRC Links: Profile News Message Board | |
| Charts:- Daily , Weekly | |
| Add GNRC to Watchlist: View: Get GNRC Trend Analysis ➞ | |
 | JCI Johnson Controls International plc |
| Sector: Consumer Staples | |
| SubSector: Auto Parts | |
| MarketCap: 21950.7 Millions | |
| Recent Price: 64.61 Smart Investing & Trading Score: 61 | |
| Day Percent Change: -0.86% Day Change: -0.56 | |
| Week Change: 1.49% Year-to-date Change: 12.1% | |
| JCI Links: Profile News Message Board | |
| Charts:- Daily , Weekly | |
| Add JCI to Watchlist: View: Get JCI Trend Analysis ➞ | |
 | NVR NVR, Inc. |
| Sector: Industrials | |
| SubSector: Residential Construction | |
| MarketCap: 9912.56 Millions | |
| Recent Price: 7798.28 Smart Investing & Trading Score: 63 | |
| Day Percent Change: -0.47% Day Change: -36.83 | |
| Week Change: 1.47% Year-to-date Change: 11.4% | |
| NVR Links: Profile News Message Board | |
| Charts:- Daily , Weekly | |
| Add NVR to Watchlist: View: Get NVR Trend Analysis ➞ | |
 | ZBH Zimmer Biomet Holdings, Inc. |
| Sector: Health Care | |
| SubSector: Medical Appliances & Equipment | |
| MarketCap: 19339.4 Millions | |
| Recent Price: 121.17 Smart Investing & Trading Score: 37 | |
| Day Percent Change: -0.29% Day Change: -0.35 | |
| Week Change: 1.46% Year-to-date Change: -0.4% | |
| ZBH Links: Profile News Message Board | |
| Charts:- Daily , Weekly | |
| Add ZBH to Watchlist: View: Get ZBH Trend Analysis ➞ | |
 | CARR Carrier Global Corporation |
| Sector: Industrials | |
| SubSector: Building Products & Equipment | |
| MarketCap: 32547 Millions | |
| Recent Price: 54.77 Smart Investing & Trading Score: 45 | |
| Day Percent Change: -0.67% Day Change: -0.37 | |
| Week Change: 1.43% Year-to-date Change: -4.7% | |
| CARR Links: Profile News Message Board | |
| Charts:- Daily , Weekly | |
| Add CARR to Watchlist: View: Get CARR Trend Analysis ➞ | |
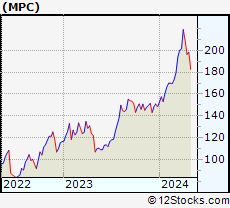 | MPC Marathon Petroleum Corporation |
| Sector: Energy | |
| SubSector: Oil & Gas Refining & Marketing | |
| MarketCap: 16862.4 Millions | |
| Recent Price: 199.14 Smart Investing & Trading Score: 68 | |
| Day Percent Change: -0.26% Day Change: -0.51 | |
| Week Change: 1.41% Year-to-date Change: 34.2% | |
| MPC Links: Profile News Message Board | |
| Charts:- Daily , Weekly | |
| Add MPC to Watchlist: View: Get MPC Trend Analysis ➞ | |
 | IFF International Flavors & Fragrances Inc. |
| Sector: Materials | |
| SubSector: Specialty Chemicals | |
| MarketCap: 12178.7 Millions | |
| Recent Price: 85.14 Smart Investing & Trading Score: 88 | |
| Day Percent Change: -0.34% Day Change: -0.29 | |
| Week Change: 1.39% Year-to-date Change: 5.2% | |
| IFF Links: Profile News Message Board | |
| Charts:- Daily , Weekly | |
| Add IFF to Watchlist: View: Get IFF Trend Analysis ➞ | |
 | IBM International Business Machines Corporation |
| Sector: Technology | |
| SubSector: Information Technology Services | |
| MarketCap: 97241.6 Millions | |
| Recent Price: 184.10 Smart Investing & Trading Score: 45 | |
| Day Percent Change: 1.05% Day Change: 1.91 | |
| Week Change: 1.39% Year-to-date Change: 12.6% | |
| IBM Links: Profile News Message Board | |
| Charts:- Daily , Weekly | |
| Add IBM to Watchlist: View: Get IBM Trend Analysis ➞ | |
 | FSLR First Solar, Inc. |
| Sector: Technology | |
| SubSector: Semiconductor - Specialized | |
| MarketCap: 3617.9 Millions | |
| Recent Price: 177.48 Smart Investing & Trading Score: 71 | |
| Day Percent Change: -1.45% Day Change: -2.62 | |
| Week Change: 1.39% Year-to-date Change: 3.0% | |
| FSLR Links: Profile News Message Board | |
| Charts:- Daily , Weekly | |
| Add FSLR to Watchlist: View: Get FSLR Trend Analysis ➞ | |
 | CNC Centene Corporation |
| Sector: Health Care | |
| SubSector: Health Care Plans | |
| MarketCap: 29075 Millions | |
| Recent Price: 76.19 Smart Investing & Trading Score: 93 | |
| Day Percent Change: 0.46% Day Change: 0.35 | |
| Week Change: 1.38% Year-to-date Change: 2.7% | |
| CNC Links: Profile News Message Board | |
| Charts:- Daily , Weekly | |
| Add CNC to Watchlist: View: Get CNC Trend Analysis ➞ | |
 | XRAY DENTSPLY SIRONA Inc. |
| Sector: Health Care | |
| SubSector: Medical Instruments & Supplies | |
| MarketCap: 7746.1 Millions | |
| Recent Price: 30.92 Smart Investing & Trading Score: 32 | |
| Day Percent Change: 0.19% Day Change: 0.06 | |
| Week Change: 1.38% Year-to-date Change: -13.1% | |
| XRAY Links: Profile News Message Board | |
| Charts:- Daily , Weekly | |
| Add XRAY to Watchlist: View: Get XRAY Trend Analysis ➞ | |
| For tabular summary view of above stock list: Summary View ➞ 0 - 25 , 25 - 50 , 50 - 75 , 75 - 100 , 100 - 125 , 125 - 150 , 150 - 175 , 175 - 200 , 200 - 225 , 225 - 250 , 250 - 275 , 275 - 300 , 300 - 325 , 325 - 350 , 350 - 375 , 375 - 400 , 400 - 425 , 425 - 450 , 450 - 475 , 475 - 500 | ||
| Click To Change The Sort Order: By Market Cap or Company Size Performance: Year-to-date, Week and Day | |
| Select Chart Type: | ||
|
Best Stocks Today 12Stocks.com |
© 2024 12Stocks.com Terms & Conditions Privacy Contact Us
All Information Provided Only For Education And Not To Be Used For Investing or Trading. See Terms & Conditions


One More Thing ... Get Best Stocks Delivered Daily!
Never Ever Miss A Move With Our Top Ten Stocks Lists
Find Best Stocks In Any Market - Bull or Bear Market
Take A Peek At Our Top Ten Stocks Lists: Daily, Weekly, Year-to-Date & Top Trends
Find Best Stocks In Any Market - Bull or Bear Market
Take A Peek At Our Top Ten Stocks Lists: Daily, Weekly, Year-to-Date & Top Trends
S&P 500 Stocks With Best Up Trends [0-bearish to 100-bullish]: Hasbro [100], Wabtec [100], Boston Scientific[100], Texas Instruments[100], Microchip [100], Synchrony Financial[100], EQT [100], PepsiCo [100], Analog Devices[100], Equity Residential[100], Essex Property[100]
Best S&P 500 Stocks Year-to-Date:
NVIDIA [60.89%], Constellation [59.4%], NRG [40.44%], Meta Platforms[39.4%], Targa Resources[34.57%], Marathon [34.23%], Progressive [33.22%], Western Digital[32.81%], Eaton [32.38%], Diamondback [32.34%], Micron [30.98%] Best S&P 500 Stocks This Week:
Globe Life[17.77%], Hasbro [17.66%], Wabtec [13.32%], Microchip [11.02%], Tesla [10.26%], Texas Instruments[9.48%], NXP Semiconductors[9.26%], CoStar [9.13%], Kimberly-Clark [8.63%], Monolithic Power[8.57%], Synchrony Financial[8.3%] Best S&P 500 Stocks Daily:
Tesla [12.06%], Hasbro [11.85%], Wabtec [10.04%], CoStar [8.66%], ON Semiconductor[6.24%], Boston Scientific[5.68%], Texas Instruments[5.64%], Microchip [5.21%], Monolithic Power[5.04%], Synchrony Financial[5.04%], Biogen [4.56%]