
 Login Sign Up


| |||||
 |  | ||||

| 12Stocks.com Market Intelligence |
Best S&P 500 Stocks
|
On this page, you will find the most comprehensive analysis of S&P 500 stocks and ETFs - from latest trends to performances to charts ➞. First, here are the year-to-date (YTD) performances of the most requested S&P 500 stocks at 12Stocks.com (click stock for review):
| NVIDIA 61% | ||
| Caterpillar 23% | ||
| Merck 16% | ||
| Amazon.com 16% | ||
| Walmart 14% | ||
| Google 14% | ||
| JPMorgan Chase 14% | ||
| Chevron 10% | ||
| Goldman Sachs 10% | ||
| Microsoft 9% | ||
| Johnson & Johnson -5% | ||
| McDonald s -7% | ||
| Starbucks -8% | ||
| Apple -12% | ||
| Gilead -17% | ||
| Intel -31% | ||
| Boeing -37% | ||
| Quick: S&P 500 Stocks Lists: Performances & Trends, S&P 500 Stock Charts
Sort S&P 500 stocks: Daily, Weekly, Year-to-Date, Market Cap & Trends. Filter S&P 500 stocks list by sector: Show all, Tech, Finance, Energy, Staples, Retail, Industrial, Materials, Utilities and HealthCare |
| 12Stocks.com S&P 500 Stocks Performances & Trends Daily Report | |||||||||
|
| 
The overall Smart Investing & Trading Score is 58 (0-bearish to 100-bullish) which puts S&P 500 index in short term neutral trend. The Smart Investing & Trading Score from previous trading session is 51 and an improvement of trend continues. | ||||||||
Here are the Smart Investing & Trading Scores of the most requested S&P 500 stocks at 12Stocks.com (click stock name for detailed review):
|


| 12Stocks.com: Top Performing S&P 500 Index Stocks | ||||||||||||||||||||||||||||||||||||||||||||||||
 The top performing S&P 500 Index stocks year to date are
Now, more recently, over last week, the top performing S&P 500 Index stocks on the move are


|
||||||||||||||||||||||||||||||||||||||||||||||||
| 12Stocks.com: Investing in S&P 500 Index with Stocks | |
|
The following table helps investors and traders sort through current performance and trends (as measured by Smart Investing & Trading Score) of various
stocks in the S&P 500 Index. Quick View: Move mouse or cursor over stock symbol (ticker) to view short-term technical chart and over stock name to view long term chart. Click on  to add stock symbol to your watchlist and to add stock symbol to your watchlist and  to view watchlist. Click on any ticker or stock name for detailed market intelligence report for that stock. to view watchlist. Click on any ticker or stock name for detailed market intelligence report for that stock. |
12Stocks.com Performance of Stocks in S&P 500 Index
| Ticker | Stock Name | Watchlist | Category | Recent Price | Smart Investing & Trading Score | Change % | Weekly Change% |
| UPS | United Parcel |   | Transports | 146.62 | 78 | -1.51% | 2.70% |
| CPT | Camden Property | | Financials | 98.86 | 93 | 0.26% | 2.67% |
| TRMB | Trimble | | Technology | 59.51 | 68 | -0.30% | 2.66% |
| KDP | Keurig Dr | | Consumer Staples | 32.34 | 80 | 1.83% | 2.63% |
| LEN | Lennar | | Industrials | 154.12 | 58 | -1.01% | 2.62% |
| MKC | McCormick & | | Consumer Staples | 75.85 | 88 | 1.11% | 2.61% |
| WELL | Welltower | | Financials | 93.70 | 80 | 0.83% | 2.61% |
| ADBE | Adobe | | Technology | 477.12 | 42 | 0.89% | 2.60% |
| NOC | Northrop Grumman | | Industrials | 474.57 | 100 | -0.02% | 2.59% |
| BWA | BorgWarner | | Consumer Staples | 33.65 | 47 | 0.93% | 2.59% |
| AEP | American Electric | | Utilities | 86.37 | 100 | 0.95% | 2.58% |
| META | Meta Platforms | | Technology | 493.50 | 56 | -0.49% | 2.58% |
| CTRA | Contura | | Materials | 28.46 | 88 | 1.17% | 2.56% |
| PAYC | Paycom Software | | Technology | 187.91 | 35 | -0.10% | 2.54% |
| APTV | Aptiv | | Consumer Staples | 71.40 | 17 | 1.64% | 2.54% |
| PAYX | Paychex | | Services & Goods | 122.52 | 73 | 0.74% | 2.51% |
| UAL | United Airlines | | Transports | 52.67 | 83 | -2.52% | 2.51% |
| CAT | Caterpillar | | Industrials | 363.52 | 68 | 0.07% | 2.50% |
| MSFT | Microsoft | | Technology | 409.06 | 58 | 0.37% | 2.49% |
| HRL | Hormel Foods | | Consumer Staples | 35.60 | 95 | 1.31% | 2.48% |
| SO | Southern | | Utilities | 73.91 | 100 | 0.90% | 2.44% |
| AAPL | Apple | | Technology | 169.02 | 50 | 1.27% | 2.44% |
| IT | Gartner | | Technology | 451.06 | 32 | 0.18% | 2.43% |
| ABNB | Airbnb | | Technology | 162.88 | 71 | 1.20% | 2.42% |
| SCHW | Charles Schwab | | Financials | 75.19 | 100 | -0.05% | 2.41% |
| For chart view version of above stock list: Chart View ➞ 0 - 25 , 25 - 50 , 50 - 75 , 75 - 100 , 100 - 125 , 125 - 150 , 150 - 175 , 175 - 200 , 200 - 225 , 225 - 250 , 250 - 275 , 275 - 300 , 300 - 325 , 325 - 350 , 350 - 375 , 375 - 400 , 400 - 425 , 425 - 450 , 450 - 475 , 475 - 500 | ||
 | Click To Change The Sort Order: By Market Cap or Company Size Performance: Year-to-date, Week and Day |  |
|
Get the most comprehensive stock market coverage daily at 12Stocks.com ➞ Best Stocks Today ➞ Best Stocks Weekly ➞ Best Stocks Year-to-Date ➞ Best Stocks Trends ➞  Best Stocks Today 12Stocks.com Best Nasdaq Stocks ➞ Best S&P 500 Stocks ➞ Best Tech Stocks ➞ Best Biotech Stocks ➞ |
| Detailed Overview of S&P 500 Stocks |
| S&P 500 Technical Overview, Leaders & Laggards, Top S&P 500 ETF Funds & Detailed S&P 500 Stocks List, Charts, Trends & More |
| S&P 500: Technical Analysis, Trends & YTD Performance | |
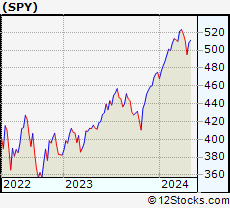
| S&P 500 index as represented by
SPY, an exchange-traded fund [ETF], holds basket of five hundred (mostly largecap) stocks from across all major sectors of the US stock market. The S&P 500 index (contains stocks like Apple and Exxon) is up by 6.33% and is currently outperforming the overall market by 0.67% year-to-date. Below is a quick view of technical charts and trends: | |
 SPY Weekly Chart |
|
| Long Term Trend: Good | |
| Medium Term Trend: Not Good | |
 SPY Daily Chart |
|
| Short Term Trend: Very Good | |
| Overall Trend Score: 58 | |
| YTD Performance: 6.33% | |
| **Trend Scores & Views Are Only For Educational Purposes And Not For Investing | |
| 12Stocks.com: Investing in S&P 500 Index using Exchange Traded Funds | |
|
The following table shows list of key exchange traded funds (ETF) that
help investors track S&P 500 index. The following list also includes leveraged ETF funds that track twice or thrice the daily returns of S&P 500 indices. Short or inverse ETF funds move in the opposite direction to the index they track and are useful during market pullbacks or during bear markets. Quick View: Move mouse or cursor over ETF symbol (ticker) to view short-term technical chart and over ETF name to view long term chart. Click on ticker or stock name for detailed view. Click on to add stock symbol to your watchlist and to view watchlist. |
12Stocks.com List of ETFs that track S&P 500 Index
| Ticker | ETF Name | Watchlist | Recent Price | Smart Investing & Trading Score | Change % | Week % | Year-to-date % |
| SPY | SPDR S&P 500 ETF | | 505.41 | 58 | -0.05 | 2.07 | 6.33% |
| IVV | iShares Core S&P 500 ETF | | 507.97 | 63 | -0.04 | 2.1 | 6.35% |
| VOO | Vanguard 500 ETF | | 464.50 | 63 | -0.07 | 2.07 | 6.34% |
| OEF | iShares S&P 100 | | 239.79 | 58 | -0.07 | 2.18 | 7.34% |
| SSO | ProShares Ultra S&P500 | | 71.95 | 58 | -0.12 | 4.11 | 10.57% |
| UPRO | ProShares UltraPro S&P500 | | 62.88 | 58 | -0.08 | 6.29 | 14.87% |
| SPXL | Direxion Daily S&P500 Bull 3X ETF | | 119.35 | 63 | -0.13 | 6.04 | 14.77% |
| SH | ProShares Short S&P500 | | 12.33 | 42 | -0.08 | -2.07 | -5.08% |
| SDS | ProShares UltraShort S&P500 | | 26.80 | 42 | 0.07 | -3.94 | -10.43% |
| SPXU | ProShares UltraPro Short S&P500 | | 36.04 | 42 | 0.14 | -5.97 | -16.19% |
| SPXS | Direxion Daily S&P 500 Bear 3X ETF | | 9.75 | 32 | 0.00 | -5.89 | -15.58% |
| 12Stocks.com: Charts, Trends, Fundamental Data and Performances of S&P 500 Stocks | |
|
We now take in-depth look at all S&P 500 stocks including charts, multi-period performances and overall trends (as measured by Smart Investing & Trading Score). One can sort S&P 500 stocks (click link to choose) by Daily, Weekly and by Year-to-Date performances. Also, one can sort by size of the company or by market capitalization. |
| Select Your Default Chart Type: | |||||
| |||||
| Click on stock symbol or name for detailed view. Click on to add stock symbol to your watchlist and to view watchlist. Quick View: Move mouse or cursor over "Daily" to quickly view daily technical stock chart and over "Weekly" to view weekly technical stock chart. | |||||

 | UPS United Parcel Service, Inc. |
| Sector: Transports | |
| SubSector: Air Delivery & Freight Services | |
| MarketCap: 81928.9 Millions | |
| Recent Price: 146.62 Smart Investing & Trading Score: 78 | |
| Day Percent Change: -1.51% Day Change: -2.25 | |
| Week Change: 2.7% Year-to-date Change: -6.8% | |
| UPS Links: Profile News Message Board | |
| Charts:- Daily , Weekly | |
| Add UPS to Watchlist: View: Get UPS Trend Analysis ➞ | |
 | CPT Camden Property Trust |
| Sector: Financials | |
| SubSector: REIT - Residential | |
| MarketCap: 7535.21 Millions | |
| Recent Price: 98.86 Smart Investing & Trading Score: 93 | |
| Day Percent Change: 0.26% Day Change: 0.26 | |
| Week Change: 2.67% Year-to-date Change: -0.4% | |
| CPT Links: Profile News Message Board | |
| Charts:- Daily , Weekly | |
| Add CPT to Watchlist: View: Get CPT Trend Analysis ➞ | |
 | TRMB Trimble Inc. |
| Sector: Technology | |
| SubSector: Scientific & Technical Instruments | |
| MarketCap: 7990.33 Millions | |
| Recent Price: 59.51 Smart Investing & Trading Score: 68 | |
| Day Percent Change: -0.30% Day Change: -0.18 | |
| Week Change: 2.66% Year-to-date Change: 11.9% | |
| TRMB Links: Profile News Message Board | |
| Charts:- Daily , Weekly | |
| Add TRMB to Watchlist: View: Get TRMB Trend Analysis ➞ | |
 | KDP Keurig Dr Pepper Inc. |
| Sector: Consumer Staples | |
| SubSector: Beverages - Soft Drinks | |
| MarketCap: 35295.2 Millions | |
| Recent Price: 32.34 Smart Investing & Trading Score: 80 | |
| Day Percent Change: 1.83% Day Change: 0.58 | |
| Week Change: 2.63% Year-to-date Change: -2.9% | |
| KDP Links: Profile News Message Board | |
| Charts:- Daily , Weekly | |
| Add KDP to Watchlist: View: Get KDP Trend Analysis ➞ | |
 | LEN Lennar Corporation |
| Sector: Industrials | |
| SubSector: Residential Construction | |
| MarketCap: 11926.6 Millions | |
| Recent Price: 154.12 Smart Investing & Trading Score: 58 | |
| Day Percent Change: -1.01% Day Change: -1.58 | |
| Week Change: 2.62% Year-to-date Change: 3.4% | |
| LEN Links: Profile News Message Board | |
| Charts:- Daily , Weekly | |
| Add LEN to Watchlist: View: Get LEN Trend Analysis ➞ | |
 | MKC McCormick & Company, Incorporated |
| Sector: Consumer Staples | |
| SubSector: Processed & Packaged Goods | |
| MarketCap: 18522.8 Millions | |
| Recent Price: 75.85 Smart Investing & Trading Score: 88 | |
| Day Percent Change: 1.11% Day Change: 0.83 | |
| Week Change: 2.61% Year-to-date Change: 10.9% | |
| MKC Links: Profile News Message Board | |
| Charts:- Daily , Weekly | |
| Add MKC to Watchlist: View: Get MKC Trend Analysis ➞ | |
 | WELL Welltower Inc. |
| Sector: Financials | |
| SubSector: REIT - Healthcare Facilities | |
| MarketCap: 21398.8 Millions | |
| Recent Price: 93.70 Smart Investing & Trading Score: 80 | |
| Day Percent Change: 0.83% Day Change: 0.77 | |
| Week Change: 2.61% Year-to-date Change: 3.9% | |
| WELL Links: Profile News Message Board | |
| Charts:- Daily , Weekly | |
| Add WELL to Watchlist: View: Get WELL Trend Analysis ➞ | |
 | ADBE Adobe Inc. |
| Sector: Technology | |
| SubSector: Application Software | |
| MarketCap: 157868 Millions | |
| Recent Price: 477.12 Smart Investing & Trading Score: 42 | |
| Day Percent Change: 0.89% Day Change: 4.22 | |
| Week Change: 2.6% Year-to-date Change: -20.0% | |
| ADBE Links: Profile News Message Board | |
| Charts:- Daily , Weekly | |
| Add ADBE to Watchlist: View: Get ADBE Trend Analysis ➞ | |
 | NOC Northrop Grumman Corporation |
| Sector: Industrials | |
| SubSector: Aerospace/Defense - Major Diversified | |
| MarketCap: 52094.9 Millions | |
| Recent Price: 474.57 Smart Investing & Trading Score: 100 | |
| Day Percent Change: -0.02% Day Change: -0.11 | |
| Week Change: 2.59% Year-to-date Change: 1.4% | |
| NOC Links: Profile News Message Board | |
| Charts:- Daily , Weekly | |
| Add NOC to Watchlist: View: Get NOC Trend Analysis ➞ | |
 | BWA BorgWarner Inc. |
| Sector: Consumer Staples | |
| SubSector: Auto Parts | |
| MarketCap: 4604.09 Millions | |
| Recent Price: 33.65 Smart Investing & Trading Score: 47 | |
| Day Percent Change: 0.93% Day Change: 0.31 | |
| Week Change: 2.59% Year-to-date Change: -6.1% | |
| BWA Links: Profile News Message Board | |
| Charts:- Daily , Weekly | |
| Add BWA to Watchlist: View: Get BWA Trend Analysis ➞ | |
 | AEP American Electric Power Company, Inc. |
| Sector: Utilities | |
| SubSector: Electric Utilities | |
| MarketCap: 38380 Millions | |
| Recent Price: 86.37 Smart Investing & Trading Score: 100 | |
| Day Percent Change: 0.95% Day Change: 0.81 | |
| Week Change: 2.58% Year-to-date Change: 6.3% | |
| AEP Links: Profile News Message Board | |
| Charts:- Daily , Weekly | |
| Add AEP to Watchlist: View: Get AEP Trend Analysis ➞ | |
 | META Meta Platforms, Inc. |
| Sector: Technology | |
| SubSector: Internet Content & Information | |
| MarketCap: 732990 Millions | |
| Recent Price: 493.50 Smart Investing & Trading Score: 56 | |
| Day Percent Change: -0.49% Day Change: -2.44 | |
| Week Change: 2.58% Year-to-date Change: 39.4% | |
| META Links: Profile News Message Board | |
| Charts:- Daily , Weekly | |
| Add META to Watchlist: View: Get META Trend Analysis ➞ | |
 | CTRA Contura Energy, Inc. |
| Sector: Materials | |
| SubSector: Industrial Metals & Minerals | |
| MarketCap: 75.291 Millions | |
| Recent Price: 28.46 Smart Investing & Trading Score: 88 | |
| Day Percent Change: 1.17% Day Change: 0.33 | |
| Week Change: 2.56% Year-to-date Change: 11.5% | |
| CTRA Links: Profile News Message Board | |
| Charts:- Daily , Weekly | |
| Add CTRA to Watchlist: View: Get CTRA Trend Analysis ➞ | |
 | PAYC Paycom Software, Inc. |
| Sector: Technology | |
| SubSector: Application Software | |
| MarketCap: 13041.6 Millions | |
| Recent Price: 187.91 Smart Investing & Trading Score: 35 | |
| Day Percent Change: -0.10% Day Change: -0.18 | |
| Week Change: 2.54% Year-to-date Change: -9.1% | |
| PAYC Links: Profile News Message Board | |
| Charts:- Daily , Weekly | |
| Add PAYC to Watchlist: View: Get PAYC Trend Analysis ➞ | |
 | APTV Aptiv PLC |
| Sector: Consumer Staples | |
| SubSector: Auto Parts | |
| MarketCap: 13047.9 Millions | |
| Recent Price: 71.40 Smart Investing & Trading Score: 17 | |
| Day Percent Change: 1.64% Day Change: 1.15 | |
| Week Change: 2.54% Year-to-date Change: -20.4% | |
| APTV Links: Profile News Message Board | |
| Charts:- Daily , Weekly | |
| Add APTV to Watchlist: View: Get APTV Trend Analysis ➞ | |
 | PAYX Paychex, Inc. |
| Sector: Services & Goods | |
| SubSector: Staffing & Outsourcing Services | |
| MarketCap: 20928.8 Millions | |
| Recent Price: 122.52 Smart Investing & Trading Score: 73 | |
| Day Percent Change: 0.74% Day Change: 0.90 | |
| Week Change: 2.51% Year-to-date Change: 2.9% | |
| PAYX Links: Profile News Message Board | |
| Charts:- Daily , Weekly | |
| Add PAYX to Watchlist: View: Get PAYX Trend Analysis ➞ | |
 | UAL United Airlines Holdings, Inc. |
| Sector: Transports | |
| SubSector: Major Airlines | |
| MarketCap: 8083.25 Millions | |
| Recent Price: 52.67 Smart Investing & Trading Score: 83 | |
| Day Percent Change: -2.52% Day Change: -1.36 | |
| Week Change: 2.51% Year-to-date Change: 27.7% | |
| UAL Links: Profile News Message Board | |
| Charts:- Daily , Weekly | |
| Add UAL to Watchlist: View: Get UAL Trend Analysis ➞ | |
 | CAT Caterpillar Inc. |
| Sector: Industrials | |
| SubSector: Farm & Construction Machinery | |
| MarketCap: 58636 Millions | |
| Recent Price: 363.52 Smart Investing & Trading Score: 68 | |
| Day Percent Change: 0.07% Day Change: 0.27 | |
| Week Change: 2.5% Year-to-date Change: 23.0% | |
| CAT Links: Profile News Message Board | |
| Charts:- Daily , Weekly | |
| Add CAT to Watchlist: View: Get CAT Trend Analysis ➞ | |
 | MSFT Microsoft Corporation |
| Sector: Technology | |
| SubSector: Business Software & Services | |
| MarketCap: 1154150 Millions | |
| Recent Price: 409.06 Smart Investing & Trading Score: 58 | |
| Day Percent Change: 0.37% Day Change: 1.49 | |
| Week Change: 2.49% Year-to-date Change: 8.8% | |
| MSFT Links: Profile News Message Board | |
| Charts:- Daily , Weekly | |
| Add MSFT to Watchlist: View: Get MSFT Trend Analysis ➞ | |
 | HRL Hormel Foods Corporation |
| Sector: Consumer Staples | |
| SubSector: Meat Products | |
| MarketCap: 25590.2 Millions | |
| Recent Price: 35.60 Smart Investing & Trading Score: 95 | |
| Day Percent Change: 1.31% Day Change: 0.46 | |
| Week Change: 2.48% Year-to-date Change: 10.9% | |
| HRL Links: Profile News Message Board | |
| Charts:- Daily , Weekly | |
| Add HRL to Watchlist: View: Get HRL Trend Analysis ➞ | |
 | SO The Southern Company |
| Sector: Utilities | |
| SubSector: Electric Utilities | |
| MarketCap: 54483.6 Millions | |
| Recent Price: 73.91 Smart Investing & Trading Score: 100 | |
| Day Percent Change: 0.90% Day Change: 0.66 | |
| Week Change: 2.44% Year-to-date Change: 5.4% | |
| SO Links: Profile News Message Board | |
| Charts:- Daily , Weekly | |
| Add SO to Watchlist: View: Get SO Trend Analysis ➞ | |
 | AAPL Apple Inc. |
| Sector: Technology | |
| SubSector: Electronic Equipment | |
| MarketCap: 1112940 Millions | |
| Recent Price: 169.02 Smart Investing & Trading Score: 50 | |
| Day Percent Change: 1.27% Day Change: 2.12 | |
| Week Change: 2.44% Year-to-date Change: -12.2% | |
| AAPL Links: Profile News Message Board | |
| Charts:- Daily , Weekly | |
| Add AAPL to Watchlist: View: Get AAPL Trend Analysis ➞ | |
 | IT Gartner, Inc. |
| Sector: Technology | |
| SubSector: Information Technology Services | |
| MarketCap: 7767.98 Millions | |
| Recent Price: 451.06 Smart Investing & Trading Score: 32 | |
| Day Percent Change: 0.18% Day Change: 0.80 | |
| Week Change: 2.43% Year-to-date Change: 0.0% | |
| IT Links: Profile News Message Board | |
| Charts:- Daily , Weekly | |
| Add IT to Watchlist: View: Get IT Trend Analysis ➞ | |
 | ABNB Airbnb, Inc. |
| Sector: Technology | |
| SubSector: Internet Content & Information | |
| MarketCap: 86237 Millions | |
| Recent Price: 162.88 Smart Investing & Trading Score: 71 | |
| Day Percent Change: 1.20% Day Change: 1.93 | |
| Week Change: 2.42% Year-to-date Change: 19.6% | |
| ABNB Links: Profile News Message Board | |
| Charts:- Daily , Weekly | |
| Add ABNB to Watchlist: View: Get ABNB Trend Analysis ➞ | |
 | SCHW The Charles Schwab Corporation |
| Sector: Financials | |
| SubSector: Investment Brokerage - National | |
| MarketCap: 45115.8 Millions | |
| Recent Price: 75.19 Smart Investing & Trading Score: 100 | |
| Day Percent Change: -0.05% Day Change: -0.04 | |
| Week Change: 2.41% Year-to-date Change: 9.3% | |
| SCHW Links: Profile News Message Board | |
| Charts:- Daily , Weekly | |
| Add SCHW to Watchlist: View: Get SCHW Trend Analysis ➞ | |
| For tabular summary view of above stock list: Summary View ➞ 0 - 25 , 25 - 50 , 50 - 75 , 75 - 100 , 100 - 125 , 125 - 150 , 150 - 175 , 175 - 200 , 200 - 225 , 225 - 250 , 250 - 275 , 275 - 300 , 300 - 325 , 325 - 350 , 350 - 375 , 375 - 400 , 400 - 425 , 425 - 450 , 450 - 475 , 475 - 500 | ||
| Click To Change The Sort Order: By Market Cap or Company Size Performance: Year-to-date, Week and Day | |
| Select Chart Type: | ||
|
Best Stocks Today 12Stocks.com |
© 2024 12Stocks.com Terms & Conditions Privacy Contact Us
All Information Provided Only For Education And Not To Be Used For Investing or Trading. See Terms & Conditions


One More Thing ... Get Best Stocks Delivered Daily!
Never Ever Miss A Move With Our Top Ten Stocks Lists
Find Best Stocks In Any Market - Bull or Bear Market
Take A Peek At Our Top Ten Stocks Lists: Daily, Weekly, Year-to-Date & Top Trends
Find Best Stocks In Any Market - Bull or Bear Market
Take A Peek At Our Top Ten Stocks Lists: Daily, Weekly, Year-to-Date & Top Trends
S&P 500 Stocks With Best Up Trends [0-bearish to 100-bullish]: Hasbro [100], Wabtec [100], Boston Scientific[100], Texas Instruments[100], Microchip [100], Synchrony Financial[100], EQT [100], PepsiCo [100], Analog Devices[100], Equity Residential[100], Essex Property[100]
Best S&P 500 Stocks Year-to-Date:
NVIDIA [60.89%], Constellation [59.4%], NRG [40.44%], Meta Platforms[39.4%], Targa Resources[34.57%], Marathon [34.23%], Progressive [33.22%], Western Digital[32.81%], Eaton [32.38%], Diamondback [32.34%], Micron [30.98%] Best S&P 500 Stocks This Week:
Globe Life[17.77%], Hasbro [17.66%], Wabtec [13.32%], Microchip [11.02%], Tesla [10.26%], Texas Instruments[9.48%], NXP Semiconductors[9.26%], CoStar [9.13%], Kimberly-Clark [8.63%], Monolithic Power[8.57%], Synchrony Financial[8.3%] Best S&P 500 Stocks Daily:
Tesla [12.06%], Hasbro [11.85%], Wabtec [10.04%], CoStar [8.66%], ON Semiconductor[6.24%], Boston Scientific[5.68%], Texas Instruments[5.64%], Microchip [5.21%], Monolithic Power[5.04%], Synchrony Financial[5.04%], Biogen [4.56%]