
 Login Sign Up


| |||||
 |  | ||||

| 12Stocks.com Market Intelligence |
Best S&P 500 Stocks
|
On this page, you will find the most comprehensive analysis of S&P 500 stocks and ETFs - from latest trends to performances to charts ➞. First, here are the year-to-date (YTD) performances of the most requested S&P 500 stocks at 12Stocks.com (click stock for review):
| NVIDIA 77% | ||
| Google 23% | ||
| Merck 20% | ||
| Amazon.com 18% | ||
| Caterpillar 16% | ||
| Walmart 14% | ||
| JPMorgan Chase 14% | ||
| Chevron 11% | ||
| Goldman Sachs 11% | ||
| Microsoft 8% | ||
| Johnson & Johnson -7% | ||
| McDonald s -8% | ||
| Starbucks -8% | ||
| Apple -12% | ||
| Gilead -19% | ||
| Boeing -36% | ||
| Intel -37% | ||
| Quick: S&P 500 Stocks Lists: Performances & Trends, S&P 500 Stock Charts
Sort S&P 500 stocks: Daily, Weekly, Year-to-Date, Market Cap & Trends. Filter S&P 500 stocks list by sector: Show all, Tech, Finance, Energy, Staples, Retail, Industrial, Materials, Utilities and HealthCare |
| 12Stocks.com S&P 500 Stocks Performances & Trends Daily Report | |||||||||
|
| 
The overall Smart Investing & Trading Score is 63 (0-bearish to 100-bullish) which puts S&P 500 index in short term neutral to bullish trend. The Smart Investing & Trading Score from previous trading session is 44 and hence an improvement of trend. | ||||||||
Here are the Smart Investing & Trading Scores of the most requested S&P 500 stocks at 12Stocks.com (click stock name for detailed review):
|


| 12Stocks.com: Top Performing S&P 500 Index Stocks | ||||||||||||||||||||||||||||||||||||||||||||||||
 The top performing S&P 500 Index stocks year to date are
Now, more recently, over last week, the top performing S&P 500 Index stocks on the move are


|
||||||||||||||||||||||||||||||||||||||||||||||||
| 12Stocks.com: Investing in S&P 500 Index with Stocks | |
|
The following table helps investors and traders sort through current performance and trends (as measured by Smart Investing & Trading Score) of various
stocks in the S&P 500 Index. Quick View: Move mouse or cursor over stock symbol (ticker) to view short-term technical chart and over stock name to view long term chart. Click on  to add stock symbol to your watchlist and to add stock symbol to your watchlist and  to view watchlist. Click on any ticker or stock name for detailed market intelligence report for that stock. to view watchlist. Click on any ticker or stock name for detailed market intelligence report for that stock. |
12Stocks.com Performance of Stocks in S&P 500 Index
| Ticker | Stock Name | Watchlist | Category | Recent Price | Smart Investing & Trading Score | Change % | Weekly Change% |
| FE | First |   | Utilities | 38.13 | 65 | -1.14% | -0.10% |
| PRU | Prudential Financial | | Financials | 110.50 | 48 | -0.61% | -0.10% |
| ADP | Automatic Data | | Technology | 243.07 | 15 | -1.33% | -0.10% |
| AME | AMETEK | | Industrials | 177.51 | 43 | -0.24% | -0.11% |
| LYV | Live Nation | | Services & Goods | 89.83 | 51 | 1.51% | -0.14% |
| REG | Regency Centers | | Financials | 58.28 | 17 | -1.32% | -0.15% |
| EVRG | Evergy | | Utilities | 51.69 | 66 | -1.37% | -0.15% |
| LOW | Lowe s | | Services & Goods | 229.87 | 43 | -0.04% | -0.16% |
| FOX | Twenty-First Century | | Services & Goods | 28.81 | 67 | -1.50% | -0.21% |
| UBER | Uber Technologies | | Technology | 69.05 | 43 | -0.38% | -0.22% |
| ATO | Atmos | | Utilities | 116.93 | 56 | -1.05% | -0.23% |
| DLTR | Dollar Tree | | Services & Goods | 121.74 | 18 | 0.04% | -0.24% |
| DD | DuPont de | | Materials | 73.71 | 61 | 0.29% | -0.24% |
| TEL | TE Connectivity | | Technology | 140.21 | 17 | -0.19% | -0.24% |
| L | Loews | | Financials | 75.46 | 33 | -1.24% | -0.24% |
| ETR | Entergy | | Utilities | 106.50 | 83 | -0.96% | -0.25% |
| STZ | Constellation Brands | | Consumer Staples | 260.04 | 61 | -0.64% | -0.25% |
| TRV | Travelers | | Financials | 213.45 | 51 | -0.25% | -0.29% |
| AEE | Ameren | | Utilities | 73.66 | 71 | -1.47% | -0.30% |
| CMS | CMS | | Utilities | 59.34 | 70 | -1.88% | -0.35% |
| NDAQ | Nasdaq | | Financials | 60.12 | 61 | -0.28% | -0.38% |
| ES | Eversource | | Utilities | 59.46 | 93 | -1.75% | -0.39% |
| JBL | Jabil | | Technology | 118.27 | 10 | -0.18% | -0.40% |
| HON | Honeywell | | Industrials | 193.45 | 17 | 0.22% | -0.42% |
| FDX | FedEx | | Transports | 265.84 | 50 | 0.12% | -0.43% |
| For chart view version of above stock list: Chart View ➞ 0 - 25 , 25 - 50 , 50 - 75 , 75 - 100 , 100 - 125 , 125 - 150 , 150 - 175 , 175 - 200 , 200 - 225 , 225 - 250 , 250 - 275 , 275 - 300 , 300 - 325 , 325 - 350 , 350 - 375 , 375 - 400 , 400 - 425 , 425 - 450 , 450 - 475 , 475 - 500 | ||
 | Click To Change The Sort Order: By Market Cap or Company Size Performance: Year-to-date, Week and Day |  |
|
Get the most comprehensive stock market coverage daily at 12Stocks.com ➞ Best Stocks Today ➞ Best Stocks Weekly ➞ Best Stocks Year-to-Date ➞ Best Stocks Trends ➞  Best Stocks Today 12Stocks.com Best Nasdaq Stocks ➞ Best S&P 500 Stocks ➞ Best Tech Stocks ➞ Best Biotech Stocks ➞ |
| Detailed Overview of S&P 500 Stocks |
| S&P 500 Technical Overview, Leaders & Laggards, Top S&P 500 ETF Funds & Detailed S&P 500 Stocks List, Charts, Trends & More |
| S&P 500: Technical Analysis, Trends & YTD Performance | |
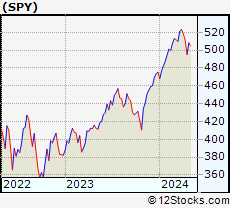
| S&P 500 index as represented by
SPY, an exchange-traded fund [ETF], holds basket of five hundred (mostly largecap) stocks from across all major sectors of the US stock market. The S&P 500 index (contains stocks like Apple and Exxon) is up by 6.93% and is currently outperforming the overall market by 0.79% year-to-date. Below is a quick view of technical charts and trends: | |
 SPY Weekly Chart |
|
| Long Term Trend: Good | |
| Medium Term Trend: Not Good | |
 SPY Daily Chart |
|
| Short Term Trend: Very Good | |
| Overall Trend Score: 63 | |
| YTD Performance: 6.93% | |
| **Trend Scores & Views Are Only For Educational Purposes And Not For Investing | |
| 12Stocks.com: Investing in S&P 500 Index using Exchange Traded Funds | |
|
The following table shows list of key exchange traded funds (ETF) that
help investors track S&P 500 index. The following list also includes leveraged ETF funds that track twice or thrice the daily returns of S&P 500 indices. Short or inverse ETF funds move in the opposite direction to the index they track and are useful during market pullbacks or during bear markets. Quick View: Move mouse or cursor over ETF symbol (ticker) to view short-term technical chart and over ETF name to view long term chart. Click on ticker or stock name for detailed view. Click on to add stock symbol to your watchlist and to view watchlist. |
12Stocks.com List of ETFs that track S&P 500 Index
| Ticker | ETF Name | Watchlist | Recent Price | Smart Investing & Trading Score | Change % | Week % | Year-to-date % |
| SPY | SPDR S&P 500 ETF | | 508.26 | 63 | 0.95 | 2.65 | 6.93% |
| IVV | iShares Core S&P 500 ETF | | 510.77 | 63 | 0.98 | 2.66 | 6.94% |
| VOO | Vanguard 500 ETF | | 467.21 | 63 | 1.00 | 2.66 | 6.96% |
| OEF | iShares S&P 100 | | 241.56 | 63 | 1.35 | 2.93 | 8.13% |
| SSO | ProShares Ultra S&P500 | | 72.71 | 63 | 1.95 | 5.21 | 11.74% |
| UPRO | ProShares UltraPro S&P500 | | 63.82 | 63 | 2.89 | 7.88 | 16.59% |
| SPXL | Direxion Daily S&P500 Bull 3X ETF | | 121.14 | 63 | 2.80 | 7.63 | 16.49% |
| SH | ProShares Short S&P500 | | 12.28 | 42 | -0.89 | -2.46 | -5.47% |
| SDS | ProShares UltraShort S&P500 | | 26.53 | 32 | -1.89 | -4.91 | -11.33% |
| SPXU | ProShares UltraPro Short S&P500 | | 35.50 | 42 | -2.79 | -7.38 | -17.44% |
| SPXS | Direxion Daily S&P 500 Bear 3X ETF | | 9.61 | 25 | -2.73 | -7.24 | -16.8% |
| 12Stocks.com: Charts, Trends, Fundamental Data and Performances of S&P 500 Stocks | |
|
We now take in-depth look at all S&P 500 stocks including charts, multi-period performances and overall trends (as measured by Smart Investing & Trading Score). One can sort S&P 500 stocks (click link to choose) by Daily, Weekly and by Year-to-Date performances. Also, one can sort by size of the company or by market capitalization. |
| Select Your Default Chart Type: | |||||
| |||||
| Click on stock symbol or name for detailed view. Click on to add stock symbol to your watchlist and to view watchlist. Quick View: Move mouse or cursor over "Daily" to quickly view daily technical stock chart and over "Weekly" to view weekly technical stock chart. | |||||

 | FE FirstEnergy Corp. |
| Sector: Utilities | |
| SubSector: Electric Utilities | |
| MarketCap: 20754.1 Millions | |
| Recent Price: 38.13 Smart Investing & Trading Score: 65 | |
| Day Percent Change: -1.14% Day Change: -0.44 | |
| Week Change: -0.1% Year-to-date Change: 4.0% | |
| FE Links: Profile News Message Board | |
| Charts:- Daily , Weekly | |
| Add FE to Watchlist: View: Get FE Trend Analysis ➞ | |
 | PRU Prudential Financial, Inc. |
| Sector: Financials | |
| SubSector: Life Insurance | |
| MarketCap: 21001.6 Millions | |
| Recent Price: 110.50 Smart Investing & Trading Score: 48 | |
| Day Percent Change: -0.61% Day Change: -0.68 | |
| Week Change: -0.1% Year-to-date Change: 6.6% | |
| PRU Links: Profile News Message Board | |
| Charts:- Daily , Weekly | |
| Add PRU to Watchlist: View: Get PRU Trend Analysis ➞ | |
 | ADP Automatic Data Processing, Inc. |
| Sector: Technology | |
| SubSector: Business Software & Services | |
| MarketCap: 54966.5 Millions | |
| Recent Price: 243.07 Smart Investing & Trading Score: 15 | |
| Day Percent Change: -1.33% Day Change: -3.27 | |
| Week Change: -0.1% Year-to-date Change: 4.3% | |
| ADP Links: Profile News Message Board | |
| Charts:- Daily , Weekly | |
| Add ADP to Watchlist: View: Get ADP Trend Analysis ➞ | |
 | AME AMETEK, Inc. |
| Sector: Industrials | |
| SubSector: Diversified Machinery | |
| MarketCap: 16611.8 Millions | |
| Recent Price: 177.51 Smart Investing & Trading Score: 43 | |
| Day Percent Change: -0.24% Day Change: -0.42 | |
| Week Change: -0.11% Year-to-date Change: 7.7% | |
| AME Links: Profile News Message Board | |
| Charts:- Daily , Weekly | |
| Add AME to Watchlist: View: Get AME Trend Analysis ➞ | |
 | LYV Live Nation Entertainment, Inc. |
| Sector: Services & Goods | |
| SubSector: Entertainment - Diversified | |
| MarketCap: 8457.17 Millions | |
| Recent Price: 89.83 Smart Investing & Trading Score: 51 | |
| Day Percent Change: 1.51% Day Change: 1.34 | |
| Week Change: -0.14% Year-to-date Change: -4.0% | |
| LYV Links: Profile News Message Board | |
| Charts:- Daily , Weekly | |
| Add LYV to Watchlist: View: Get LYV Trend Analysis ➞ | |
 | REG Regency Centers Corporation |
| Sector: Financials | |
| SubSector: REIT - Retail | |
| MarketCap: 6345.84 Millions | |
| Recent Price: 58.28 Smart Investing & Trading Score: 17 | |
| Day Percent Change: -1.32% Day Change: -0.78 | |
| Week Change: -0.15% Year-to-date Change: -13.0% | |
| REG Links: Profile News Message Board | |
| Charts:- Daily , Weekly | |
| Add REG to Watchlist: View: Get REG Trend Analysis ➞ | |
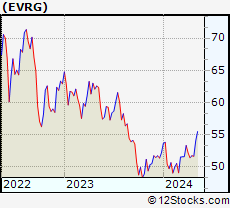 | EVRG Evergy, Inc. |
| Sector: Utilities | |
| SubSector: Electric Utilities | |
| MarketCap: 11914.8 Millions | |
| Recent Price: 51.69 Smart Investing & Trading Score: 66 | |
| Day Percent Change: -1.37% Day Change: -0.72 | |
| Week Change: -0.15% Year-to-date Change: -1.0% | |
| EVRG Links: Profile News Message Board | |
| Charts:- Daily , Weekly | |
| Add EVRG to Watchlist: View: Get EVRG Trend Analysis ➞ | |
 | LOW Lowe s Companies, Inc. |
| Sector: Services & Goods | |
| SubSector: Home Improvement Stores | |
| MarketCap: 56084.2 Millions | |
| Recent Price: 229.87 Smart Investing & Trading Score: 43 | |
| Day Percent Change: -0.04% Day Change: -0.09 | |
| Week Change: -0.16% Year-to-date Change: 3.3% | |
| LOW Links: Profile News Message Board | |
| Charts:- Daily , Weekly | |
| Add LOW to Watchlist: View: Get LOW Trend Analysis ➞ | |
 | FOX Twenty-First Century Fox, Inc. |
| Sector: Services & Goods | |
| SubSector: Entertainment - Diversified | |
| MarketCap: 24211.2 Millions | |
| Recent Price: 28.81 Smart Investing & Trading Score: 67 | |
| Day Percent Change: -1.50% Day Change: -0.44 | |
| Week Change: -0.21% Year-to-date Change: 4.2% | |
| FOX Links: Profile News Message Board | |
| Charts:- Daily , Weekly | |
| Add FOX to Watchlist: View: Get FOX Trend Analysis ➞ | |
 | UBER Uber Technologies, Inc. |
| Sector: Technology | |
| SubSector: Application Software | |
| MarketCap: 42671.2 Millions | |
| Recent Price: 69.05 Smart Investing & Trading Score: 43 | |
| Day Percent Change: -0.38% Day Change: -0.26 | |
| Week Change: -0.22% Year-to-date Change: 12.2% | |
| UBER Links: Profile News Message Board | |
| Charts:- Daily , Weekly | |
| Add UBER to Watchlist: View: Get UBER Trend Analysis ➞ | |
 | ATO Atmos Energy Corporation |
| Sector: Utilities | |
| SubSector: Gas Utilities | |
| MarketCap: 11449 Millions | |
| Recent Price: 116.93 Smart Investing & Trading Score: 56 | |
| Day Percent Change: -1.05% Day Change: -1.24 | |
| Week Change: -0.23% Year-to-date Change: 0.9% | |
| ATO Links: Profile News Message Board | |
| Charts:- Daily , Weekly | |
| Add ATO to Watchlist: View: Get ATO Trend Analysis ➞ | |
 | DLTR Dollar Tree, Inc. |
| Sector: Services & Goods | |
| SubSector: Discount, Variety Stores | |
| MarketCap: 21383.2 Millions | |
| Recent Price: 121.74 Smart Investing & Trading Score: 18 | |
| Day Percent Change: 0.04% Day Change: 0.05 | |
| Week Change: -0.24% Year-to-date Change: -14.3% | |
| DLTR Links: Profile News Message Board | |
| Charts:- Daily , Weekly | |
| Add DLTR to Watchlist: View: Get DLTR Trend Analysis ➞ | |
 | DD DuPont de Nemours, Inc. |
| Sector: Materials | |
| SubSector: Agricultural Chemicals | |
| MarketCap: 25631.6 Millions | |
| Recent Price: 73.71 Smart Investing & Trading Score: 61 | |
| Day Percent Change: 0.29% Day Change: 0.21 | |
| Week Change: -0.24% Year-to-date Change: -4.2% | |
| DD Links: Profile News Message Board | |
| Charts:- Daily , Weekly | |
| Add DD to Watchlist: View: Get DD Trend Analysis ➞ | |
 | TEL TE Connectivity Ltd. |
| Sector: Technology | |
| SubSector: Diversified Electronics | |
| MarketCap: 20044.9 Millions | |
| Recent Price: 140.21 Smart Investing & Trading Score: 17 | |
| Day Percent Change: -0.19% Day Change: -0.27 | |
| Week Change: -0.24% Year-to-date Change: -0.2% | |
| TEL Links: Profile News Message Board | |
| Charts:- Daily , Weekly | |
| Add TEL to Watchlist: View: Get TEL Trend Analysis ➞ | |
 | L Loews Corporation |
| Sector: Financials | |
| SubSector: Property & Casualty Insurance | |
| MarketCap: 10768.2 Millions | |
| Recent Price: 75.46 Smart Investing & Trading Score: 33 | |
| Day Percent Change: -1.24% Day Change: -0.95 | |
| Week Change: -0.24% Year-to-date Change: 8.4% | |
| L Links: Profile News Message Board | |
| Charts:- Daily , Weekly | |
| Add L to Watchlist: View: Get L Trend Analysis ➞ | |
 | ETR Entergy Corporation |
| Sector: Utilities | |
| SubSector: Electric Utilities | |
| MarketCap: 17545 Millions | |
| Recent Price: 106.50 Smart Investing & Trading Score: 83 | |
| Day Percent Change: -0.96% Day Change: -1.03 | |
| Week Change: -0.25% Year-to-date Change: 5.3% | |
| ETR Links: Profile News Message Board | |
| Charts:- Daily , Weekly | |
| Add ETR to Watchlist: View: Get ETR Trend Analysis ➞ | |
 | STZ Constellation Brands, Inc. |
| Sector: Consumer Staples | |
| SubSector: Beverages - Wineries & Distillers | |
| MarketCap: 27394.5 Millions | |
| Recent Price: 260.04 Smart Investing & Trading Score: 61 | |
| Day Percent Change: -0.64% Day Change: -1.67 | |
| Week Change: -0.25% Year-to-date Change: 7.6% | |
| STZ Links: Profile News Message Board | |
| Charts:- Daily , Weekly | |
| Add STZ to Watchlist: View: Get STZ Trend Analysis ➞ | |
 | TRV The Travelers Companies, Inc. |
| Sector: Financials | |
| SubSector: Property & Casualty Insurance | |
| MarketCap: 25155.9 Millions | |
| Recent Price: 213.45 Smart Investing & Trading Score: 51 | |
| Day Percent Change: -0.25% Day Change: -0.54 | |
| Week Change: -0.29% Year-to-date Change: 12.1% | |
| TRV Links: Profile News Message Board | |
| Charts:- Daily , Weekly | |
| Add TRV to Watchlist: View: Get TRV Trend Analysis ➞ | |
 | AEE Ameren Corporation |
| Sector: Utilities | |
| SubSector: Electric Utilities | |
| MarketCap: 17308.2 Millions | |
| Recent Price: 73.66 Smart Investing & Trading Score: 71 | |
| Day Percent Change: -1.47% Day Change: -1.10 | |
| Week Change: -0.3% Year-to-date Change: 1.8% | |
| AEE Links: Profile News Message Board | |
| Charts:- Daily , Weekly | |
| Add AEE to Watchlist: View: Get AEE Trend Analysis ➞ | |
 | CMS CMS Energy Corporation |
| Sector: Utilities | |
| SubSector: Electric Utilities | |
| MarketCap: 15105.8 Millions | |
| Recent Price: 59.34 Smart Investing & Trading Score: 70 | |
| Day Percent Change: -1.88% Day Change: -1.14 | |
| Week Change: -0.35% Year-to-date Change: 2.2% | |
| CMS Links: Profile News Message Board | |
| Charts:- Daily , Weekly | |
| Add CMS to Watchlist: View: Get CMS Trend Analysis ➞ | |
 | NDAQ Nasdaq, Inc. |
| Sector: Financials | |
| SubSector: Diversified Investments | |
| MarketCap: 14885.2 Millions | |
| Recent Price: 60.12 Smart Investing & Trading Score: 61 | |
| Day Percent Change: -0.28% Day Change: -0.17 | |
| Week Change: -0.38% Year-to-date Change: 3.4% | |
| NDAQ Links: Profile News Message Board | |
| Charts:- Daily , Weekly | |
| Add NDAQ to Watchlist: View: Get NDAQ Trend Analysis ➞ | |
 | ES Eversource Energy |
| Sector: Utilities | |
| SubSector: Diversified Utilities | |
| MarketCap: 23963.4 Millions | |
| Recent Price: 59.46 Smart Investing & Trading Score: 93 | |
| Day Percent Change: -1.75% Day Change: -1.06 | |
| Week Change: -0.39% Year-to-date Change: -3.7% | |
| ES Links: Profile News Message Board | |
| Charts:- Daily , Weekly | |
| Add ES to Watchlist: View: Get ES Trend Analysis ➞ | |
 | JBL Jabil Inc. |
| Sector: Technology | |
| SubSector: Printed Circuit Boards | |
| MarketCap: 3272.15 Millions | |
| Recent Price: 118.27 Smart Investing & Trading Score: 10 | |
| Day Percent Change: -0.18% Day Change: -0.21 | |
| Week Change: -0.4% Year-to-date Change: -7.2% | |
| JBL Links: Profile News Message Board | |
| Charts:- Daily , Weekly | |
| Add JBL to Watchlist: View: Get JBL Trend Analysis ➞ | |
 | HON Honeywell International Inc. |
| Sector: Industrials | |
| SubSector: Diversified Machinery | |
| MarketCap: 91189.1 Millions | |
| Recent Price: 193.45 Smart Investing & Trading Score: 17 | |
| Day Percent Change: 0.22% Day Change: 0.43 | |
| Week Change: -0.42% Year-to-date Change: -7.8% | |
| HON Links: Profile News Message Board | |
| Charts:- Daily , Weekly | |
| Add HON to Watchlist: View: Get HON Trend Analysis ➞ | |
 | FDX FedEx Corporation |
| Sector: Transports | |
| SubSector: Air Delivery & Freight Services | |
| MarketCap: 33188 Millions | |
| Recent Price: 265.84 Smart Investing & Trading Score: 50 | |
| Day Percent Change: 0.12% Day Change: 0.32 | |
| Week Change: -0.43% Year-to-date Change: 5.1% | |
| FDX Links: Profile News Message Board | |
| Charts:- Daily , Weekly | |
| Add FDX to Watchlist: View: Get FDX Trend Analysis ➞ | |
| For tabular summary view of above stock list: Summary View ➞ 0 - 25 , 25 - 50 , 50 - 75 , 75 - 100 , 100 - 125 , 125 - 150 , 150 - 175 , 175 - 200 , 200 - 225 , 225 - 250 , 250 - 275 , 275 - 300 , 300 - 325 , 325 - 350 , 350 - 375 , 375 - 400 , 400 - 425 , 425 - 450 , 450 - 475 , 475 - 500 | ||
| Click To Change The Sort Order: By Market Cap or Company Size Performance: Year-to-date, Week and Day | |
| Select Chart Type: | ||
|
Best Stocks Today 12Stocks.com |
© 2024 12Stocks.com Terms & Conditions Privacy Contact Us
All Information Provided Only For Education And Not To Be Used For Investing or Trading. See Terms & Conditions


One More Thing ... Get Best Stocks Delivered Daily!
Never Ever Miss A Move With Our Top Ten Stocks Lists
Find Best Stocks In Any Market - Bull or Bear Market
Take A Peek At Our Top Ten Stocks Lists: Daily, Weekly, Year-to-Date & Top Trends
Find Best Stocks In Any Market - Bull or Bear Market
Take A Peek At Our Top Ten Stocks Lists: Daily, Weekly, Year-to-Date & Top Trends
S&P 500 Stocks With Best Up Trends [0-bearish to 100-bullish]: ResMed [100], Google [100], Google [100], KLA [100], Teradyne [100], Tractor Supply[100], Carrier Global[100], Chipotle Mexican[100], Analog Devices[100], Colgate-Palmolive [100], Goldman Sachs[100]
Best S&P 500 Stocks Year-to-Date:
NVIDIA [77.16%], Constellation [60.86%], NRG [40.83%], Chipotle Mexican[39.35%], Western Digital[36.26%], Eaton [34.66%], Micron [34.57%], Targa Resources[34.52%], Diamondback [33.97%], Marathon [33.72%], Progressive [30.61%] Best S&P 500 Stocks This Week:
ResMed [21.92%], Teradyne [18.92%], Hasbro [16.65%], NVIDIA [15.14%], Microchip [14.59%], Monolithic Power[14.49%], Tesla [14.44%], Tyler Technologies[14.23%], Wabtec [14%], Globe Life[13.5%], NXP Semiconductors[12.82%] Best S&P 500 Stocks Daily:
ResMed [18.89%], Google [10.22%], Google [9.97%], NVIDIA [6.18%], KLA [4.95%], Teradyne [4.79%], T. Rowe[4.77%], Mohawk Industries[4.70%], Broadcom [3.84%], Enphase [3.80%], L3Harris Technologies[3.46%]