
 Login Sign Up


| |||||
 |  | ||||

| 12Stocks.com Market Intelligence |
Best S&P 500 Stocks
|
On this page, you will find the most comprehensive analysis of S&P 500 stocks and ETFs - from latest trends to performances to charts ➞. First, here are the year-to-date (YTD) performances of the most requested S&P 500 stocks at 12Stocks.com (click stock for review):
| NVIDIA 54% | ||
| Caterpillar 20% | ||
| Merck 15% | ||
| Amazon.com 15% | ||
| Walmart 13% | ||
| Google 10% | ||
| JPMorgan Chase 9% | ||
| Chevron 7% | ||
| Microsoft 6% | ||
| Goldman Sachs 5% | ||
| Johnson & Johnson -6% | ||
| McDonald s -8% | ||
| Starbucks -9% | ||
| Apple -14% | ||
| Gilead -18% | ||
| Intel -32% | ||
| Boeing -35% | ||
| Quick: S&P 500 Stocks Lists: Performances & Trends, S&P 500 Stock Charts
Sort S&P 500 stocks: Daily, Weekly, Year-to-Date, Market Cap & Trends. Filter S&P 500 stocks list by sector: Show all, Tech, Finance, Energy, Staples, Retail, Industrial, Materials, Utilities and HealthCare |
| 12Stocks.com S&P 500 Stocks Performances & Trends Daily Report | |||||||||
|
| 
The overall Smart Investing & Trading Score is 26 (0-bearish to 100-bullish) which puts S&P 500 index in short term bearish to neutral trend. The Smart Investing & Trading Score from previous trading session is 36 and hence a deterioration of trend. | ||||||||
Here are the Smart Investing & Trading Scores of the most requested S&P 500 stocks at 12Stocks.com (click stock name for detailed review):
|


| 12Stocks.com: Top Performing S&P 500 Index Stocks | ||||||||||||||||||||||||||||||||||||||||||||||||
 The top performing S&P 500 Index stocks year to date are
Now, more recently, over last week, the top performing S&P 500 Index stocks on the move are


|
||||||||||||||||||||||||||||||||||||||||||||||||
| 12Stocks.com: Investing in S&P 500 Index with Stocks | |
|
The following table helps investors and traders sort through current performance and trends (as measured by Smart Investing & Trading Score) of various
stocks in the S&P 500 Index. Quick View: Move mouse or cursor over stock symbol (ticker) to view short-term technical chart and over stock name to view long term chart. Click on  to add stock symbol to your watchlist and to add stock symbol to your watchlist and  to view watchlist. Click on any ticker or stock name for detailed market intelligence report for that stock. to view watchlist. Click on any ticker or stock name for detailed market intelligence report for that stock. |
12Stocks.com Performance of Stocks in S&P 500 Index
| Ticker | Stock Name | Watchlist | Category | Recent Price | Smart Investing & Trading Score | Change % | Weekly Change% |
| KDP | Keurig Dr |   | Consumer Staples | 31.51 | 87 | 1.22% | 4.27% |
| EL | Estee Lauder | | Consumer Staples | 144.41 | 68 | -0.28% | 4.04% |
| FITB | Fifth Third | | Financials | 36.23 | 68 | 5.86% | 3.92% |
| KMI | Kinder Morgan | | Energy | 18.84 | 100 | 3.46% | 3.92% |
| CNP | CenterPoint | | Utilities | 28.53 | 93 | 2.08% | 3.90% |
| LNT | Alliant | | Utilities | 49.83 | 78 | 2.03% | 3.81% |
| TSN | Tyson Foods | | Consumer Staples | 59.95 | 95 | 1.83% | 3.76% |
| ETR | Entergy | | Utilities | 106.77 | 100 | 2.91% | 3.75% |
| GS | Goldman Sachs | | Financials | 404.00 | 68 | 0.22% | 3.73% |
| ALL | Allstate | | Financials | 172.96 | 76 | 2.28% | 3.69% |
| AFL | Aflac | | Financials | 83.23 | 32 | 2.78% | 3.67% |
| DFS | Discover Financial | | Financials | 125.35 | 68 | 0.87% | 3.67% |
| PEP | PepsiCo | | Consumer Staples | 174.10 | 85 | 1.06% | 3.57% |
| ED | Consolidated Edison | | Utilities | 91.77 | 100 | 0.96% | 3.54% |
| K | Kellogg | | Consumer Staples | 57.38 | 86 | 1.49% | 3.54% |
| DUK | Duke | | Utilities | 98.24 | 100 | 2.41% | 3.52% |
| BAC | Bank of America | | Financials | 36.97 | 68 | 3.35% | 3.30% |
| ACGL | Arch Capital | | Financials | 92.93 | 76 | 1.69% | 3.28% |
| CMS | CMS | | Utilities | 59.55 | 85 | 1.83% | 3.28% |
| WEC | WEC | | Utilities | 81.56 | 86 | 1.39% | 3.28% |
| TSCO | Tractor Supply | | Services & Goods | 252.85 | 68 | 2.22% | 3.25% |
| KO | Coca-Cola | | Consumer Staples | 60.17 | 85 | 2.14% | 3.24% |
| CHD | Church & Dwight Co | | Consumer Staples | 104.35 | 88 | 1.11% | 3.24% |
| SBUX | Starbucks | | Services & Goods | 87.60 | 49 | 0.52% | 3.16% |
| MKC | McCormick & | | Consumer Staples | 73.92 | 73 | 1.68% | 3.01% |
| For chart view version of above stock list: Chart View ➞ 0 - 25 , 25 - 50 , 50 - 75 , 75 - 100 , 100 - 125 , 125 - 150 , 150 - 175 , 175 - 200 , 200 - 225 , 225 - 250 , 250 - 275 , 275 - 300 , 300 - 325 , 325 - 350 , 350 - 375 , 375 - 400 , 400 - 425 , 425 - 450 , 450 - 475 , 475 - 500 | ||
 | Click To Change The Sort Order: By Market Cap or Company Size Performance: Year-to-date, Week and Day |  |
|
Get the most comprehensive stock market coverage daily at 12Stocks.com ➞ Best Stocks Today ➞ Best Stocks Weekly ➞ Best Stocks Year-to-Date ➞ Best Stocks Trends ➞  Best Stocks Today 12Stocks.com Best Nasdaq Stocks ➞ Best S&P 500 Stocks ➞ Best Tech Stocks ➞ Best Biotech Stocks ➞ |
| Detailed Overview of S&P 500 Stocks |
| S&P 500 Technical Overview, Leaders & Laggards, Top S&P 500 ETF Funds & Detailed S&P 500 Stocks List, Charts, Trends & More |
| S&P 500: Technical Analysis, Trends & YTD Performance | |
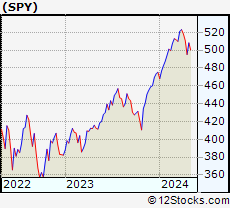
| S&P 500 index as represented by
SPY, an exchange-traded fund [ETF], holds basket of five hundred (mostly largecap) stocks from across all major sectors of the US stock market. The S&P 500 index (contains stocks like Apple and Exxon) is up by 4.18% and is currently outperforming the overall market by 0.8% year-to-date. Below is a quick view of technical charts and trends: | |
 SPY Weekly Chart |
|
| Long Term Trend: Good | |
| Medium Term Trend: Not Good | |
 SPY Daily Chart |
|
| Short Term Trend: Not Good | |
| Overall Trend Score: 26 | |
| YTD Performance: 4.18% | |
| **Trend Scores & Views Are Only For Educational Purposes And Not For Investing | |
| 12Stocks.com: Investing in S&P 500 Index using Exchange Traded Funds | |
|
The following table shows list of key exchange traded funds (ETF) that
help investors track S&P 500 index. The following list also includes leveraged ETF funds that track twice or thrice the daily returns of S&P 500 indices. Short or inverse ETF funds move in the opposite direction to the index they track and are useful during market pullbacks or during bear markets. Quick View: Move mouse or cursor over ETF symbol (ticker) to view short-term technical chart and over ETF name to view long term chart. Click on ticker or stock name for detailed view. Click on to add stock symbol to your watchlist and to view watchlist. |
12Stocks.com List of ETFs that track S&P 500 Index
| Ticker | ETF Name | Watchlist | Recent Price | Smart Investing & Trading Score | Change % | Week % | Year-to-date % |
| SPY | SPDR S&P 500 ETF | | 495.16 | 26 | -0.87 | -3.07 | 4.18% |
| IVV | iShares Core S&P 500 ETF | | 497.53 | 36 | -0.87 | -3.07 | 4.17% |
| VOO | Vanguard 500 ETF | | 455.10 | 36 | -0.84 | -3.08 | 4.19% |
| OEF | iShares S&P 100 | | 234.68 | 26 | -1.24 | -3.48 | 5.05% |
| SSO | ProShares Ultra S&P500 | | 69.11 | 26 | -1.73 | -6.18 | 6.21% |
| UPRO | ProShares UltraPro S&P500 | | 59.16 | 26 | -2.67 | -9.26 | 8.07% |
| SPXL | Direxion Daily S&P500 Bull 3X ETF | | 112.55 | 36 | -2.58 | -9.12 | 8.23% |
| SH | ProShares Short S&P500 | | 12.59 | 74 | 0.96 | 3.28 | -3.08% |
| SDS | ProShares UltraShort S&P500 | | 27.90 | 74 | 1.79 | 6.61 | -6.75% |
| SPXU | ProShares UltraPro Short S&P500 | | 38.33 | 74 | 2.68 | 9.95 | -10.86% |
| SPXS | Direxion Daily S&P 500 Bear 3X ETF | | 10.36 | 49 | 2.47 | 9.98 | -10.3% |
| 12Stocks.com: Charts, Trends, Fundamental Data and Performances of S&P 500 Stocks | |
|
We now take in-depth look at all S&P 500 stocks including charts, multi-period performances and overall trends (as measured by Smart Investing & Trading Score). One can sort S&P 500 stocks (click link to choose) by Daily, Weekly and by Year-to-Date performances. Also, one can sort by size of the company or by market capitalization. |
| Select Your Default Chart Type: | |||||
| |||||
| Click on stock symbol or name for detailed view. Click on to add stock symbol to your watchlist and to view watchlist. Quick View: Move mouse or cursor over "Daily" to quickly view daily technical stock chart and over "Weekly" to view weekly technical stock chart. | |||||

 | KDP Keurig Dr Pepper Inc. |
| Sector: Consumer Staples | |
| SubSector: Beverages - Soft Drinks | |
| MarketCap: 35295.2 Millions | |
| Recent Price: 31.51 Smart Investing & Trading Score: 87 | |
| Day Percent Change: 1.22% Day Change: 0.38 | |
| Week Change: 4.27% Year-to-date Change: -5.4% | |
| KDP Links: Profile News Message Board | |
| Charts:- Daily , Weekly | |
| Add KDP to Watchlist: View: Get KDP Trend Analysis ➞ | |
 | EL The Estee Lauder Companies Inc. |
| Sector: Consumer Staples | |
| SubSector: Personal Products | |
| MarketCap: 59521.1 Millions | |
| Recent Price: 144.41 Smart Investing & Trading Score: 68 | |
| Day Percent Change: -0.28% Day Change: -0.40 | |
| Week Change: 4.04% Year-to-date Change: -1.3% | |
| EL Links: Profile News Message Board | |
| Charts:- Daily , Weekly | |
| Add EL to Watchlist: View: Get EL Trend Analysis ➞ | |
 | FITB Fifth Third Bancorp |
| Sector: Financials | |
| SubSector: Regional - Midwest Banks | |
| MarketCap: 10197 Millions | |
| Recent Price: 36.23 Smart Investing & Trading Score: 68 | |
| Day Percent Change: 5.86% Day Change: 2.01 | |
| Week Change: 3.92% Year-to-date Change: 5.0% | |
| FITB Links: Profile News Message Board | |
| Charts:- Daily , Weekly | |
| Add FITB to Watchlist: View: Get FITB Trend Analysis ➞ | |
 | KMI Kinder Morgan, Inc. |
| Sector: Energy | |
| SubSector: Oil & Gas Pipelines | |
| MarketCap: 31283.5 Millions | |
| Recent Price: 18.84 Smart Investing & Trading Score: 100 | |
| Day Percent Change: 3.46% Day Change: 0.63 | |
| Week Change: 3.92% Year-to-date Change: 6.8% | |
| KMI Links: Profile News Message Board | |
| Charts:- Daily , Weekly | |
| Add KMI to Watchlist: View: Get KMI Trend Analysis ➞ | |
 | CNP CenterPoint Energy, Inc. |
| Sector: Utilities | |
| SubSector: Gas Utilities | |
| MarketCap: 7444.07 Millions | |
| Recent Price: 28.53 Smart Investing & Trading Score: 93 | |
| Day Percent Change: 2.08% Day Change: 0.58 | |
| Week Change: 3.9% Year-to-date Change: -0.1% | |
| CNP Links: Profile News Message Board | |
| Charts:- Daily , Weekly | |
| Add CNP to Watchlist: View: Get CNP Trend Analysis ➞ | |
 | LNT Alliant Energy Corporation |
| Sector: Utilities | |
| SubSector: Electric Utilities | |
| MarketCap: 10678.4 Millions | |
| Recent Price: 49.83 Smart Investing & Trading Score: 78 | |
| Day Percent Change: 2.03% Day Change: 0.99 | |
| Week Change: 3.81% Year-to-date Change: -2.9% | |
| LNT Links: Profile News Message Board | |
| Charts:- Daily , Weekly | |
| Add LNT to Watchlist: View: Get LNT Trend Analysis ➞ | |
 | TSN Tyson Foods, Inc. |
| Sector: Consumer Staples | |
| SubSector: Meat Products | |
| MarketCap: 22124.1 Millions | |
| Recent Price: 59.95 Smart Investing & Trading Score: 95 | |
| Day Percent Change: 1.83% Day Change: 1.08 | |
| Week Change: 3.76% Year-to-date Change: 11.5% | |
| TSN Links: Profile News Message Board | |
| Charts:- Daily , Weekly | |
| Add TSN to Watchlist: View: Get TSN Trend Analysis ➞ | |
 | ETR Entergy Corporation |
| Sector: Utilities | |
| SubSector: Electric Utilities | |
| MarketCap: 17545 Millions | |
| Recent Price: 106.77 Smart Investing & Trading Score: 100 | |
| Day Percent Change: 2.91% Day Change: 3.02 | |
| Week Change: 3.75% Year-to-date Change: 5.5% | |
| ETR Links: Profile News Message Board | |
| Charts:- Daily , Weekly | |
| Add ETR to Watchlist: View: Get ETR Trend Analysis ➞ | |
 | GS The Goldman Sachs Group, Inc. |
| Sector: Financials | |
| SubSector: Investment Brokerage - National | |
| MarketCap: 54579.3 Millions | |
| Recent Price: 404.00 Smart Investing & Trading Score: 68 | |
| Day Percent Change: 0.22% Day Change: 0.89 | |
| Week Change: 3.73% Year-to-date Change: 4.7% | |
| GS Links: Profile News Message Board | |
| Charts:- Daily , Weekly | |
| Add GS to Watchlist: View: Get GS Trend Analysis ➞ | |
 | ALL The Allstate Corporation |
| Sector: Financials | |
| SubSector: Property & Casualty Insurance | |
| MarketCap: 25916.6 Millions | |
| Recent Price: 172.96 Smart Investing & Trading Score: 76 | |
| Day Percent Change: 2.28% Day Change: 3.85 | |
| Week Change: 3.69% Year-to-date Change: 23.6% | |
| ALL Links: Profile News Message Board | |
| Charts:- Daily , Weekly | |
| Add ALL to Watchlist: View: Get ALL Trend Analysis ➞ | |
 | AFL Aflac Incorporated |
| Sector: Financials | |
| SubSector: Accident & Health Insurance | |
| MarketCap: 22706 Millions | |
| Recent Price: 83.23 Smart Investing & Trading Score: 32 | |
| Day Percent Change: 2.78% Day Change: 2.25 | |
| Week Change: 3.67% Year-to-date Change: 0.9% | |
| AFL Links: Profile News Message Board | |
| Charts:- Daily , Weekly | |
| Add AFL to Watchlist: View: Get AFL Trend Analysis ➞ | |
 | DFS Discover Financial Services |
| Sector: Financials | |
| SubSector: Credit Services | |
| MarketCap: 9228.88 Millions | |
| Recent Price: 125.35 Smart Investing & Trading Score: 68 | |
| Day Percent Change: 0.87% Day Change: 1.08 | |
| Week Change: 3.67% Year-to-date Change: 11.5% | |
| DFS Links: Profile News Message Board | |
| Charts:- Daily , Weekly | |
| Add DFS to Watchlist: View: Get DFS Trend Analysis ➞ | |
 | PEP PepsiCo, Inc. |
| Sector: Consumer Staples | |
| SubSector: Beverages - Soft Drinks | |
| MarketCap: 162458 Millions | |
| Recent Price: 174.10 Smart Investing & Trading Score: 85 | |
| Day Percent Change: 1.06% Day Change: 1.83 | |
| Week Change: 3.57% Year-to-date Change: 2.5% | |
| PEP Links: Profile News Message Board | |
| Charts:- Daily , Weekly | |
| Add PEP to Watchlist: View: Get PEP Trend Analysis ➞ | |
 | ED Consolidated Edison, Inc. |
| Sector: Utilities | |
| SubSector: Electric Utilities | |
| MarketCap: 25012.3 Millions | |
| Recent Price: 91.77 Smart Investing & Trading Score: 100 | |
| Day Percent Change: 0.96% Day Change: 0.87 | |
| Week Change: 3.54% Year-to-date Change: 0.9% | |
| ED Links: Profile News Message Board | |
| Charts:- Daily , Weekly | |
| Add ED to Watchlist: View: Get ED Trend Analysis ➞ | |
 | K Kellogg Company |
| Sector: Consumer Staples | |
| SubSector: Processed & Packaged Goods | |
| MarketCap: 20264.6 Millions | |
| Recent Price: 57.38 Smart Investing & Trading Score: 86 | |
| Day Percent Change: 1.49% Day Change: 0.84 | |
| Week Change: 3.54% Year-to-date Change: 2.6% | |
| K Links: Profile News Message Board | |
| Charts:- Daily , Weekly | |
| Add K to Watchlist: View: Get K Trend Analysis ➞ | |
 | DUK Duke Energy Corporation |
| Sector: Utilities | |
| SubSector: Electric Utilities | |
| MarketCap: 56678.2 Millions | |
| Recent Price: 98.24 Smart Investing & Trading Score: 100 | |
| Day Percent Change: 2.41% Day Change: 2.31 | |
| Week Change: 3.52% Year-to-date Change: 1.2% | |
| DUK Links: Profile News Message Board | |
| Charts:- Daily , Weekly | |
| Add DUK to Watchlist: View: Get DUK Trend Analysis ➞ | |
 | BAC Bank of America Corporation |
| Sector: Financials | |
| SubSector: Money Center Banks | |
| MarketCap: 189690 Millions | |
| Recent Price: 36.97 Smart Investing & Trading Score: 68 | |
| Day Percent Change: 3.35% Day Change: 1.20 | |
| Week Change: 3.3% Year-to-date Change: 9.8% | |
| BAC Links: Profile News Message Board | |
| Charts:- Daily , Weekly | |
| Add BAC to Watchlist: View: Get BAC Trend Analysis ➞ | |
 | ACGL Arch Capital Group Ltd. |
| Sector: Financials | |
| SubSector: Property & Casualty Insurance | |
| MarketCap: 12350.9 Millions | |
| Recent Price: 92.93 Smart Investing & Trading Score: 76 | |
| Day Percent Change: 1.69% Day Change: 1.54 | |
| Week Change: 3.28% Year-to-date Change: 25.1% | |
| ACGL Links: Profile News Message Board | |
| Charts:- Daily , Weekly | |
| Add ACGL to Watchlist: View: Get ACGL Trend Analysis ➞ | |
 | CMS CMS Energy Corporation |
| Sector: Utilities | |
| SubSector: Electric Utilities | |
| MarketCap: 15105.8 Millions | |
| Recent Price: 59.55 Smart Investing & Trading Score: 85 | |
| Day Percent Change: 1.83% Day Change: 1.07 | |
| Week Change: 3.28% Year-to-date Change: 2.6% | |
| CMS Links: Profile News Message Board | |
| Charts:- Daily , Weekly | |
| Add CMS to Watchlist: View: Get CMS Trend Analysis ➞ | |
 | WEC WEC Energy Group, Inc. |
| Sector: Utilities | |
| SubSector: Electric Utilities | |
| MarketCap: 24852 Millions | |
| Recent Price: 81.56 Smart Investing & Trading Score: 86 | |
| Day Percent Change: 1.39% Day Change: 1.12 | |
| Week Change: 3.28% Year-to-date Change: -3.1% | |
| WEC Links: Profile News Message Board | |
| Charts:- Daily , Weekly | |
| Add WEC to Watchlist: View: Get WEC Trend Analysis ➞ | |
 | TSCO Tractor Supply Company |
| Sector: Services & Goods | |
| SubSector: Specialty Retail, Other | |
| MarketCap: 9692.94 Millions | |
| Recent Price: 252.85 Smart Investing & Trading Score: 68 | |
| Day Percent Change: 2.22% Day Change: 5.50 | |
| Week Change: 3.25% Year-to-date Change: 17.6% | |
| TSCO Links: Profile News Message Board | |
| Charts:- Daily , Weekly | |
| Add TSCO to Watchlist: View: Get TSCO Trend Analysis ➞ | |
 | KO The Coca-Cola Company |
| Sector: Consumer Staples | |
| SubSector: Beverages - Soft Drinks | |
| MarketCap: 182046 Millions | |
| Recent Price: 60.17 Smart Investing & Trading Score: 85 | |
| Day Percent Change: 2.14% Day Change: 1.26 | |
| Week Change: 3.24% Year-to-date Change: 2.1% | |
| KO Links: Profile News Message Board | |
| Charts:- Daily , Weekly | |
| Add KO to Watchlist: View: Get KO Trend Analysis ➞ | |
 | CHD Church & Dwight Co., Inc. |
| Sector: Consumer Staples | |
| SubSector: Cleaning Products | |
| MarketCap: 17425.7 Millions | |
| Recent Price: 104.35 Smart Investing & Trading Score: 88 | |
| Day Percent Change: 1.11% Day Change: 1.15 | |
| Week Change: 3.24% Year-to-date Change: 10.4% | |
| CHD Links: Profile News Message Board | |
| Charts:- Daily , Weekly | |
| Add CHD to Watchlist: View: Get CHD Trend Analysis ➞ | |
 | SBUX Starbucks Corporation |
| Sector: Services & Goods | |
| SubSector: Specialty Eateries | |
| MarketCap: 74909.7 Millions | |
| Recent Price: 87.60 Smart Investing & Trading Score: 49 | |
| Day Percent Change: 0.52% Day Change: 0.45 | |
| Week Change: 3.16% Year-to-date Change: -8.8% | |
| SBUX Links: Profile News Message Board | |
| Charts:- Daily , Weekly | |
| Add SBUX to Watchlist: View: Get SBUX Trend Analysis ➞ | |
 | MKC McCormick & Company, Incorporated |
| Sector: Consumer Staples | |
| SubSector: Processed & Packaged Goods | |
| MarketCap: 18522.8 Millions | |
| Recent Price: 73.92 Smart Investing & Trading Score: 73 | |
| Day Percent Change: 1.68% Day Change: 1.22 | |
| Week Change: 3.01% Year-to-date Change: 8.0% | |
| MKC Links: Profile News Message Board | |
| Charts:- Daily , Weekly | |
| Add MKC to Watchlist: View: Get MKC Trend Analysis ➞ | |
| For tabular summary view of above stock list: Summary View ➞ 0 - 25 , 25 - 50 , 50 - 75 , 75 - 100 , 100 - 125 , 125 - 150 , 150 - 175 , 175 - 200 , 200 - 225 , 225 - 250 , 250 - 275 , 275 - 300 , 300 - 325 , 325 - 350 , 350 - 375 , 375 - 400 , 400 - 425 , 425 - 450 , 450 - 475 , 475 - 500 | ||
| Click To Change The Sort Order: By Market Cap or Company Size Performance: Year-to-date, Week and Day | |
| Select Chart Type: | ||
|
Best Stocks Today 12Stocks.com |
© 2024 12Stocks.com Terms & Conditions Privacy Contact Us
All Information Provided Only For Education And Not To Be Used For Investing or Trading. See Terms & Conditions


One More Thing ... Get Best Stocks Delivered Daily!
Never Ever Miss A Move With Our Top Ten Stocks Lists
Find Best Stocks In Any Market - Bull or Bear Market
Take A Peek At Our Top Ten Stocks Lists: Daily, Weekly, Year-to-Date & Top Trends
Find Best Stocks In Any Market - Bull or Bear Market
Take A Peek At Our Top Ten Stocks Lists: Daily, Weekly, Year-to-Date & Top Trends
S&P 500 Stocks With Best Up Trends [0-bearish to 100-bullish]: Kinder Morgan[100], Entergy [100], Bunge [100], Philip Morris[100], Wells Fargo[100], Duke [100], General Mills[100], Lockheed Martin[100], Genuine Parts[100], Consolidated Edison[100], Conagra Brands[100]
Best S&P 500 Stocks Year-to-Date:
NVIDIA [53.87%], Constellation [52.26%], Meta Platforms[38.28%], NRG [35.34%], Progressive [34.79%], Marathon [32.37%], Targa Resources[29.99%], Diamondback [29.43%], Western Digital[26.1%], Valero [26.07%], Eaton [25.83%] Best S&P 500 Stocks This Week:
United Airlines[22.94%], UnitedHealth [14.1%], Globe Life[12.95%], Genuine Parts[11.7%], ProShares UltraPro[9.95%], American Airlines[7.22%], Wells Fargo[6.87%], Southwest Airlines[6.68%], M&T Bank[6.55%], General Mills[6.37%], Centene [6.25%] Best S&P 500 Stocks Daily:
American Express[6.23%], Fifth Third[5.86%], Walgreens Boots[3.75%], Kinder Morgan[3.46%], Bank of America[3.35%], Citizens Financial[3.31%], J. M.[3.29%], Truist Financial[3.05%], PNC Financial[2.98%], M&T Bank[2.93%], Entergy [2.91%]