
 Login Sign Up


| |||||
 |  | ||||

| 12Stocks.com Market Intelligence |
Best S&P 500 Stocks
|
On this page, you will find the most comprehensive analysis of S&P 500 stocks and ETFs - from latest trends to performances to charts ➞. First, here are the year-to-date (YTD) performances of the most requested S&P 500 stocks at 12Stocks.com (click stock for review):
| NVIDIA 77% | ||
| Google 23% | ||
| Merck 20% | ||
| Amazon.com 18% | ||
| Caterpillar 16% | ||
| Walmart 14% | ||
| JPMorgan Chase 14% | ||
| Chevron 11% | ||
| Goldman Sachs 11% | ||
| Microsoft 8% | ||
| Johnson & Johnson -7% | ||
| McDonald s -8% | ||
| Starbucks -8% | ||
| Apple -12% | ||
| Gilead -19% | ||
| Boeing -36% | ||
| Intel -37% | ||
| Quick: S&P 500 Stocks Lists: Performances & Trends, S&P 500 Stock Charts
Sort S&P 500 stocks: Daily, Weekly, Year-to-Date, Market Cap & Trends. Filter S&P 500 stocks list by sector: Show all, Tech, Finance, Energy, Staples, Retail, Industrial, Materials, Utilities and HealthCare |
| 12Stocks.com S&P 500 Stocks Performances & Trends Daily Report | |||||||||
|
| 
The overall Smart Investing & Trading Score is 63 (0-bearish to 100-bullish) which puts S&P 500 index in short term neutral to bullish trend. The Smart Investing & Trading Score from previous trading session is 44 and hence an improvement of trend. | ||||||||
Here are the Smart Investing & Trading Scores of the most requested S&P 500 stocks at 12Stocks.com (click stock name for detailed review):
|


| 12Stocks.com: Top Performing S&P 500 Index Stocks | ||||||||||||||||||||||||||||||||||||||||||||||||
 The top performing S&P 500 Index stocks year to date are
Now, more recently, over last week, the top performing S&P 500 Index stocks on the move are


|
||||||||||||||||||||||||||||||||||||||||||||||||
| 12Stocks.com: Investing in S&P 500 Index with Stocks | |
|
The following table helps investors and traders sort through current performance and trends (as measured by Smart Investing & Trading Score) of various
stocks in the S&P 500 Index. Quick View: Move mouse or cursor over stock symbol (ticker) to view short-term technical chart and over stock name to view long term chart. Click on  to add stock symbol to your watchlist and to add stock symbol to your watchlist and  to view watchlist. Click on any ticker or stock name for detailed market intelligence report for that stock. to view watchlist. Click on any ticker or stock name for detailed market intelligence report for that stock. |
12Stocks.com Performance of Stocks in S&P 500 Index
| Ticker | Stock Name | Watchlist | Category | Recent Price | Smart Investing & Trading Score | Change % | YTD Change% |
| SYK | Stryker |   | Health Care | 335.61 | 38 | -0.46% | 12.07% |
| KIM | Kimco Realty | | Financials | 18.38 | 37 | -0.22% | -13.75% |
| HOLX | Hologic | | Health Care | 75.98 | 36 | 0.36% | 6.34% |
| BG | Bunge | | Consumer Staples | 102.73 | 36 | -1.28% | 1.76% |
| FIS | Fidelity National | | Technology | 69.60 | 36 | -1.23% | 15.86% |
| WYNN | Wynn Resorts | | Services & Goods | 95.89 | 36 | -0.73% | 5.25% |
| PCAR | PACCAR Inc | | Consumer Staples | 111.92 | 36 | -0.62% | 14.61% |
| TAP | Molson Coors | | Consumer Staples | 62.54 | 36 | -0.45% | 2.17% |
| LIN | Linde | | Materials | 443.02 | 36 | -0.21% | 7.87% |
| MAS | Masco | | Industrials | 69.85 | 36 | -0.03% | 4.28% |
| BX | Blackstone | | Financials | 122.49 | 35 | -0.71% | -6.44% |
| MOS | Mosaic | | Materials | 30.25 | 35 | -0.10% | -15.34% |
| TECH | Bio-Techne | | Health Care | 64.08 | 35 | 2.26% | -16.96% |
| BA | Boeing | | Industrials | 167.22 | 35 | 0.25% | -35.85% |
| XEL | Xcel | | Utilities | 53.94 | 35 | -1.95% | -12.87% |
| EXR | Extra Space | | Financials | 133.47 | 35 | -0.27% | -16.75% |
| AFL | Aflac | | Financials | 83.61 | 35 | -0.14% | 1.35% |
| AMCR | Amcor | | Consumer Staples | 8.97 | 34 | 0.22% | -6.95% |
| VICI | VICI Properties | | Financials | 28.47 | 34 | -0.28% | -10.70% |
| META | Meta Platforms | | Technology | 444.17 | 33 | 2.54% | 25.47% |
| TXT | Textron | | Industrials | 86.51 | 33 | 1.90% | 7.57% |
| CRL | Charles River | | Health Care | 229.03 | 33 | 0.54% | -3.12% |
| AOS | A. O. | | Industrials | 83.21 | 33 | 0.47% | 0.93% |
| L | Loews | | Financials | 75.46 | 33 | -1.24% | 8.44% |
| AJG | Arthur J. | | Financials | 234.11 | 33 | -1.20% | 4.10% |
| For chart view version of above stock list: Chart View ➞ 0 - 25 , 25 - 50 , 50 - 75 , 75 - 100 , 100 - 125 , 125 - 150 , 150 - 175 , 175 - 200 , 200 - 225 , 225 - 250 , 250 - 275 , 275 - 300 , 300 - 325 , 325 - 350 , 350 - 375 , 375 - 400 , 400 - 425 , 425 - 450 , 450 - 475 , 475 - 500 | ||
 | Click To Change The Sort Order: By Market Cap or Company Size Performance: Year-to-date, Week and Day |  |
|
Get the most comprehensive stock market coverage daily at 12Stocks.com ➞ Best Stocks Today ➞ Best Stocks Weekly ➞ Best Stocks Year-to-Date ➞ Best Stocks Trends ➞  Best Stocks Today 12Stocks.com Best Nasdaq Stocks ➞ Best S&P 500 Stocks ➞ Best Tech Stocks ➞ Best Biotech Stocks ➞ |
| Detailed Overview of S&P 500 Stocks |
| S&P 500 Technical Overview, Leaders & Laggards, Top S&P 500 ETF Funds & Detailed S&P 500 Stocks List, Charts, Trends & More |
| S&P 500: Technical Analysis, Trends & YTD Performance | |
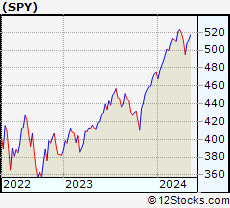
| S&P 500 index as represented by
SPY, an exchange-traded fund [ETF], holds basket of five hundred (mostly largecap) stocks from across all major sectors of the US stock market. The S&P 500 index (contains stocks like Apple and Exxon) is up by 6.93% and is currently outperforming the overall market by 0.79% year-to-date. Below is a quick view of technical charts and trends: | |
 SPY Weekly Chart |
|
| Long Term Trend: Good | |
| Medium Term Trend: Not Good | |
 SPY Daily Chart |
|
| Short Term Trend: Very Good | |
| Overall Trend Score: 63 | |
| YTD Performance: 6.93% | |
| **Trend Scores & Views Are Only For Educational Purposes And Not For Investing | |
| 12Stocks.com: Investing in S&P 500 Index using Exchange Traded Funds | |
|
The following table shows list of key exchange traded funds (ETF) that
help investors track S&P 500 index. The following list also includes leveraged ETF funds that track twice or thrice the daily returns of S&P 500 indices. Short or inverse ETF funds move in the opposite direction to the index they track and are useful during market pullbacks or during bear markets. Quick View: Move mouse or cursor over ETF symbol (ticker) to view short-term technical chart and over ETF name to view long term chart. Click on ticker or stock name for detailed view. Click on to add stock symbol to your watchlist and to view watchlist. |
12Stocks.com List of ETFs that track S&P 500 Index
| Ticker | ETF Name | Watchlist | Recent Price | Smart Investing & Trading Score | Change % | Week % | Year-to-date % |
| SPY | SPDR S&P 500 ETF | | 508.26 | 63 | 0.95 | 2.65 | 6.93% |
| IVV | iShares Core S&P 500 ETF | | 510.77 | 63 | 0.98 | 2.66 | 6.94% |
| VOO | Vanguard 500 ETF | | 467.21 | 63 | 1.00 | 2.66 | 6.96% |
| OEF | iShares S&P 100 | | 241.56 | 63 | 1.35 | 2.93 | 8.13% |
| SSO | ProShares Ultra S&P500 | | 72.71 | 63 | 1.95 | 5.21 | 11.74% |
| UPRO | ProShares UltraPro S&P500 | | 63.82 | 63 | 2.89 | 7.88 | 16.59% |
| SPXL | Direxion Daily S&P500 Bull 3X ETF | | 121.14 | 63 | 2.80 | 7.63 | 16.49% |
| SH | ProShares Short S&P500 | | 12.28 | 42 | -0.89 | -2.46 | -5.47% |
| SDS | ProShares UltraShort S&P500 | | 26.53 | 32 | -1.89 | -4.91 | -11.33% |
| SPXU | ProShares UltraPro Short S&P500 | | 35.50 | 42 | -2.79 | -7.38 | -17.44% |
| SPXS | Direxion Daily S&P 500 Bear 3X ETF | | 9.61 | 25 | -2.73 | -7.24 | -16.8% |
| 12Stocks.com: Charts, Trends, Fundamental Data and Performances of S&P 500 Stocks | |
|
We now take in-depth look at all S&P 500 stocks including charts, multi-period performances and overall trends (as measured by Smart Investing & Trading Score). One can sort S&P 500 stocks (click link to choose) by Daily, Weekly and by Year-to-Date performances. Also, one can sort by size of the company or by market capitalization. |
| Select Your Default Chart Type: | |||||
| |||||
| Click on stock symbol or name for detailed view. Click on to add stock symbol to your watchlist and to view watchlist. Quick View: Move mouse or cursor over "Daily" to quickly view daily technical stock chart and over "Weekly" to view weekly technical stock chart. | |||||

 | SYK Stryker Corporation |
| Sector: Health Care | |
| SubSector: Medical Appliances & Equipment | |
| MarketCap: 59441.3 Millions | |
| Recent Price: 335.61 Smart Investing & Trading Score: 38 | |
| Day Percent Change: -0.46% Day Change: -1.54 | |
| Week Change: 3.13% Year-to-date Change: 12.1% | |
| SYK Links: Profile News Message Board | |
| Charts:- Daily , Weekly | |
| Add SYK to Watchlist: View: Get SYK Trend Analysis ➞ | |
 | KIM Kimco Realty Corporation |
| Sector: Financials | |
| SubSector: REIT - Retail | |
| MarketCap: 5358.64 Millions | |
| Recent Price: 18.38 Smart Investing & Trading Score: 37 | |
| Day Percent Change: -0.22% Day Change: -0.04 | |
| Week Change: 0.99% Year-to-date Change: -13.8% | |
| KIM Links: Profile News Message Board | |
| Charts:- Daily , Weekly | |
| Add KIM to Watchlist: View: Get KIM Trend Analysis ➞ | |
 | HOLX Hologic, Inc. |
| Sector: Health Care | |
| SubSector: Medical Instruments & Supplies | |
| MarketCap: 9075.2 Millions | |
| Recent Price: 75.98 Smart Investing & Trading Score: 36 | |
| Day Percent Change: 0.36% Day Change: 0.27 | |
| Week Change: 0.8% Year-to-date Change: 6.3% | |
| HOLX Links: Profile News Message Board | |
| Charts:- Daily , Weekly | |
| Add HOLX to Watchlist: View: Get HOLX Trend Analysis ➞ | |
 | BG Bunge Limited |
| Sector: Consumer Staples | |
| SubSector: Farm Products | |
| MarketCap: 4975.77 Millions | |
| Recent Price: 102.73 Smart Investing & Trading Score: 36 | |
| Day Percent Change: -1.28% Day Change: -1.33 | |
| Week Change: -6.2% Year-to-date Change: 1.8% | |
| BG Links: Profile News Message Board | |
| Charts:- Daily , Weekly | |
| Add BG to Watchlist: View: Get BG Trend Analysis ➞ | |
 | FIS Fidelity National Information Services, Inc. |
| Sector: Technology | |
| SubSector: Information Technology Services | |
| MarketCap: 71126.8 Millions | |
| Recent Price: 69.60 Smart Investing & Trading Score: 36 | |
| Day Percent Change: -1.23% Day Change: -0.87 | |
| Week Change: -1.6% Year-to-date Change: 15.9% | |
| FIS Links: Profile News Message Board | |
| Charts:- Daily , Weekly | |
| Add FIS to Watchlist: View: Get FIS Trend Analysis ➞ | |
 | WYNN Wynn Resorts, Limited |
| Sector: Services & Goods | |
| SubSector: Resorts & Casinos | |
| MarketCap: 6643.34 Millions | |
| Recent Price: 95.89 Smart Investing & Trading Score: 36 | |
| Day Percent Change: -0.73% Day Change: -0.71 | |
| Week Change: 0.95% Year-to-date Change: 5.3% | |
| WYNN Links: Profile News Message Board | |
| Charts:- Daily , Weekly | |
| Add WYNN to Watchlist: View: Get WYNN Trend Analysis ➞ | |
 | PCAR PACCAR Inc |
| Sector: Consumer Staples | |
| SubSector: Trucks & Other Vehicles | |
| MarketCap: 19117.7 Millions | |
| Recent Price: 111.92 Smart Investing & Trading Score: 36 | |
| Day Percent Change: -0.62% Day Change: -0.70 | |
| Week Change: 0.66% Year-to-date Change: 14.6% | |
| PCAR Links: Profile News Message Board | |
| Charts:- Daily , Weekly | |
| Add PCAR to Watchlist: View: Get PCAR Trend Analysis ➞ | |
 | TAP Molson Coors Beverage Company |
| Sector: Consumer Staples | |
| SubSector: Beverages - Brewers | |
| MarketCap: 8619.97 Millions | |
| Recent Price: 62.54 Smart Investing & Trading Score: 36 | |
| Day Percent Change: -0.45% Day Change: -0.28 | |
| Week Change: -2.63% Year-to-date Change: 2.2% | |
| TAP Links: Profile News Message Board | |
| Charts:- Daily , Weekly | |
| Add TAP to Watchlist: View: Get TAP Trend Analysis ➞ | |
 | LIN Linde plc |
| Sector: Materials | |
| SubSector: Specialty Chemicals | |
| MarketCap: 88539.2 Millions | |
| Recent Price: 443.02 Smart Investing & Trading Score: 36 | |
| Day Percent Change: -0.21% Day Change: -0.95 | |
| Week Change: -0.74% Year-to-date Change: 7.9% | |
| LIN Links: Profile News Message Board | |
| Charts:- Daily , Weekly | |
| Add LIN to Watchlist: View: Get LIN Trend Analysis ➞ | |
 | MAS Masco Corporation |
| Sector: Industrials | |
| SubSector: General Building Materials | |
| MarketCap: 8655.63 Millions | |
| Recent Price: 69.85 Smart Investing & Trading Score: 36 | |
| Day Percent Change: -0.03% Day Change: -0.02 | |
| Week Change: -2.86% Year-to-date Change: 4.3% | |
| MAS Links: Profile News Message Board | |
| Charts:- Daily , Weekly | |
| Add MAS to Watchlist: View: Get MAS Trend Analysis ➞ | |
 | BX The Blackstone Group Inc. |
| Sector: Financials | |
| SubSector: Asset Management | |
| MarketCap: 50957.7 Millions | |
| Recent Price: 122.49 Smart Investing & Trading Score: 35 | |
| Day Percent Change: -0.71% Day Change: -0.87 | |
| Week Change: 3.45% Year-to-date Change: -6.4% | |
| BX Links: Profile News Message Board | |
| Charts:- Daily , Weekly | |
| Add BX to Watchlist: View: Get BX Trend Analysis ➞ | |
 | MOS The Mosaic Company |
| Sector: Materials | |
| SubSector: Agricultural Chemicals | |
| MarketCap: 4299.59 Millions | |
| Recent Price: 30.25 Smart Investing & Trading Score: 35 | |
| Day Percent Change: -0.10% Day Change: -0.03 | |
| Week Change: -2.42% Year-to-date Change: -15.3% | |
| MOS Links: Profile News Message Board | |
| Charts:- Daily , Weekly | |
| Add MOS to Watchlist: View: Get MOS Trend Analysis ➞ | |
 | TECH Bio-Techne Corporation |
| Sector: Health Care | |
| SubSector: Biotechnology | |
| MarketCap: 6958.05 Millions | |
| Recent Price: 64.08 Smart Investing & Trading Score: 35 | |
| Day Percent Change: 2.26% Day Change: 1.42 | |
| Week Change: 3.15% Year-to-date Change: -17.0% | |
| TECH Links: Profile News Message Board | |
| Charts:- Daily , Weekly | |
| Add TECH to Watchlist: View: Get TECH Trend Analysis ➞ | |
 | BA The Boeing Company |
| Sector: Industrials | |
| SubSector: Aerospace/Defense Products & Services | |
| MarketCap: 65336.4 Millions | |
| Recent Price: 167.22 Smart Investing & Trading Score: 35 | |
| Day Percent Change: 0.25% Day Change: 0.41 | |
| Week Change: -1.53% Year-to-date Change: -35.9% | |
| BA Links: Profile News Message Board | |
| Charts:- Daily , Weekly | |
| Add BA to Watchlist: View: Get BA Trend Analysis ➞ | |
 | XEL Xcel Energy Inc. |
| Sector: Utilities | |
| SubSector: Electric Utilities | |
| MarketCap: 28960.8 Millions | |
| Recent Price: 53.94 Smart Investing & Trading Score: 35 | |
| Day Percent Change: -1.95% Day Change: -1.07 | |
| Week Change: -1.43% Year-to-date Change: -12.9% | |
| XEL Links: Profile News Message Board | |
| Charts:- Daily , Weekly | |
| Add XEL to Watchlist: View: Get XEL Trend Analysis ➞ | |
 | EXR Extra Space Storage Inc. |
| Sector: Financials | |
| SubSector: REIT - Industrial | |
| MarketCap: 11203.9 Millions | |
| Recent Price: 133.47 Smart Investing & Trading Score: 35 | |
| Day Percent Change: -0.27% Day Change: -0.36 | |
| Week Change: 0.76% Year-to-date Change: -16.8% | |
| EXR Links: Profile News Message Board | |
| Charts:- Daily , Weekly | |
| Add EXR to Watchlist: View: Get EXR Trend Analysis ➞ | |
 | AFL Aflac Incorporated |
| Sector: Financials | |
| SubSector: Accident & Health Insurance | |
| MarketCap: 22706 Millions | |
| Recent Price: 83.61 Smart Investing & Trading Score: 35 | |
| Day Percent Change: -0.14% Day Change: -0.12 | |
| Week Change: 0.46% Year-to-date Change: 1.4% | |
| AFL Links: Profile News Message Board | |
| Charts:- Daily , Weekly | |
| Add AFL to Watchlist: View: Get AFL Trend Analysis ➞ | |
 | AMCR Amcor plc |
| Sector: Consumer Staples | |
| SubSector: Packaging & Containers | |
| MarketCap: 13964 Millions | |
| Recent Price: 8.97 Smart Investing & Trading Score: 34 | |
| Day Percent Change: 0.22% Day Change: 0.02 | |
| Week Change: 0% Year-to-date Change: -7.0% | |
| AMCR Links: Profile News Message Board | |
| Charts:- Daily , Weekly | |
| Add AMCR to Watchlist: View: Get AMCR Trend Analysis ➞ | |
 | VICI VICI Properties Inc. |
| Sector: Financials | |
| SubSector: REIT - Diversified | |
| MarketCap: 7327.03 Millions | |
| Recent Price: 28.47 Smart Investing & Trading Score: 34 | |
| Day Percent Change: -0.28% Day Change: -0.08 | |
| Week Change: 2.08% Year-to-date Change: -10.7% | |
| VICI Links: Profile News Message Board | |
| Charts:- Daily , Weekly | |
| Add VICI to Watchlist: View: Get VICI Trend Analysis ➞ | |
 | META Meta Platforms, Inc. |
| Sector: Technology | |
| SubSector: Internet Content & Information | |
| MarketCap: 732990 Millions | |
| Recent Price: 444.17 Smart Investing & Trading Score: 33 | |
| Day Percent Change: 2.54% Day Change: 11.00 | |
| Week Change: -7.67% Year-to-date Change: 25.5% | |
| META Links: Profile News Message Board | |
| Charts:- Daily , Weekly | |
| Add META to Watchlist: View: Get META Trend Analysis ➞ | |
 | TXT Textron Inc. |
| Sector: Industrials | |
| SubSector: Aerospace/Defense - Major Diversified | |
| MarketCap: 6123.09 Millions | |
| Recent Price: 86.51 Smart Investing & Trading Score: 33 | |
| Day Percent Change: 1.90% Day Change: 1.61 | |
| Week Change: -7.28% Year-to-date Change: 7.6% | |
| TXT Links: Profile News Message Board | |
| Charts:- Daily , Weekly | |
| Add TXT to Watchlist: View: Get TXT Trend Analysis ➞ | |
 | CRL Charles River Laboratories International, Inc. |
| Sector: Health Care | |
| SubSector: Medical Laboratories & Research | |
| MarketCap: 5700.5 Millions | |
| Recent Price: 229.03 Smart Investing & Trading Score: 33 | |
| Day Percent Change: 0.54% Day Change: 1.22 | |
| Week Change: 0.99% Year-to-date Change: -3.1% | |
| CRL Links: Profile News Message Board | |
| Charts:- Daily , Weekly | |
| Add CRL to Watchlist: View: Get CRL Trend Analysis ➞ | |
 | AOS A. O. Smith Corporation |
| Sector: Industrials | |
| SubSector: Industrial Electrical Equipment | |
| MarketCap: 5809.89 Millions | |
| Recent Price: 83.21 Smart Investing & Trading Score: 33 | |
| Day Percent Change: 0.47% Day Change: 0.39 | |
| Week Change: -3.32% Year-to-date Change: 0.9% | |
| AOS Links: Profile News Message Board | |
| Charts:- Daily , Weekly | |
| Add AOS to Watchlist: View: Get AOS Trend Analysis ➞ | |
 | L Loews Corporation |
| Sector: Financials | |
| SubSector: Property & Casualty Insurance | |
| MarketCap: 10768.2 Millions | |
| Recent Price: 75.46 Smart Investing & Trading Score: 33 | |
| Day Percent Change: -1.24% Day Change: -0.95 | |
| Week Change: -0.24% Year-to-date Change: 8.4% | |
| L Links: Profile News Message Board | |
| Charts:- Daily , Weekly | |
| Add L to Watchlist: View: Get L Trend Analysis ➞ | |
 | AJG Arthur J. Gallagher & Co. |
| Sector: Financials | |
| SubSector: Insurance Brokers | |
| MarketCap: 14852.2 Millions | |
| Recent Price: 234.11 Smart Investing & Trading Score: 33 | |
| Day Percent Change: -1.20% Day Change: -2.84 | |
| Week Change: -1.04% Year-to-date Change: 4.1% | |
| AJG Links: Profile News Message Board | |
| Charts:- Daily , Weekly | |
| Add AJG to Watchlist: View: Get AJG Trend Analysis ➞ | |
| For tabular summary view of above stock list: Summary View ➞ 0 - 25 , 25 - 50 , 50 - 75 , 75 - 100 , 100 - 125 , 125 - 150 , 150 - 175 , 175 - 200 , 200 - 225 , 225 - 250 , 250 - 275 , 275 - 300 , 300 - 325 , 325 - 350 , 350 - 375 , 375 - 400 , 400 - 425 , 425 - 450 , 450 - 475 , 475 - 500 | ||
| Click To Change The Sort Order: By Market Cap or Company Size Performance: Year-to-date, Week and Day | |
| Select Chart Type: | ||
|
Best Stocks Today 12Stocks.com |
© 2024 12Stocks.com Terms & Conditions Privacy Contact Us
All Information Provided Only For Education And Not To Be Used For Investing or Trading. See Terms & Conditions


One More Thing ... Get Best Stocks Delivered Daily!
Never Ever Miss A Move With Our Top Ten Stocks Lists
Find Best Stocks In Any Market - Bull or Bear Market
Take A Peek At Our Top Ten Stocks Lists: Daily, Weekly, Year-to-Date & Top Trends
Find Best Stocks In Any Market - Bull or Bear Market
Take A Peek At Our Top Ten Stocks Lists: Daily, Weekly, Year-to-Date & Top Trends
S&P 500 Stocks With Best Up Trends [0-bearish to 100-bullish]: ResMed [100], Google [100], Google [100], Teradyne [100], KLA [100], Tractor Supply[100], Carrier Global[100], Chipotle Mexican[100], Analog Devices[100], Colgate-Palmolive [100], Goldman Sachs[100]
Best S&P 500 Stocks Year-to-Date:
NVIDIA [77.12%], Constellation [60.86%], NRG [40.83%], Chipotle Mexican[39.35%], Western Digital[36.24%], Eaton [34.66%], Micron [34.52%], Targa Resources[34.52%], Diamondback [33.94%], Marathon [33.72%], Progressive [30.61%] Best S&P 500 Stocks This Week:
ResMed [21.92%], Teradyne [19.07%], Hasbro [16.66%], NVIDIA [15.11%], Monolithic Power[14.59%], Microchip [14.54%], Tesla [14.4%], Tyler Technologies[14.23%], Wabtec [14%], Globe Life[13.5%], NXP Semiconductors[12.79%] Best S&P 500 Stocks Daily:
ResMed [18.89%], Google [10.22%], Google [9.92%], NVIDIA [6.15%], Teradyne [4.92%], KLA [4.90%], Mohawk Industries[4.70%], T. Rowe[4.66%], Enphase [3.80%], Broadcom [3.74%], L3Harris Technologies[3.46%]