
 Login Sign Up


| |||||
 |  | ||||

| 12Stocks.com Market Intelligence |
Best S&P 500 Stocks
|
On this page, you will find the most comprehensive analysis of S&P 500 stocks and ETFs - from latest trends to performances to charts ➞. First, here are the year-to-date (YTD) performances of the most requested S&P 500 stocks at 12Stocks.com (click stock for review):
| NVIDIA 77% | ||
| Merck 19% | ||
| Amazon.com 19% | ||
| Google 19% | ||
| Caterpillar 18% | ||
| Walmart 15% | ||
| JPMorgan Chase 14% | ||
| Goldman Sachs 12% | ||
| Chevron 12% | ||
| Microsoft 7% | ||
| Johnson & Johnson -6% | ||
| McDonald s -8% | ||
| Starbucks -8% | ||
| Apple -10% | ||
| Gilead -19% | ||
| Boeing -33% | ||
| Intel -38% | ||
| Quick: S&P 500 Stocks Lists: Performances & Trends, S&P 500 Stock Charts
Sort S&P 500 stocks: Daily, Weekly, Year-to-Date, Market Cap & Trends. Filter S&P 500 stocks list by sector: Show all, Tech, Finance, Energy, Staples, Retail, Industrial, Materials, Utilities and HealthCare |
| 12Stocks.com S&P 500 Stocks Performances & Trends Daily Report | |||||||||
|
| 
The overall Smart Investing & Trading Score is 78 (0-bearish to 100-bullish) which puts S&P 500 index in short term neutral to bullish trend. The Smart Investing & Trading Score from previous trading session is 63 and hence an improvement of trend. | ||||||||
Here are the Smart Investing & Trading Scores of the most requested S&P 500 stocks at 12Stocks.com (click stock name for detailed review):
|


| 12Stocks.com: Top Performing S&P 500 Index Stocks | ||||||||||||||||||||||||||||||||||||||||||||||||
 The top performing S&P 500 Index stocks year to date are
Now, more recently, over last week, the top performing S&P 500 Index stocks on the move are


|
||||||||||||||||||||||||||||||||||||||||||||||||
| 12Stocks.com: Investing in S&P 500 Index with Stocks | |
|
The following table helps investors and traders sort through current performance and trends (as measured by Smart Investing & Trading Score) of various
stocks in the S&P 500 Index. Quick View: Move mouse or cursor over stock symbol (ticker) to view short-term technical chart and over stock name to view long term chart. Click on  to add stock symbol to your watchlist and to add stock symbol to your watchlist and  to view watchlist. Click on any ticker or stock name for detailed market intelligence report for that stock. to view watchlist. Click on any ticker or stock name for detailed market intelligence report for that stock. |
12Stocks.com Performance of Stocks in S&P 500 Index
| Ticker | Stock Name | Watchlist | Category | Recent Price | Smart Investing & Trading Score | Change % | YTD Change% |
| FAST | Fastenal |   | Services & Goods | 68.48 | 52 | 0.45% | 5.73% |
| PANW | Palo Alto | | Technology | 293.41 | 52 | 0.68% | -0.50% |
| GIS | General Mills | | Consumer Staples | 70.23 | 51 | -0.85% | 7.81% |
| PGR | Progressive | | Financials | 206.67 | 51 | -0.65% | 29.75% |
| ORCL | Oracle | | Technology | 116.49 | 51 | -0.61% | 10.49% |
| KMI | Kinder Morgan | | Energy | 18.60 | 51 | -0.43% | 5.44% |
| WFC | Wells Fargo | | Financials | 59.80 | 51 | -0.18% | 21.50% |
| BBY | Best Buy | | Services & Goods | 75.00 | 51 | -0.07% | -4.19% |
| TAP | Molson Coors | | Consumer Staples | 63.56 | 51 | 1.63% | 3.84% |
| PCAR | PACCAR Inc | | Consumer Staples | 113.64 | 51 | 1.50% | 16.37% |
| WYNN | Wynn Resorts | | Services & Goods | 96.98 | 51 | 1.15% | 6.44% |
| SYK | Stryker | | Health Care | 338.87 | 51 | 0.97% | 13.16% |
| LLY | Eli Lilly | | Health Care | 737.20 | 51 | 0.50% | 26.47% |
| MAS | Masco | | Industrials | 70.07 | 51 | 0.31% | 4.61% |
| CRL | Charles River | | Health Care | 232.10 | 50 | 1.34% | -1.82% |
| MDT | Medtronic | | Health Care | 80.86 | 50 | 1.40% | -1.85% |
| FOX | Twenty-First Century | | Services & Goods | 29.15 | 50 | 1.18% | 5.42% |
| LW | Lamb Weston | | Consumer Staples | 84.67 | 50 | 0.98% | -21.67% |
| EXPE | Expedia | | Services & Goods | 136.66 | 50 | 0.71% | -9.97% |
| AAPL | Apple | | Technology | 173.50 | 49 | 2.48% | -9.88% |
| AMD | Advanced Micro | | Technology | 160.20 | 49 | 1.78% | 8.68% |
| INCY | Incyte | | Health Care | 52.56 | 49 | 1.70% | -16.29% |
| XEL | Xcel | | Utilities | 54.48 | 49 | 0.96% | -12.00% |
| TECH | Bio-Techne | | Health Care | 64.51 | 49 | 0.70% | -16.39% |
| ZION | Zions Ban | | Financials | 41.32 | 49 | -1.05% | -5.81% |
| For chart view version of above stock list: Chart View ➞ 0 - 25 , 25 - 50 , 50 - 75 , 75 - 100 , 100 - 125 , 125 - 150 , 150 - 175 , 175 - 200 , 200 - 225 , 225 - 250 , 250 - 275 , 275 - 300 , 300 - 325 , 325 - 350 , 350 - 375 , 375 - 400 , 400 - 425 , 425 - 450 , 450 - 475 , 475 - 500 | ||
 | Click To Change The Sort Order: By Market Cap or Company Size Performance: Year-to-date, Week and Day |  |
|
Get the most comprehensive stock market coverage daily at 12Stocks.com ➞ Best Stocks Today ➞ Best Stocks Weekly ➞ Best Stocks Year-to-Date ➞ Best Stocks Trends ➞  Best Stocks Today 12Stocks.com Best Nasdaq Stocks ➞ Best S&P 500 Stocks ➞ Best Tech Stocks ➞ Best Biotech Stocks ➞ |
| Detailed Overview of S&P 500 Stocks |
| S&P 500 Technical Overview, Leaders & Laggards, Top S&P 500 ETF Funds & Detailed S&P 500 Stocks List, Charts, Trends & More |
| S&P 500: Technical Analysis, Trends & YTD Performance | |
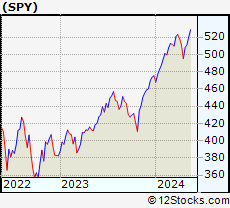
| S&P 500 index as represented by
SPY, an exchange-traded fund [ETF], holds basket of five hundred (mostly largecap) stocks from across all major sectors of the US stock market. The S&P 500 index (contains stocks like Apple and Exxon) is up by 7.31% and is currently outperforming the overall market by 0.75% year-to-date. Below is a quick view of technical charts and trends: | |
 SPY Weekly Chart |
|
| Long Term Trend: Good | |
| Medium Term Trend: Not Good | |
 SPY Daily Chart |
|
| Short Term Trend: Very Good | |
| Overall Trend Score: 78 | |
| YTD Performance: 7.31% | |
| **Trend Scores & Views Are Only For Educational Purposes And Not For Investing | |
| 12Stocks.com: Investing in S&P 500 Index using Exchange Traded Funds | |
|
The following table shows list of key exchange traded funds (ETF) that
help investors track S&P 500 index. The following list also includes leveraged ETF funds that track twice or thrice the daily returns of S&P 500 indices. Short or inverse ETF funds move in the opposite direction to the index they track and are useful during market pullbacks or during bear markets. Quick View: Move mouse or cursor over ETF symbol (ticker) to view short-term technical chart and over ETF name to view long term chart. Click on ticker or stock name for detailed view. Click on to add stock symbol to your watchlist and to view watchlist. |
12Stocks.com List of ETFs that track S&P 500 Index
| Ticker | ETF Name | Watchlist | Recent Price | Smart Investing & Trading Score | Change % | Week % | Year-to-date % |
| SPY | SPDR S&P 500 ETF | | 510.06 | 78 | 0.35 | 0.35 | 7.31% |
| IVV | iShares Core S&P 500 ETF | | 512.59 | 78 | 0.36 | 0.36 | 7.32% |
| VOO | Vanguard 500 ETF | | 468.84 | 78 | 0.35 | 0.35 | 7.34% |
| OEF | iShares S&P 100 | | 242.09 | 78 | 0.22 | 0.22 | 8.37% |
| SSO | ProShares Ultra S&P500 | | 73.19 | 78 | 0.66 | 0.66 | 12.48% |
| UPRO | ProShares UltraPro S&P500 | | 64.44 | 70 | 0.97 | 0.97 | 17.72% |
| SPXL | Direxion Daily S&P500 Bull 3X ETF | | 122.36 | 70 | 1.01 | 1.01 | 17.67% |
| SH | ProShares Short S&P500 | | 12.25 | 35 | -0.24 | -0.24 | -5.7% |
| SDS | ProShares UltraShort S&P500 | | 26.36 | 23 | -0.64 | -0.64 | -11.9% |
| SPXU | ProShares UltraPro Short S&P500 | | 35.17 | 35 | -0.93 | -0.93 | -18.21% |
| SPXS | Direxion Daily S&P 500 Bear 3X ETF | | 9.52 | 25 | -0.94 | -0.94 | -17.58% |
| 12Stocks.com: Charts, Trends, Fundamental Data and Performances of S&P 500 Stocks | |
|
We now take in-depth look at all S&P 500 stocks including charts, multi-period performances and overall trends (as measured by Smart Investing & Trading Score). One can sort S&P 500 stocks (click link to choose) by Daily, Weekly and by Year-to-Date performances. Also, one can sort by size of the company or by market capitalization. |
| Select Your Default Chart Type: | |||||
| |||||
| Click on stock symbol or name for detailed view. Click on to add stock symbol to your watchlist and to view watchlist. Quick View: Move mouse or cursor over "Daily" to quickly view daily technical stock chart and over "Weekly" to view weekly technical stock chart. | |||||

 | FAST Fastenal Company |
| Sector: Services & Goods | |
| SubSector: Industrial Equipment Wholesale | |
| MarketCap: 17609.9 Millions | |
| Recent Price: 68.48 Smart Investing & Trading Score: 52 | |
| Day Percent Change: 0.45% Day Change: 0.31 | |
| Week Change: 0.45% Year-to-date Change: 5.7% | |
| FAST Links: Profile News Message Board | |
| Charts:- Daily , Weekly | |
| Add FAST to Watchlist: View: Get FAST Trend Analysis ➞ | |
 | PANW Palo Alto Networks, Inc. |
| Sector: Technology | |
| SubSector: Networking & Communication Devices | |
| MarketCap: 16039.4 Millions | |
| Recent Price: 293.41 Smart Investing & Trading Score: 52 | |
| Day Percent Change: 0.68% Day Change: 1.99 | |
| Week Change: 0.68% Year-to-date Change: -0.5% | |
| PANW Links: Profile News Message Board | |
| Charts:- Daily , Weekly | |
| Add PANW to Watchlist: View: Get PANW Trend Analysis ➞ | |
 | GIS General Mills, Inc. |
| Sector: Consumer Staples | |
| SubSector: Processed & Packaged Goods | |
| MarketCap: 34131.7 Millions | |
| Recent Price: 70.23 Smart Investing & Trading Score: 51 | |
| Day Percent Change: -0.85% Day Change: -0.60 | |
| Week Change: -0.85% Year-to-date Change: 7.8% | |
| GIS Links: Profile News Message Board | |
| Charts:- Daily , Weekly | |
| Add GIS to Watchlist: View: Get GIS Trend Analysis ➞ | |
 | PGR The Progressive Corporation |
| Sector: Financials | |
| SubSector: Property & Casualty Insurance | |
| MarketCap: 43112 Millions | |
| Recent Price: 206.67 Smart Investing & Trading Score: 51 | |
| Day Percent Change: -0.65% Day Change: -1.36 | |
| Week Change: -0.65% Year-to-date Change: 29.8% | |
| PGR Links: Profile News Message Board | |
| Charts:- Daily , Weekly | |
| Add PGR to Watchlist: View: Get PGR Trend Analysis ➞ | |
 | ORCL Oracle Corporation |
| Sector: Technology | |
| SubSector: Application Software | |
| MarketCap: 164530 Millions | |
| Recent Price: 116.49 Smart Investing & Trading Score: 51 | |
| Day Percent Change: -0.61% Day Change: -0.72 | |
| Week Change: -0.61% Year-to-date Change: 10.5% | |
| ORCL Links: Profile News Message Board | |
| Charts:- Daily , Weekly | |
| Add ORCL to Watchlist: View: Get ORCL Trend Analysis ➞ | |
 | KMI Kinder Morgan, Inc. |
| Sector: Energy | |
| SubSector: Oil & Gas Pipelines | |
| MarketCap: 31283.5 Millions | |
| Recent Price: 18.60 Smart Investing & Trading Score: 51 | |
| Day Percent Change: -0.43% Day Change: -0.08 | |
| Week Change: -0.43% Year-to-date Change: 5.4% | |
| KMI Links: Profile News Message Board | |
| Charts:- Daily , Weekly | |
| Add KMI to Watchlist: View: Get KMI Trend Analysis ➞ | |
 | WFC Wells Fargo & Company |
| Sector: Financials | |
| SubSector: Money Center Banks | |
| MarketCap: 129138 Millions | |
| Recent Price: 59.80 Smart Investing & Trading Score: 51 | |
| Day Percent Change: -0.18% Day Change: -0.11 | |
| Week Change: -0.18% Year-to-date Change: 21.5% | |
| WFC Links: Profile News Message Board | |
| Charts:- Daily , Weekly | |
| Add WFC to Watchlist: View: Get WFC Trend Analysis ➞ | |
 | BBY Best Buy Co., Inc. |
| Sector: Services & Goods | |
| SubSector: Electronics Stores | |
| MarketCap: 15771.3 Millions | |
| Recent Price: 75.00 Smart Investing & Trading Score: 51 | |
| Day Percent Change: -0.07% Day Change: -0.05 | |
| Week Change: -0.07% Year-to-date Change: -4.2% | |
| BBY Links: Profile News Message Board | |
| Charts:- Daily , Weekly | |
| Add BBY to Watchlist: View: Get BBY Trend Analysis ➞ | |
 | TAP Molson Coors Beverage Company |
| Sector: Consumer Staples | |
| SubSector: Beverages - Brewers | |
| MarketCap: 8619.97 Millions | |
| Recent Price: 63.56 Smart Investing & Trading Score: 51 | |
| Day Percent Change: 1.63% Day Change: 1.02 | |
| Week Change: 1.63% Year-to-date Change: 3.8% | |
| TAP Links: Profile News Message Board | |
| Charts:- Daily , Weekly | |
| Add TAP to Watchlist: View: Get TAP Trend Analysis ➞ | |
 | PCAR PACCAR Inc |
| Sector: Consumer Staples | |
| SubSector: Trucks & Other Vehicles | |
| MarketCap: 19117.7 Millions | |
| Recent Price: 113.64 Smart Investing & Trading Score: 51 | |
| Day Percent Change: 1.50% Day Change: 1.68 | |
| Week Change: 1.5% Year-to-date Change: 16.4% | |
| PCAR Links: Profile News Message Board | |
| Charts:- Daily , Weekly | |
| Add PCAR to Watchlist: View: Get PCAR Trend Analysis ➞ | |
 | WYNN Wynn Resorts, Limited |
| Sector: Services & Goods | |
| SubSector: Resorts & Casinos | |
| MarketCap: 6643.34 Millions | |
| Recent Price: 96.98 Smart Investing & Trading Score: 51 | |
| Day Percent Change: 1.15% Day Change: 1.10 | |
| Week Change: 1.15% Year-to-date Change: 6.4% | |
| WYNN Links: Profile News Message Board | |
| Charts:- Daily , Weekly | |
| Add WYNN to Watchlist: View: Get WYNN Trend Analysis ➞ | |
 | SYK Stryker Corporation |
| Sector: Health Care | |
| SubSector: Medical Appliances & Equipment | |
| MarketCap: 59441.3 Millions | |
| Recent Price: 338.87 Smart Investing & Trading Score: 51 | |
| Day Percent Change: 0.97% Day Change: 3.26 | |
| Week Change: 0.97% Year-to-date Change: 13.2% | |
| SYK Links: Profile News Message Board | |
| Charts:- Daily , Weekly | |
| Add SYK to Watchlist: View: Get SYK Trend Analysis ➞ | |
 | LLY Eli Lilly and Company |
| Sector: Health Care | |
| SubSector: Drug Manufacturers - Major | |
| MarketCap: 130066 Millions | |
| Recent Price: 737.20 Smart Investing & Trading Score: 51 | |
| Day Percent Change: 0.50% Day Change: 3.69 | |
| Week Change: 0.5% Year-to-date Change: 26.5% | |
| LLY Links: Profile News Message Board | |
| Charts:- Daily , Weekly | |
| Add LLY to Watchlist: View: Get LLY Trend Analysis ➞ | |
 | MAS Masco Corporation |
| Sector: Industrials | |
| SubSector: General Building Materials | |
| MarketCap: 8655.63 Millions | |
| Recent Price: 70.07 Smart Investing & Trading Score: 51 | |
| Day Percent Change: 0.31% Day Change: 0.22 | |
| Week Change: 0.31% Year-to-date Change: 4.6% | |
| MAS Links: Profile News Message Board | |
| Charts:- Daily , Weekly | |
| Add MAS to Watchlist: View: Get MAS Trend Analysis ➞ | |
 | CRL Charles River Laboratories International, Inc. |
| Sector: Health Care | |
| SubSector: Medical Laboratories & Research | |
| MarketCap: 5700.5 Millions | |
| Recent Price: 232.10 Smart Investing & Trading Score: 50 | |
| Day Percent Change: 1.34% Day Change: 3.07 | |
| Week Change: 1.34% Year-to-date Change: -1.8% | |
| CRL Links: Profile News Message Board | |
| Charts:- Daily , Weekly | |
| Add CRL to Watchlist: View: Get CRL Trend Analysis ➞ | |
 | MDT Medtronic plc |
| Sector: Health Care | |
| SubSector: Medical Appliances & Equipment | |
| MarketCap: 113698 Millions | |
| Recent Price: 80.86 Smart Investing & Trading Score: 50 | |
| Day Percent Change: 1.40% Day Change: 1.12 | |
| Week Change: 1.4% Year-to-date Change: -1.9% | |
| MDT Links: Profile News Message Board | |
| Charts:- Daily , Weekly | |
| Add MDT to Watchlist: View: Get MDT Trend Analysis ➞ | |
 | FOX Twenty-First Century Fox, Inc. |
| Sector: Services & Goods | |
| SubSector: Entertainment - Diversified | |
| MarketCap: 24211.2 Millions | |
| Recent Price: 29.15 Smart Investing & Trading Score: 50 | |
| Day Percent Change: 1.18% Day Change: 0.34 | |
| Week Change: 1.18% Year-to-date Change: 5.4% | |
| FOX Links: Profile News Message Board | |
| Charts:- Daily , Weekly | |
| Add FOX to Watchlist: View: Get FOX Trend Analysis ➞ | |
 | LW Lamb Weston Holdings, Inc. |
| Sector: Consumer Staples | |
| SubSector: Food - Major Diversified | |
| MarketCap: 7844.63 Millions | |
| Recent Price: 84.67 Smart Investing & Trading Score: 50 | |
| Day Percent Change: 0.98% Day Change: 0.82 | |
| Week Change: 0.98% Year-to-date Change: -21.7% | |
| LW Links: Profile News Message Board | |
| Charts:- Daily , Weekly | |
| Add LW to Watchlist: View: Get LW Trend Analysis ➞ | |
 | EXPE Expedia Group, Inc. |
| Sector: Services & Goods | |
| SubSector: Lodging | |
| MarketCap: 8052.96 Millions | |
| Recent Price: 136.66 Smart Investing & Trading Score: 50 | |
| Day Percent Change: 0.71% Day Change: 0.96 | |
| Week Change: 0.71% Year-to-date Change: -10.0% | |
| EXPE Links: Profile News Message Board | |
| Charts:- Daily , Weekly | |
| Add EXPE to Watchlist: View: Get EXPE Trend Analysis ➞ | |
 | AAPL Apple Inc. |
| Sector: Technology | |
| SubSector: Electronic Equipment | |
| MarketCap: 1112940 Millions | |
| Recent Price: 173.50 Smart Investing & Trading Score: 49 | |
| Day Percent Change: 2.48% Day Change: 4.20 | |
| Week Change: 2.48% Year-to-date Change: -9.9% | |
| AAPL Links: Profile News Message Board | |
| Charts:- Daily , Weekly | |
| Add AAPL to Watchlist: View: Get AAPL Trend Analysis ➞ | |
 | AMD Advanced Micro Devices, Inc. |
| Sector: Technology | |
| SubSector: Semiconductor - Broad Line | |
| MarketCap: 54275.1 Millions | |
| Recent Price: 160.20 Smart Investing & Trading Score: 49 | |
| Day Percent Change: 1.78% Day Change: 2.80 | |
| Week Change: 1.78% Year-to-date Change: 8.7% | |
| AMD Links: Profile News Message Board | |
| Charts:- Daily , Weekly | |
| Add AMD to Watchlist: View: Get AMD Trend Analysis ➞ | |
 | INCY Incyte Corporation |
| Sector: Health Care | |
| SubSector: Biotechnology | |
| MarketCap: 15343.2 Millions | |
| Recent Price: 52.56 Smart Investing & Trading Score: 49 | |
| Day Percent Change: 1.70% Day Change: 0.88 | |
| Week Change: 1.7% Year-to-date Change: -16.3% | |
| INCY Links: Profile News Message Board | |
| Charts:- Daily , Weekly | |
| Add INCY to Watchlist: View: Get INCY Trend Analysis ➞ | |
 | XEL Xcel Energy Inc. |
| Sector: Utilities | |
| SubSector: Electric Utilities | |
| MarketCap: 28960.8 Millions | |
| Recent Price: 54.48 Smart Investing & Trading Score: 49 | |
| Day Percent Change: 0.96% Day Change: 0.52 | |
| Week Change: 0.96% Year-to-date Change: -12.0% | |
| XEL Links: Profile News Message Board | |
| Charts:- Daily , Weekly | |
| Add XEL to Watchlist: View: Get XEL Trend Analysis ➞ | |
 | TECH Bio-Techne Corporation |
| Sector: Health Care | |
| SubSector: Biotechnology | |
| MarketCap: 6958.05 Millions | |
| Recent Price: 64.51 Smart Investing & Trading Score: 49 | |
| Day Percent Change: 0.70% Day Change: 0.45 | |
| Week Change: 0.7% Year-to-date Change: -16.4% | |
| TECH Links: Profile News Message Board | |
| Charts:- Daily , Weekly | |
| Add TECH to Watchlist: View: Get TECH Trend Analysis ➞ | |
 | ZION Zions Bancorporation, National Association |
| Sector: Financials | |
| SubSector: Regional - Pacific Banks | |
| MarketCap: 4577.89 Millions | |
| Recent Price: 41.32 Smart Investing & Trading Score: 49 | |
| Day Percent Change: -1.05% Day Change: -0.44 | |
| Week Change: -1.05% Year-to-date Change: -5.8% | |
| ZION Links: Profile News Message Board | |
| Charts:- Daily , Weekly | |
| Add ZION to Watchlist: View: Get ZION Trend Analysis ➞ | |
| For tabular summary view of above stock list: Summary View ➞ 0 - 25 , 25 - 50 , 50 - 75 , 75 - 100 , 100 - 125 , 125 - 150 , 150 - 175 , 175 - 200 , 200 - 225 , 225 - 250 , 250 - 275 , 275 - 300 , 300 - 325 , 325 - 350 , 350 - 375 , 375 - 400 , 400 - 425 , 425 - 450 , 450 - 475 , 475 - 500 | ||
| Click To Change The Sort Order: By Market Cap or Company Size Performance: Year-to-date, Week and Day | |
| Select Chart Type: | ||
|
Best Stocks Today 12Stocks.com |
© 2024 12Stocks.com Terms & Conditions Privacy Contact Us
All Information Provided Only For Education And Not To Be Used For Investing or Trading. See Terms & Conditions


One More Thing ... Get Best Stocks Delivered Daily!
Never Ever Miss A Move With Our Top Ten Stocks Lists
Find Best Stocks In Any Market - Bull or Bear Market
Take A Peek At Our Top Ten Stocks Lists: Daily, Weekly, Year-to-Date & Top Trends
Find Best Stocks In Any Market - Bull or Bear Market
Take A Peek At Our Top Ten Stocks Lists: Daily, Weekly, Year-to-Date & Top Trends
S&P 500 Stocks With Best Up Trends [0-bearish to 100-bullish]: Tesla [100], Albemarle [100], Domino s[100], Quest Diagnostics[100], AES [100], Carrier Global[100], Teradyne [100], DaVita [100], Skyworks Solutions[100], Moderna [100], NextEra [100]
Best S&P 500 Stocks Year-to-Date:
NVIDIA [77.21%], Constellation [61.05%], NRG [43.04%], Chipotle Mexican[40.34%], Eaton [35.58%], Marathon [35.15%], Targa Resources[34.91%], Micron [34.01%], Western Digital[33.4%], Diamondback [32.74%], DaVita [31.86%] Best S&P 500 Stocks This Week:
Tesla [15.31%], Albemarle [7.57%], Domino s[5.62%], Paper[4.4%], ON Semiconductor[4.06%], Quest Diagnostics[3.9%], Freeport-McMoRan [3.78%], AES [3.78%], Boeing [3.75%], Carrier Global[3.65%], Teradyne [3.64%] Best S&P 500 Stocks Daily:
Tesla [15.31%], Albemarle [7.57%], Domino s[5.62%], Paper[4.40%], ON Semiconductor[4.06%], Quest Diagnostics[3.90%], Freeport-McMoRan [3.78%], AES [3.78%], Boeing [3.75%], Carrier Global[3.65%], Teradyne [3.64%]