
 Login Sign Up


| |||||
 |  | ||||

| 12Stocks.com Market Intelligence |
Best S&P 500 Stocks
|
On this page, you will find the most comprehensive analysis of S&P 500 stocks and ETFs - from latest trends to performances to charts ➞. First, here are the year-to-date (YTD) performances of the most requested S&P 500 stocks at 12Stocks.com (click stock for review):
| NVIDIA 77% | ||
| Amazon.com 22% | ||
| Google 18% | ||
| Merck 17% | ||
| Goldman Sachs 14% | ||
| Caterpillar 13% | ||
| Walmart 13% | ||
| JPMorgan Chase 12% | ||
| Microsoft 8% | ||
| Chevron 5% | ||
| Apple -4% | ||
| Johnson & Johnson -5% | ||
| McDonald s -9% | ||
| Gilead -20% | ||
| Starbucks -23% | ||
| Boeing -31% | ||
| Intel -39% | ||
| Quick: S&P 500 Stocks Lists: Performances & Trends, S&P 500 Stock Charts
Sort S&P 500 stocks: Daily, Weekly, Year-to-Date, Market Cap & Trends. Filter S&P 500 stocks list by sector: Show all, Tech, Finance, Energy, Staples, Retail, Industrial, Materials, Utilities and HealthCare |
| 12Stocks.com S&P 500 Stocks Performances & Trends Daily Report | |||||||||
|
| 
The overall Smart Investing & Trading Score is 60 (0-bearish to 100-bullish) which puts S&P 500 index in short term neutral to bullish trend. The Smart Investing & Trading Score from previous trading session is 30 and hence an improvement of trend. | ||||||||
Here are the Smart Investing & Trading Scores of the most requested S&P 500 stocks at 12Stocks.com (click stock name for detailed review):
|


| 12Stocks.com: Top Performing S&P 500 Index Stocks | ||||||||||||||||||||||||||||||||||||||||||||||||
 The top performing S&P 500 Index stocks year to date are
Now, more recently, over last week, the top performing S&P 500 Index stocks on the move are


|
||||||||||||||||||||||||||||||||||||||||||||||||
| 12Stocks.com: Investing in S&P 500 Index with Stocks | |
|
The following table helps investors and traders sort through current performance and trends (as measured by Smart Investing & Trading Score) of various
stocks in the S&P 500 Index. Quick View: Move mouse or cursor over stock symbol (ticker) to view short-term technical chart and over stock name to view long term chart. Click on  to add stock symbol to your watchlist and to add stock symbol to your watchlist and  to view watchlist. Click on any ticker or stock name for detailed market intelligence report for that stock. to view watchlist. Click on any ticker or stock name for detailed market intelligence report for that stock. |
12Stocks.com Performance of Stocks in S&P 500 Index
| Ticker | Stock Name | Watchlist | Category | Recent Price | Smart Investing & Trading Score | Change % | YTD Change% |
| EPAM | EPAM Systems |   | Technology | 240.76 | 35 | 1.09% | -19.03% |
| ACN | Accenture | | Technology | 302.24 | 35 | 0.63% | -13.87% |
| LH | Laboratory | | Health Care | 200.86 | 35 | 0.30% | -11.63% |
| TDY | Teledyne Technologies | | Technology | 384.58 | 35 | -0.26% | -13.83% |
| TTWO | Take-Two Interactive | | Technology | 144.69 | 34 | 1.13% | -10.10% |
| KEYS | Keysight Technologies | | Technology | 147.80 | 34 | 0.55% | -7.10% |
| PGR | Progressive | | Financials | 206.79 | 34 | -1.07% | 29.83% |
| ALL | Allstate | | Financials | 167.49 | 34 | -1.00% | 19.65% |
| HPE | Hewlett Packard | | Technology | 16.65 | 33 | 0.70% | -1.97% |
| ICE | Intercontinental Exchange | | Financials | 131.12 | 32 | 3.62% | 2.09% |
| NOW | ServiceNow | | Technology | 713.19 | 32 | 2.51% | 0.95% |
| ADSK | Autodesk | | Technology | 214.98 | 32 | 2.40% | -11.71% |
| BBY | Best Buy | | Services & Goods | 74.05 | 32 | 2.22% | -5.40% |
| META | Meta Platforms | | Technology | 451.26 | 32 | 2.13% | 27.47% |
| IT | Gartner | | Technology | 427.69 | 32 | 2.06% | -5.19% |
| CRL | Charles River | | Health Care | 234.41 | 32 | 1.97% | -0.84% |
| UBER | Uber Technologies | | Technology | 69.86 | 32 | 1.89% | 13.47% |
| WBA | Walgreens Boots | | Services & Goods | 17.86 | 32 | 1.85% | -31.62% |
| GEHC | GE HealthCare | | Health Care | 79.47 | 32 | 1.83% | 2.75% |
| MSFT | Microsoft | | Technology | 405.09 | 32 | 1.82% | 7.73% |
| BEN | Franklin Resources | | Financials | 23.36 | 32 | 1.72% | -21.57% |
| NFLX | Netflix | | Technology | 574.26 | 32 | 1.61% | 17.95% |
| WYNN | Wynn Resorts | | Services & Goods | 96.69 | 32 | 1.50% | 6.13% |
| MGM | MGM Resorts | | Services & Goods | 41.47 | 32 | 1.47% | -7.18% |
| KMX | CarMax | | Services & Goods | 69.00 | 32 | 1.42% | -10.08% |
| For chart view version of above stock list: Chart View ➞ 0 - 25 , 25 - 50 , 50 - 75 , 75 - 100 , 100 - 125 , 125 - 150 , 150 - 175 , 175 - 200 , 200 - 225 , 225 - 250 , 250 - 275 , 275 - 300 , 300 - 325 , 325 - 350 , 350 - 375 , 375 - 400 , 400 - 425 , 425 - 450 , 450 - 475 , 475 - 500 | ||
 | Click To Change The Sort Order: By Market Cap or Company Size Performance: Year-to-date, Week and Day |  |
|
Get the most comprehensive stock market coverage daily at 12Stocks.com ➞ Best Stocks Today ➞ Best Stocks Weekly ➞ Best Stocks Year-to-Date ➞ Best Stocks Trends ➞  Best Stocks Today 12Stocks.com Best Nasdaq Stocks ➞ Best S&P 500 Stocks ➞ Best Tech Stocks ➞ Best Biotech Stocks ➞ |
| Detailed Overview of S&P 500 Stocks |
| S&P 500 Technical Overview, Leaders & Laggards, Top S&P 500 ETF Funds & Detailed S&P 500 Stocks List, Charts, Trends & More |
| S&P 500: Technical Analysis, Trends & YTD Performance | |
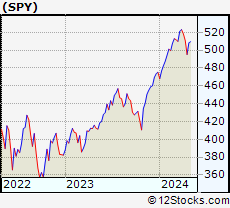
| S&P 500 index as represented by
SPY, an exchange-traded fund [ETF], holds basket of five hundred (mostly largecap) stocks from across all major sectors of the US stock market. The S&P 500 index (contains stocks like Apple and Exxon) is up by 7.05% and is currently outperforming the overall market by 0.56% year-to-date. Below is a quick view of technical charts and trends: | |
 SPY Weekly Chart |
|
| Long Term Trend: Good | |
| Medium Term Trend: Not Good | |
 SPY Daily Chart |
|
| Short Term Trend: Very Good | |
| Overall Trend Score: 60 | |
| YTD Performance: 7.05% | |
| **Trend Scores & Views Are Only For Educational Purposes And Not For Investing | |
| 12Stocks.com: Investing in S&P 500 Index using Exchange Traded Funds | |
|
The following table shows list of key exchange traded funds (ETF) that
help investors track S&P 500 index. The following list also includes leveraged ETF funds that track twice or thrice the daily returns of S&P 500 indices. Short or inverse ETF funds move in the opposite direction to the index they track and are useful during market pullbacks or during bear markets. Quick View: Move mouse or cursor over ETF symbol (ticker) to view short-term technical chart and over ETF name to view long term chart. Click on ticker or stock name for detailed view. Click on to add stock symbol to your watchlist and to view watchlist. |
12Stocks.com List of ETFs that track S&P 500 Index
| Ticker | ETF Name | Watchlist | Recent Price | Smart Investing & Trading Score | Change % | Week % | Year-to-date % |
| SPY | SPDR S&P 500 ETF | | 508.84 | 60 | 0.75 | 0.11 | 7.05% |
| IVV | iShares Core S&P 500 ETF | | 511.36 | 30 | 0.77 | 0.12 | 7.06% |
| VOO | Vanguard 500 ETF | | 467.73 | 30 | 0.76 | 0.11 | 7.08% |
| OEF | iShares S&P 100 | | 242.65 | 73 | 1.01 | 0.45 | 8.62% |
| SSO | ProShares Ultra S&P500 | | 72.86 | 60 | 1.67 | 0.21 | 11.97% |
| UPRO | ProShares UltraPro S&P500 | | 63.93 | 39 | 2.50 | 0.17 | 16.79% |
| SH | ProShares Short S&P500 | | 12.29 | 41 | -0.73 | 0.08 | -5.39% |
| SDS | ProShares UltraShort S&P500 | | 26.52 | 28 | -1.41 | -0.04 | -11.36% |
| SPXU | ProShares UltraPro Short S&P500 | | 35.38 | 23 | -2.43 | -0.34 | -17.72% |
| SPXS | Direxion Daily S&P 500 Bear 3X ETF | | 9.57 | 71 | -2.45 | -0.42 | -17.14% |
| 12Stocks.com: Charts, Trends, Fundamental Data and Performances of S&P 500 Stocks | |
|
We now take in-depth look at all S&P 500 stocks including charts, multi-period performances and overall trends (as measured by Smart Investing & Trading Score). One can sort S&P 500 stocks (click link to choose) by Daily, Weekly and by Year-to-Date performances. Also, one can sort by size of the company or by market capitalization. |
| Select Your Default Chart Type: | |||||
| |||||
| Click on stock symbol or name for detailed view. Click on to add stock symbol to your watchlist and to view watchlist. Quick View: Move mouse or cursor over "Daily" to quickly view daily technical stock chart and over "Weekly" to view weekly technical stock chart. | |||||

 | EPAM EPAM Systems, Inc. |
| Sector: Technology | |
| SubSector: Information Technology Services | |
| MarketCap: 11519.6 Millions | |
| Recent Price: 240.76 Smart Investing & Trading Score: 35 | |
| Day Percent Change: 1.09% Day Change: 2.58 | |
| Week Change: 1.27% Year-to-date Change: -19.0% | |
| EPAM Links: Profile News Message Board | |
| Charts:- Daily , Weekly | |
| Add EPAM to Watchlist: View: Get EPAM Trend Analysis ➞ | |
 | ACN Accenture plc |
| Sector: Technology | |
| SubSector: Information Technology Services | |
| MarketCap: 106627 Millions | |
| Recent Price: 302.24 Smart Investing & Trading Score: 35 | |
| Day Percent Change: 0.63% Day Change: 1.90 | |
| Week Change: -1.87% Year-to-date Change: -13.9% | |
| ACN Links: Profile News Message Board | |
| Charts:- Daily , Weekly | |
| Add ACN to Watchlist: View: Get ACN Trend Analysis ➞ | |
 | LH Laboratory Corporation of America Holdings |
| Sector: Health Care | |
| SubSector: Medical Laboratories & Research | |
| MarketCap: 12119.2 Millions | |
| Recent Price: 200.86 Smart Investing & Trading Score: 35 | |
| Day Percent Change: 0.30% Day Change: 0.61 | |
| Week Change: 1.24% Year-to-date Change: -11.6% | |
| LH Links: Profile News Message Board | |
| Charts:- Daily , Weekly | |
| Add LH to Watchlist: View: Get LH Trend Analysis ➞ | |
 | TDY Teledyne Technologies Incorporated |
| Sector: Technology | |
| SubSector: Scientific & Technical Instruments | |
| MarketCap: 9360.43 Millions | |
| Recent Price: 384.58 Smart Investing & Trading Score: 35 | |
| Day Percent Change: -0.26% Day Change: -1.02 | |
| Week Change: 2.65% Year-to-date Change: -13.8% | |
| TDY Links: Profile News Message Board | |
| Charts:- Daily , Weekly | |
| Add TDY to Watchlist: View: Get TDY Trend Analysis ➞ | |
 | TTWO Take-Two Interactive Software, Inc. |
| Sector: Technology | |
| SubSector: Multimedia & Graphics Software | |
| MarketCap: 12479.6 Millions | |
| Recent Price: 144.69 Smart Investing & Trading Score: 34 | |
| Day Percent Change: 1.13% Day Change: 1.62 | |
| Week Change: 0.15% Year-to-date Change: -10.1% | |
| TTWO Links: Profile News Message Board | |
| Charts:- Daily , Weekly | |
| Add TTWO to Watchlist: View: Get TTWO Trend Analysis ➞ | |
 | KEYS Keysight Technologies, Inc. |
| Sector: Technology | |
| SubSector: Scientific & Technical Instruments | |
| MarketCap: 17355.1 Millions | |
| Recent Price: 147.80 Smart Investing & Trading Score: 34 | |
| Day Percent Change: 0.55% Day Change: 0.81 | |
| Week Change: -0.5% Year-to-date Change: -7.1% | |
| KEYS Links: Profile News Message Board | |
| Charts:- Daily , Weekly | |
| Add KEYS to Watchlist: View: Get KEYS Trend Analysis ➞ | |
 | PGR The Progressive Corporation |
| Sector: Financials | |
| SubSector: Property & Casualty Insurance | |
| MarketCap: 43112 Millions | |
| Recent Price: 206.79 Smart Investing & Trading Score: 34 | |
| Day Percent Change: -1.07% Day Change: -2.24 | |
| Week Change: -0.6% Year-to-date Change: 29.8% | |
| PGR Links: Profile News Message Board | |
| Charts:- Daily , Weekly | |
| Add PGR to Watchlist: View: Get PGR Trend Analysis ➞ | |
 | ALL The Allstate Corporation |
| Sector: Financials | |
| SubSector: Property & Casualty Insurance | |
| MarketCap: 25916.6 Millions | |
| Recent Price: 167.49 Smart Investing & Trading Score: 34 | |
| Day Percent Change: -1.00% Day Change: -1.69 | |
| Week Change: -1.52% Year-to-date Change: 19.7% | |
| ALL Links: Profile News Message Board | |
| Charts:- Daily , Weekly | |
| Add ALL to Watchlist: View: Get ALL Trend Analysis ➞ | |
 | HPE Hewlett Packard Enterprise Company |
| Sector: Technology | |
| SubSector: Communication Equipment | |
| MarketCap: 12886.1 Millions | |
| Recent Price: 16.65 Smart Investing & Trading Score: 33 | |
| Day Percent Change: 0.70% Day Change: 0.11 | |
| Week Change: -3.06% Year-to-date Change: -2.0% | |
| HPE Links: Profile News Message Board | |
| Charts:- Daily , Weekly | |
| Add HPE to Watchlist: View: Get HPE Trend Analysis ➞ | |
 | ICE Intercontinental Exchange, Inc. |
| Sector: Financials | |
| SubSector: Diversified Investments | |
| MarketCap: 46054.6 Millions | |
| Recent Price: 131.12 Smart Investing & Trading Score: 32 | |
| Day Percent Change: 3.62% Day Change: 4.58 | |
| Week Change: -0.44% Year-to-date Change: 2.1% | |
| ICE Links: Profile News Message Board | |
| Charts:- Daily , Weekly | |
| Add ICE to Watchlist: View: Get ICE Trend Analysis ➞ | |
 | NOW ServiceNow, Inc. |
| Sector: Technology | |
| SubSector: Information Technology Services | |
| MarketCap: 53599.1 Millions | |
| Recent Price: 713.19 Smart Investing & Trading Score: 32 | |
| Day Percent Change: 2.51% Day Change: 17.47 | |
| Week Change: -1.43% Year-to-date Change: 1.0% | |
| NOW Links: Profile News Message Board | |
| Charts:- Daily , Weekly | |
| Add NOW to Watchlist: View: Get NOW Trend Analysis ➞ | |
 | ADSK Autodesk, Inc. |
| Sector: Technology | |
| SubSector: Technical & System Software | |
| MarketCap: 36975.8 Millions | |
| Recent Price: 214.98 Smart Investing & Trading Score: 32 | |
| Day Percent Change: 2.40% Day Change: 5.03 | |
| Week Change: -1.35% Year-to-date Change: -11.7% | |
| ADSK Links: Profile News Message Board | |
| Charts:- Daily , Weekly | |
| Add ADSK to Watchlist: View: Get ADSK Trend Analysis ➞ | |
 | BBY Best Buy Co., Inc. |
| Sector: Services & Goods | |
| SubSector: Electronics Stores | |
| MarketCap: 15771.3 Millions | |
| Recent Price: 74.05 Smart Investing & Trading Score: 32 | |
| Day Percent Change: 2.22% Day Change: 1.61 | |
| Week Change: -1.33% Year-to-date Change: -5.4% | |
| BBY Links: Profile News Message Board | |
| Charts:- Daily , Weekly | |
| Add BBY to Watchlist: View: Get BBY Trend Analysis ➞ | |
 | META Meta Platforms, Inc. |
| Sector: Technology | |
| SubSector: Internet Content & Information | |
| MarketCap: 732990 Millions | |
| Recent Price: 451.26 Smart Investing & Trading Score: 32 | |
| Day Percent Change: 2.13% Day Change: 9.41 | |
| Week Change: 1.8% Year-to-date Change: 27.5% | |
| META Links: Profile News Message Board | |
| Charts:- Daily , Weekly | |
| Add META to Watchlist: View: Get META Trend Analysis ➞ | |
 | IT Gartner, Inc. |
| Sector: Technology | |
| SubSector: Information Technology Services | |
| MarketCap: 7767.98 Millions | |
| Recent Price: 427.69 Smart Investing & Trading Score: 32 | |
| Day Percent Change: 2.06% Day Change: 8.65 | |
| Week Change: -4.7% Year-to-date Change: -5.2% | |
| IT Links: Profile News Message Board | |
| Charts:- Daily , Weekly | |
| Add IT to Watchlist: View: Get IT Trend Analysis ➞ | |
 | CRL Charles River Laboratories International, Inc. |
| Sector: Health Care | |
| SubSector: Medical Laboratories & Research | |
| MarketCap: 5700.5 Millions | |
| Recent Price: 234.41 Smart Investing & Trading Score: 32 | |
| Day Percent Change: 1.97% Day Change: 4.52 | |
| Week Change: 2.35% Year-to-date Change: -0.8% | |
| CRL Links: Profile News Message Board | |
| Charts:- Daily , Weekly | |
| Add CRL to Watchlist: View: Get CRL Trend Analysis ➞ | |
 | UBER Uber Technologies, Inc. |
| Sector: Technology | |
| SubSector: Application Software | |
| MarketCap: 42671.2 Millions | |
| Recent Price: 69.86 Smart Investing & Trading Score: 32 | |
| Day Percent Change: 1.89% Day Change: 1.30 | |
| Week Change: 1.18% Year-to-date Change: 13.5% | |
| UBER Links: Profile News Message Board | |
| Charts:- Daily , Weekly | |
| Add UBER to Watchlist: View: Get UBER Trend Analysis ➞ | |
 | WBA Walgreens Boots Alliance, Inc. |
| Sector: Services & Goods | |
| SubSector: Drug Stores | |
| MarketCap: 46184.1 Millions | |
| Recent Price: 17.86 Smart Investing & Trading Score: 32 | |
| Day Percent Change: 1.85% Day Change: 0.32 | |
| Week Change: 0.88% Year-to-date Change: -31.6% | |
| WBA Links: Profile News Message Board | |
| Charts:- Daily , Weekly | |
| Add WBA to Watchlist: View: Get WBA Trend Analysis ➞ | |
 | GEHC GE HealthCare Technologies Inc. |
| Sector: Health Care | |
| SubSector: Health Information Services | |
| MarketCap: 36240 Millions | |
| Recent Price: 79.47 Smart Investing & Trading Score: 32 | |
| Day Percent Change: 1.83% Day Change: 1.43 | |
| Week Change: -7.8% Year-to-date Change: 2.8% | |
| GEHC Links: Profile News Message Board | |
| Charts:- Daily , Weekly | |
| Add GEHC to Watchlist: View: Get GEHC Trend Analysis ➞ | |
 | MSFT Microsoft Corporation |
| Sector: Technology | |
| SubSector: Business Software & Services | |
| MarketCap: 1154150 Millions | |
| Recent Price: 405.09 Smart Investing & Trading Score: 32 | |
| Day Percent Change: 1.82% Day Change: 7.25 | |
| Week Change: -0.3% Year-to-date Change: 7.7% | |
| MSFT Links: Profile News Message Board | |
| Charts:- Daily , Weekly | |
| Add MSFT to Watchlist: View: Get MSFT Trend Analysis ➞ | |
 | BEN Franklin Resources, Inc. |
| Sector: Financials | |
| SubSector: Asset Management | |
| MarketCap: 9419.73 Millions | |
| Recent Price: 23.36 Smart Investing & Trading Score: 32 | |
| Day Percent Change: 1.72% Day Change: 0.39 | |
| Week Change: -6.5% Year-to-date Change: -21.6% | |
| BEN Links: Profile News Message Board | |
| Charts:- Daily , Weekly | |
| Add BEN to Watchlist: View: Get BEN Trend Analysis ➞ | |
 | NFLX Netflix, Inc. |
| Sector: Technology | |
| SubSector: CATV Systems | |
| MarketCap: 162108 Millions | |
| Recent Price: 574.26 Smart Investing & Trading Score: 32 | |
| Day Percent Change: 1.61% Day Change: 9.11 | |
| Week Change: 2.32% Year-to-date Change: 18.0% | |
| NFLX Links: Profile News Message Board | |
| Charts:- Daily , Weekly | |
| Add NFLX to Watchlist: View: Get NFLX Trend Analysis ➞ | |
 | WYNN Wynn Resorts, Limited |
| Sector: Services & Goods | |
| SubSector: Resorts & Casinos | |
| MarketCap: 6643.34 Millions | |
| Recent Price: 96.69 Smart Investing & Trading Score: 32 | |
| Day Percent Change: 1.50% Day Change: 1.42 | |
| Week Change: 0.85% Year-to-date Change: 6.1% | |
| WYNN Links: Profile News Message Board | |
| Charts:- Daily , Weekly | |
| Add WYNN to Watchlist: View: Get WYNN Trend Analysis ➞ | |
 | MGM MGM Resorts International |
| Sector: Services & Goods | |
| SubSector: Resorts & Casinos | |
| MarketCap: 5315.04 Millions | |
| Recent Price: 41.47 Smart Investing & Trading Score: 32 | |
| Day Percent Change: 1.47% Day Change: 0.60 | |
| Week Change: 0.92% Year-to-date Change: -7.2% | |
| MGM Links: Profile News Message Board | |
| Charts:- Daily , Weekly | |
| Add MGM to Watchlist: View: Get MGM Trend Analysis ➞ | |
 | KMX CarMax, Inc. |
| Sector: Services & Goods | |
| SubSector: Auto Dealerships | |
| MarketCap: 8121.71 Millions | |
| Recent Price: 69.00 Smart Investing & Trading Score: 32 | |
| Day Percent Change: 1.42% Day Change: 0.96 | |
| Week Change: -0.84% Year-to-date Change: -10.1% | |
| KMX Links: Profile News Message Board | |
| Charts:- Daily , Weekly | |
| Add KMX to Watchlist: View: Get KMX Trend Analysis ➞ | |
| For tabular summary view of above stock list: Summary View ➞ 0 - 25 , 25 - 50 , 50 - 75 , 75 - 100 , 100 - 125 , 125 - 150 , 150 - 175 , 175 - 200 , 200 - 225 , 225 - 250 , 250 - 275 , 275 - 300 , 300 - 325 , 325 - 350 , 350 - 375 , 375 - 400 , 400 - 425 , 425 - 450 , 450 - 475 , 475 - 500 | ||
| Click To Change The Sort Order: By Market Cap or Company Size Performance: Year-to-date, Week and Day | |
| Select Chart Type: | ||
|
Best Stocks Today 12Stocks.com |
© 2024 12Stocks.com Terms & Conditions Privacy Contact Us
All Information Provided Only For Education And Not To Be Used For Investing or Trading. See Terms & Conditions


One More Thing ... Get Best Stocks Delivered Daily!
Never Ever Miss A Move With Our Top Ten Stocks Lists
Find Best Stocks In Any Market - Bull or Bear Market
Take A Peek At Our Top Ten Stocks Lists: Daily, Weekly, Year-to-Date & Top Trends
Find Best Stocks In Any Market - Bull or Bear Market
Take A Peek At Our Top Ten Stocks Lists: Daily, Weekly, Year-to-Date & Top Trends
S&P 500 Stocks With Best Up Trends [0-bearish to 100-bullish]: Amgen [100], Apple [100], First Solar[100], Camden Property[100], Comerica [100], BorgWarner [100], Zions Ban[100], Teradyne [100], Extra Space[100], Fifth Third[100], Mid-America Apartment[100]
Best S&P 500 Stocks Year-to-Date:
NVIDIA [77.16%], Constellation [66.92%], NRG [48.12%], Chipotle Mexican[37.99%], Western Digital[34.49%], Micron [33.23%], Eaton [33.05%], Leidos Holdings[31.25%], Progressive [29.83%], Garmin [28.43%], Diamondback [28.35%] Best S&P 500 Stocks This Week:
Bio-Techne [19.34%], C.H. Robinson[16.15%], Amgen [16.13%], Garmin [15.09%], Moderna [15.09%], Aptiv [12.36%], Albemarle [10.87%], Amcor [10.59%], BorgWarner [9.69%], WestRock [9.1%], Leidos Holdings[8.98%] Best S&P 500 Stocks Daily:
Amgen [12.62%], Live Nation[8.46%], Enphase [6.67%], Apple [6.55%], Constellation [5.23%], Digital Realty[5.18%], Booking Holdings[5.15%], Motorola Solutions[5.04%], First Solar[4.37%], Builders FirstSource[4.21%], Arista Networks[4.10%]