
 Login Sign Up


| |||||
 |  | ||||

| 12Stocks.com Market Intelligence |
Best S&P 100 Stocks
| In a hurry? S&P 100 Stocks Lists: Performance Trends Table, Stock Charts
Sort S&P 100 stocks: Daily, Weekly, Year-to-Date, Market Cap & Trends. |
| 12Stocks.com S&P 100 Stocks Performances & Trends Daily | |||||||||
|
|  The overall Smart Investing & Trading Score is 83 (0-bearish to 100-bullish) which puts S&P 100 index in short term bullish trend. The Smart Investing & Trading Score from previous trading session is 30 and hence an improvement of trend.
| ||||||||
Here are the Smart Investing & Trading Scores of the most requested S&P 100 stocks at 12Stocks.com (click stock name for detailed review):
|


| 12Stocks.com: Top Performing S&P 100 Index Stocks | ||||||||||||||||||||||||||||||||||||||||||||||||
 The top performing S&P 100 Index stocks year to date are
Now, more recently, over last week, the top performing S&P 100 Index stocks on the move are


|
||||||||||||||||||||||||||||||||||||||||||||||||
| 12Stocks.com: Investing in S&P 100 Index with Stocks | |
|
The following table helps investors and traders sort through current performance and trends (as measured by Smart Investing & Trading Score) of various
stocks in the S&P 100 Index. Quick View: Move mouse or cursor over stock symbol (ticker) to view short-term technical chart and over stock name to view long term chart. Click on  to add stock symbol to your watchlist and to add stock symbol to your watchlist and  to view watchlist. Click on any ticker or stock name for detailed market intelligence report for that stock. to view watchlist. Click on any ticker or stock name for detailed market intelligence report for that stock. |
12Stocks.com Performance of Stocks in S&P 100 Index
| Ticker | Stock Name | Watchlist | Category | Recent Price | Smart Investing & Trading Score | Change % | YTD Change% |
| MRK | Merck |   | Health Care | 127.51 | 35 | -0.58% | 16.96% |
| MET | MetLife | | Financials | 70.52 | 34 | 0.40% | 6.64% |
| META | Meta Platforms | | Technology | 452.20 | 32 | 2.34% | 27.74% |
| MSFT | Microsoft | | Technology | 406.66 | 32 | 2.22% | 8.14% |
| INTC | Intel | | Technology | 30.90 | 32 | 1.25% | -38.51% |
| SPG | Simon Property | | Financials | 142.93 | 32 | 1.11% | 0.20% |
| CRM | salesforce.com | | Technology | 273.66 | 32 | 0.56% | 4.00% |
| MDLZ | Mondelez | | Consumer Staples | 69.89 | 32 | -0.87% | -3.51% |
| NKE | NIKE | | Consumer Staples | 92.15 | 32 | -0.28% | -15.12% |
| BMY | Bristol-Myers | | Health Care | 43.99 | 28 | 0.66% | -14.27% |
| COP | ConocoPhillips | | Energy | 122.23 | 26 | -0.02% | 5.31% |
| MCD | McDonald s | | Services & Goods | 270.32 | 25 | -1.08% | -8.83% |
| CSCO | Cisco Systems | | Technology | 47.12 | 25 | 0.71% | -6.73% |
| IBM | Business | | Technology | 165.71 | 25 | 0.62% | 1.32% |
| EMR | Emerson Electric | | Industrials | 106.54 | 23 | 0.12% | 9.46% |
| V | Visa | | Financials | 268.49 | 18 | 0.33% | 3.13% |
| GILD | Gilead Sciences | | Health Care | 64.78 | 18 | -0.84% | -20.03% |
| ABT | Abbott | | Health Care | 105.90 | 18 | -0.02% | -3.79% |
| AVGO | Broadcom | | Technology | 1278.11 | 17 | 3.19% | 14.50% |
| AMD | Advanced Micro | | Technology | 150.60 | 17 | 3.04% | 2.16% |
| MA | Mastercard | | Financials | 443.58 | 17 | 0.56% | 4.00% |
| VZ | Verizon | | Technology | 38.89 | 10 | -0.10% | 3.16% |
| LLY | Eli Lilly | | Health Care | 734.97 | 7 | -2.77% | 26.08% |
| CVS | CVS Health | | Health Care | 55.90 | 0 | 1.36% | -29.20% |
| LIN | Linde | | Materials | 423.60 | 0 | 0.95% | 3.14% |
| For chart view version of above stock list: Chart View ➞ 0 - 25 , 25 - 50 , 50 - 75 , 75 - 100 , 100 - 125 | ||
 | Click To Change The Sort Order: By Market Cap or Company Size Performance: Year-to-date, Week and Day |  |
|
Get the most comprehensive stock market coverage daily at 12Stocks.com ➞ Best Stocks Today ➞ Best Stocks Weekly ➞ Best Stocks Year-to-Date ➞ Best Stocks Trends ➞  Best Stocks Today 12Stocks.com Best Nasdaq Stocks ➞ Best S&P 500 Stocks ➞ Best Tech Stocks ➞ Best Biotech Stocks ➞ |
| Detailed Overview of S&P 100 Stocks |
| S&P 100 Technical Overview, Leaders & Laggards, Top S&P 100 ETF Funds & Detailed S&P 100 Stocks List, Charts, Trends & More |
| S&P 100: Technical Analysis, Trends & YTD Performance | |
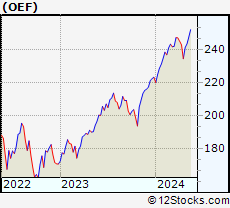
| S&P 100 index as represented by
OEF, an exchange-traded fund [ETF], holds basket of one hundred US (mostly largecap) stocks from across all major sectors of the US stock market. The S&P 100 index (contains stocks like Apple and Exxon) is up by 9.11% and is currently outperforming the overall market by 2.23% year-to-date. Below is a quick view of technical charts and trends: | |
 OEF Weekly Chart |
|
| Long Term Trend: Good | |
| Medium Term Trend: Good | |
 OEF Daily Chart |
|
| Short Term Trend: Very Good | |
| Overall Trend Score: 83 | |
| YTD Performance: 9.11% | |
| **Trend Scores & Views Are Only For Educational Purposes And Not For Investing | |
| 12Stocks.com: Investing in S&P 100 Index using Exchange Traded Funds | |
|
The following table shows list of key exchange traded funds (ETF) that
help investors track S&P 100 index. We have also included ETF funds that track S&P 500 index since it is market-cap weighted. The following list also includes leveraged ETF funds that track twice or thrice the daily returns of S&P 100 indices. Short or inverse ETF funds move in the opposite direction to the index they track and are useful during market pullbacks or during bear markets. Quick View: Move mouse or cursor over ETF symbol (ticker) to view short-term technical chart and over ETF name to view long term chart. Click on ticker or stock name for detailed view. Click on to add stock symbol to your watchlist and to view watchlist. |
12Stocks.com List of ETFs that track S&P 100 Index
| Ticker | ETF Name | Watchlist | Recent Price | Smart Investing & Trading Score | Change % | Week % | Year-to-date % |
| SPY | SPDR S&P 500 ETF | | 511.29 | 60 | 1.24 | 0.6 | 7.57% |
| SPXS | Direxion Daily S&P 500 Bear 3X ETF | | 9.46 | 23 | -3.57 | -1.56 | -18.1% |
| SH | ProShares Short S&P500 | | 12.23 | 41 | -1.21 | -0.41 | -5.85% |
| SDS | ProShares UltraShort S&P500 | | 26.25 | 28 | -2.42 | -1.06 | -12.27% |
| SPXU | ProShares UltraPro Short S&P500 | | 34.89 | 23 | -3.78 | -1.72 | -18.86% |
| UPRO | ProShares UltraPro S&P500 | | 64.69 | 52 | 3.72 | 1.36 | 18.18% |
| SPXL | Direxion Daily S&P500 Bull 3X ETF | | 122.86 | 52 | 3.73 | 1.42 | 18.15% |
| VOO | Vanguard 500 ETF | | 469.98 | 60 | 1.24 | 0.59 | 7.6% |
| SSO | ProShares Ultra S&P500 | | 73.46 | 60 | 2.51 | 1.03 | 12.89% |
| OEF | iShares S&P 100 | | 243.74 | 83 | 1.46 | 0.9 | 9.11% |
| 12Stocks.com: Charts, Trends, Fundamental Data and Performances of S&P 100 Stocks | |
|
We now take in-depth look at all S&P 100 stocks including charts, multi-period performances and overall trends (as measured by Smart Investing & Trading Score). One can sort S&P 100 stocks (click link to choose) by Daily, Weekly and by Year-to-Date performances. Also, one can sort by size of the company or by market capitalization. |
| Select Your Default Chart Type: | |||||
| |||||
| Click on stock symbol or name for detailed view. Click on to add stock symbol to your watchlist and to view watchlist. Quick View: Move mouse or cursor over "Daily" to quickly view daily technical stock chart and over "Weekly" to view weekly technical stock chart. | |||||

 | MRK Merck & Co., Inc. |
| Sector: Health Care | |
| SubSector: Drug Manufacturers - Major | |
| MarketCap: 192657 Millions | |
| Recent Price: 127.51 Smart Investing & Trading Score: 35 | |
| Day Percent Change: -0.58% Day Change: -0.75 | |
| Week Change: -2.81% Year-to-date Change: 17.0% | |
| MRK Links: Profile News Message Board | |
| Charts:- Daily , Weekly | |
| Add MRK to Watchlist: View: Get Complete MRK Trend Analysis ➞ | |
 | MET MetLife, Inc. |
| Sector: Financials | |
| SubSector: Life Insurance | |
| MarketCap: 26272.9 Millions | |
| Recent Price: 70.52 Smart Investing & Trading Score: 34 | |
| Day Percent Change: 0.40% Day Change: 0.28 | |
| Week Change: 0.14% Year-to-date Change: 6.6% | |
| MET Links: Profile News Message Board | |
| Charts:- Daily , Weekly | |
| Add MET to Watchlist: View: Get Complete MET Trend Analysis ➞ | |
 | META Meta Platforms, Inc. |
| Sector: Technology | |
| SubSector: Internet Content & Information | |
| MarketCap: 732990 Millions | |
| Recent Price: 452.20 Smart Investing & Trading Score: 32 | |
| Day Percent Change: 2.34% Day Change: 10.35 | |
| Week Change: 2.01% Year-to-date Change: 27.7% | |
| META Links: Profile News Message Board | |
| Charts:- Daily , Weekly | |
| Add META to Watchlist: View: Get Complete META Trend Analysis ➞ | |
 | MSFT Microsoft Corporation |
| Sector: Technology | |
| SubSector: Business Software & Services | |
| MarketCap: 1154150 Millions | |
| Recent Price: 406.66 Smart Investing & Trading Score: 32 | |
| Day Percent Change: 2.22% Day Change: 8.82 | |
| Week Change: 0.08% Year-to-date Change: 8.1% | |
| MSFT Links: Profile News Message Board | |
| Charts:- Daily , Weekly | |
| Add MSFT to Watchlist: View: Get Complete MSFT Trend Analysis ➞ | |
 | INTC Intel Corporation |
| Sector: Technology | |
| SubSector: Semiconductor - Broad Line | |
| MarketCap: 222357 Millions | |
| Recent Price: 30.90 Smart Investing & Trading Score: 32 | |
| Day Percent Change: 1.25% Day Change: 0.38 | |
| Week Change: -3.07% Year-to-date Change: -38.5% | |
| INTC Links: Profile News Message Board | |
| Charts:- Daily , Weekly | |
| Add INTC to Watchlist: View: Get Complete INTC Trend Analysis ➞ | |
 | SPG Simon Property Group, Inc. |
| Sector: Financials | |
| SubSector: REIT - Retail | |
| MarketCap: 17959.6 Millions | |
| Recent Price: 142.93 Smart Investing & Trading Score: 32 | |
| Day Percent Change: 1.11% Day Change: 1.57 | |
| Week Change: 0.4% Year-to-date Change: 0.2% | |
| SPG Links: Profile News Message Board | |
| Charts:- Daily , Weekly | |
| Add SPG to Watchlist: View: Get Complete SPG Trend Analysis ➞ | |
 | CRM salesforce.com, inc. |
| Sector: Technology | |
| SubSector: Application Software | |
| MarketCap: 137120 Millions | |
| Recent Price: 273.66 Smart Investing & Trading Score: 32 | |
| Day Percent Change: 0.56% Day Change: 1.53 | |
| Week Change: -0.23% Year-to-date Change: 4.0% | |
| CRM Links: Profile News Message Board | |
| Charts:- Daily , Weekly | |
| Add CRM to Watchlist: View: Get Complete CRM Trend Analysis ➞ | |
 | MDLZ Mondelez International, Inc. |
| Sector: Consumer Staples | |
| SubSector: Confectioners | |
| MarketCap: 68385.8 Millions | |
| Recent Price: 69.89 Smart Investing & Trading Score: 32 | |
| Day Percent Change: -0.87% Day Change: -0.61 | |
| Week Change: -1.02% Year-to-date Change: -3.5% | |
| MDLZ Links: Profile News Message Board | |
| Charts:- Daily , Weekly | |
| Add MDLZ to Watchlist: View: Get Complete MDLZ Trend Analysis ➞ | |
 | NKE NIKE, Inc. |
| Sector: Consumer Staples | |
| SubSector: Textile - Apparel Footwear & Accessories | |
| MarketCap: 118918 Millions | |
| Recent Price: 92.15 Smart Investing & Trading Score: 32 | |
| Day Percent Change: -0.28% Day Change: -0.26 | |
| Week Change: -2.09% Year-to-date Change: -15.1% | |
| NKE Links: Profile News Message Board | |
| Charts:- Daily , Weekly | |
| Add NKE to Watchlist: View: Get Complete NKE Trend Analysis ➞ | |
 | BMY Bristol-Myers Squibb Company |
| Sector: Health Care | |
| SubSector: Drug Manufacturers - Major | |
| MarketCap: 117052 Millions | |
| Recent Price: 43.99 Smart Investing & Trading Score: 28 | |
| Day Percent Change: 0.66% Day Change: 0.29 | |
| Week Change: -1.92% Year-to-date Change: -14.3% | |
| BMY Links: Profile News Message Board | |
| Charts:- Daily , Weekly | |
| Add BMY to Watchlist: View: Get Complete BMY Trend Analysis ➞ | |
 | COP ConocoPhillips |
| Sector: Energy | |
| SubSector: Independent Oil & Gas | |
| MarketCap: 33504.3 Millions | |
| Recent Price: 122.23 Smart Investing & Trading Score: 26 | |
| Day Percent Change: -0.02% Day Change: -0.02 | |
| Week Change: -6.15% Year-to-date Change: 5.3% | |
| COP Links: Profile News Message Board | |
| Charts:- Daily , Weekly | |
| Add COP to Watchlist: View: Get Complete COP Trend Analysis ➞ | |
 | MCD McDonald s Corporation |
| Sector: Services & Goods | |
| SubSector: Restaurants | |
| MarketCap: 122481 Millions | |
| Recent Price: 270.32 Smart Investing & Trading Score: 25 | |
| Day Percent Change: -1.08% Day Change: -2.96 | |
| Week Change: -1.01% Year-to-date Change: -8.8% | |
| MCD Links: Profile News Message Board | |
| Charts:- Daily , Weekly | |
| Add MCD to Watchlist: View: Get Complete MCD Trend Analysis ➞ | |
 | CSCO Cisco Systems, Inc. |
| Sector: Technology | |
| SubSector: Communication Equipment | |
| MarketCap: 168483 Millions | |
| Recent Price: 47.12 Smart Investing & Trading Score: 25 | |
| Day Percent Change: 0.71% Day Change: 0.33 | |
| Week Change: -1.55% Year-to-date Change: -6.7% | |
| CSCO Links: Profile News Message Board | |
| Charts:- Daily , Weekly | |
| Add CSCO to Watchlist: View: Get Complete CSCO Trend Analysis ➞ | |
 | IBM International Business Machines Corporation |
| Sector: Technology | |
| SubSector: Information Technology Services | |
| MarketCap: 97241.6 Millions | |
| Recent Price: 165.71 Smart Investing & Trading Score: 25 | |
| Day Percent Change: 0.62% Day Change: 1.02 | |
| Week Change: -0.85% Year-to-date Change: 1.3% | |
| IBM Links: Profile News Message Board | |
| Charts:- Daily , Weekly | |
| Add IBM to Watchlist: View: Get Complete IBM Trend Analysis ➞ | |
 | EMR Emerson Electric Co. |
| Sector: Industrials | |
| SubSector: Industrial Electrical Equipment | |
| MarketCap: 30457.9 Millions | |
| Recent Price: 106.54 Smart Investing & Trading Score: 23 | |
| Day Percent Change: 0.12% Day Change: 0.13 | |
| Week Change: -3.05% Year-to-date Change: 9.5% | |
| EMR Links: Profile News Message Board | |
| Charts:- Daily , Weekly | |
| Add EMR to Watchlist: View: Get Complete EMR Trend Analysis ➞ | |
 | V Visa Inc. |
| Sector: Financials | |
| SubSector: Credit Services | |
| MarketCap: 340798 Millions | |
| Recent Price: 268.49 Smart Investing & Trading Score: 18 | |
| Day Percent Change: 0.33% Day Change: 0.88 | |
| Week Change: -2.2% Year-to-date Change: 3.1% | |
| V Links: Profile News Message Board | |
| Charts:- Daily , Weekly | |
| Add V to Watchlist: View: Get Complete V Trend Analysis ➞ | |
 | GILD Gilead Sciences, Inc. |
| Sector: Health Care | |
| SubSector: Biotechnology | |
| MarketCap: 99485.6 Millions | |
| Recent Price: 64.78 Smart Investing & Trading Score: 18 | |
| Day Percent Change: -0.84% Day Change: -0.55 | |
| Week Change: -0.98% Year-to-date Change: -20.0% | |
| GILD Links: Profile News Message Board | |
| Charts:- Daily , Weekly | |
| Add GILD to Watchlist: View: Get Complete GILD Trend Analysis ➞ | |
 | ABT Abbott Laboratories |
| Sector: Health Care | |
| SubSector: Medical Appliances & Equipment | |
| MarketCap: 125288 Millions | |
| Recent Price: 105.90 Smart Investing & Trading Score: 18 | |
| Day Percent Change: -0.02% Day Change: -0.02 | |
| Week Change: -1.52% Year-to-date Change: -3.8% | |
| ABT Links: Profile News Message Board | |
| Charts:- Daily , Weekly | |
| Add ABT to Watchlist: View: Get Complete ABT Trend Analysis ➞ | |
 | AVGO Broadcom Inc. |
| Sector: Technology | |
| SubSector: Semiconductor - Broad Line | |
| MarketCap: 86329.1 Millions | |
| Recent Price: 1278.11 Smart Investing & Trading Score: 17 | |
| Day Percent Change: 3.19% Day Change: 39.54 | |
| Week Change: -4.91% Year-to-date Change: 14.5% | |
| AVGO Links: Profile News Message Board | |
| Charts:- Daily , Weekly | |
| Add AVGO to Watchlist: View: Get Complete AVGO Trend Analysis ➞ | |
 | AMD Advanced Micro Devices, Inc. |
| Sector: Technology | |
| SubSector: Semiconductor - Broad Line | |
| MarketCap: 54275.1 Millions | |
| Recent Price: 150.60 Smart Investing & Trading Score: 17 | |
| Day Percent Change: 3.04% Day Change: 4.44 | |
| Week Change: -4.32% Year-to-date Change: 2.2% | |
| AMD Links: Profile News Message Board | |
| Charts:- Daily , Weekly | |
| Add AMD to Watchlist: View: Get Complete AMD Trend Analysis ➞ | |
 | MA Mastercard Incorporated |
| Sector: Financials | |
| SubSector: Credit Services | |
| MarketCap: 234809 Millions | |
| Recent Price: 443.58 Smart Investing & Trading Score: 17 | |
| Day Percent Change: 0.56% Day Change: 2.48 | |
| Week Change: -4.07% Year-to-date Change: 4.0% | |
| MA Links: Profile News Message Board | |
| Charts:- Daily , Weekly | |
| Add MA to Watchlist: View: Get Complete MA Trend Analysis ➞ | |
 | VZ Verizon Communications Inc. |
| Sector: Technology | |
| SubSector: Telecom Services - Domestic | |
| MarketCap: 229427 Millions | |
| Recent Price: 38.89 Smart Investing & Trading Score: 10 | |
| Day Percent Change: -0.10% Day Change: -0.04 | |
| Week Change: -1.99% Year-to-date Change: 3.2% | |
| VZ Links: Profile News Message Board | |
| Charts:- Daily , Weekly | |
| Add VZ to Watchlist: View: Get Complete VZ Trend Analysis ➞ | |
 | LLY Eli Lilly and Company |
| Sector: Health Care | |
| SubSector: Drug Manufacturers - Major | |
| MarketCap: 130066 Millions | |
| Recent Price: 734.97 Smart Investing & Trading Score: 7 | |
| Day Percent Change: -2.77% Day Change: -20.94 | |
| Week Change: 0.2% Year-to-date Change: 26.1% | |
| LLY Links: Profile News Message Board | |
| Charts:- Daily , Weekly | |
| Add LLY to Watchlist: View: Get Complete LLY Trend Analysis ➞ | |
 | CVS CVS Health Corporation |
| Sector: Health Care | |
| SubSector: Health Care Plans | |
| MarketCap: 80104.3 Millions | |
| Recent Price: 55.90 Smart Investing & Trading Score: 0 | |
| Day Percent Change: 1.36% Day Change: 0.75 | |
| Week Change: -16.79% Year-to-date Change: -29.2% | |
| CVS Links: Profile News Message Board | |
| Charts:- Daily , Weekly | |
| Add CVS to Watchlist: View: Get Complete CVS Trend Analysis ➞ | |
 | LIN Linde plc |
| Sector: Materials | |
| SubSector: Specialty Chemicals | |
| MarketCap: 88539.2 Millions | |
| Recent Price: 423.60 Smart Investing & Trading Score: 0 | |
| Day Percent Change: 0.95% Day Change: 3.98 | |
| Week Change: -4.42% Year-to-date Change: 3.1% | |
| LIN Links: Profile News Message Board | |
| Charts:- Daily , Weekly | |
| Add LIN to Watchlist: View: Get Complete LIN Trend Analysis ➞ | |
| For tabular summary view of above stock list: Summary View ➞ 0 - 25 , 25 - 50 , 50 - 75 , 75 - 100 , 100 - 125 | ||
| Click To Change The Sort Order: By Market Cap or Company Size Performance: Year-to-date, Week and Day | |
| Select Chart Type: | ||
|
Best Stocks Today 12Stocks.com |
� 2024 12Stocks.com Terms & Conditions Privacy Contact Us
All Information Provided Only For Education And Not To Be Used For Investing or Trading. See Terms & Conditions


One More Thing ... Get Best Stocks Delivered Daily!
Never Ever Miss A Move With Our Top Ten Stocks Lists
Find Best Stocks In Any Market - Bull or Bear Market
Take A Peek At Our Top Ten Stocks Lists: Daily, Weekly, Year-to-Date & Top Trends
Find Best Stocks In Any Market - Bull or Bear Market
Take A Peek At Our Top Ten Stocks Lists: Daily, Weekly, Year-to-Date & Top Trends
S&P 100 Stocks With Best Up Trends [0-bearish to 100-bullish]: Amgen [100], Apple [100], NextEra Energy[100], Goldman Sachs[100], Duke Energy[100], Charles Schwab[100], Pfizer [100], QUALCOMM [100], Southern [95], Google [95], Google [95]
Best S&P 100 Stocks Year-to-Date:
NVIDIA [79.29%], General Electric[28.58%], Meta Platforms[27.74%], Eli Lilly[26.08%], Walt Disney[25.88%], General Motors[24.89%], QUALCOMM [24.21%], American Express[23.18%], Amazon.com [22.55%], Wells Fargo[21.78%], Google [19.91%] Best S&P 100 Stocks This Week:
Amgen [15.3%], Pfizer [9.49%], QUALCOMM [8.44%], Apple [8.32%], Tesla [7.67%], Boeing [7.52%], NextEra Energy[6.29%], American Tower[5.85%], 3M [5.79%], American [5.3%], Charter [4.45%] Best S&P 100 Stocks Daily:
Amgen [11.82%], Apple [5.98%], NVIDIA [3.46%], Broadcom [3.19%], Advanced Micro[3.04%], Booking [3.01%], Netflix [2.51%], Meta Platforms[2.34%], Microsoft [2.22%], Home Depot[2.18%], Adobe [2.02%]