
 Login Sign Up


| |||||
 |  | ||||

| 12Stocks.com Market Intelligence |
Best S&P 100 Stocks
| In a hurry? S&P 100 Stocks Lists: Performance Trends Table, Stock Charts
Sort S&P 100 stocks: Daily, Weekly, Year-to-Date, Market Cap & Trends. |
| 12Stocks.com S&P 100 Stocks Performances & Trends Daily | |||||||||
|
|  The overall Smart Investing & Trading Score is 58 (0-bearish to 100-bullish) which puts S&P 100 index in short term neutral trend. The Smart Investing & Trading Score from previous trading session is 51 and hence an improvement of trend.
| ||||||||
Here are the Smart Investing & Trading Scores of the most requested S&P 100 stocks at 12Stocks.com (click stock name for detailed review):
|


| 12Stocks.com: Top Performing S&P 100 Index Stocks | ||||||||||||||||||||||||||||||||||||||||||||||||
 The top performing S&P 100 Index stocks year to date are
Now, more recently, over last week, the top performing S&P 100 Index stocks on the move are


|
||||||||||||||||||||||||||||||||||||||||||||||||
| 12Stocks.com: Investing in S&P 100 Index with Stocks | |
|
The following table helps investors and traders sort through current performance and trends (as measured by Smart Investing & Trading Score) of various
stocks in the S&P 100 Index. Quick View: Move mouse or cursor over stock symbol (ticker) to view short-term technical chart and over stock name to view long term chart. Click on  to add stock symbol to your watchlist and to add stock symbol to your watchlist and  to view watchlist. Click on any ticker or stock name for detailed market intelligence report for that stock. to view watchlist. Click on any ticker or stock name for detailed market intelligence report for that stock. |
12Stocks.com Performance of Stocks in S&P 100 Index
| Ticker | Stock Name | Watchlist | Category | Recent Price | Smart Investing & Trading Score | Change % | YTD Change% |
| TMO | Thermo Fisher |   | Health Care | 574.59 | 85 | 4.78% | 8.25% |
| UPS | United Parcel | | Transports | 148.87 | 85 | 2.41% | -5.32% |
| CL | Colgate-Palmolive | | Consumer Staples | 88.58 | 85 | 0.28% | 11.13% |
| COST | Costco Wholesale | | Services & Goods | 722.68 | 80 | 1.01% | 9.48% |
| F | Ford Motor | | Consumer Staples | 12.94 | 80 | 0.47% | 6.15% |
| LMT | Lockheed Martin | | Industrials | 460.08 | 78 | -0.27% | 1.51% |
| FDX | FedEx | | Transports | 271.75 | 78 | 0.59% | 7.42% |
| XOM | Exxon Mobil | | Energy | 121.03 | 76 | 0.39% | 21.05% |
| GD | General Dynamics | | Industrials | 292.72 | 75 | 0.48% | 12.73% |
| MET | MetLife | | Financials | 72.22 | 75 | 0.36% | 9.21% |
| ABBV | AbbVie | | Health Care | 169.54 | 73 | 0.98% | 9.40% |
| JPM | JPMorgan Chase | | Financials | 192.14 | 70 | 1.44% | 12.96% |
| MRK | Merck | | Health Care | 126.88 | 70 | -0.05% | 16.38% |
| AIG | American | | Financials | 74.93 | 70 | -0.04% | 10.60% |
| PYPL | PayPal | | Financials | 64.43 | 68 | 1.96% | 4.92% |
| CAT | Caterpillar | | Industrials | 363.25 | 68 | 1.58% | 22.86% |
| DIS | Walt Disney | | Services & Goods | 113.71 | 68 | 1.54% | 25.94% |
| TXN | Texas Instruments | | Technology | 165.47 | 68 | 1.25% | -2.93% |
| PEP | PepsiCo | | Consumer Staples | 171.22 | 66 | -2.97% | 0.81% |
| MDLZ | Mondelez | | Consumer Staples | 70.75 | 64 | 1.93% | -2.32% |
| AMGN | Amgen | | Health Care | 273.54 | 64 | 0.60% | -5.03% |
| MCD | McDonald s | | Services & Goods | 276.88 | 64 | 0.47% | -6.62% |
| SBUX | Starbucks | | Services & Goods | 87.87 | 64 | -0.35% | -8.48% |
| BMY | Bristol-Myers | | Health Care | 48.99 | 62 | -0.31% | -4.52% |
| COP | ConocoPhillips | | Energy | 129.84 | 61 | 0.39% | 11.86% |
| For chart view version of above stock list: Chart View ➞ 0 - 25 , 25 - 50 , 50 - 75 , 75 - 100 , 100 - 125 | ||
 | Click To Change The Sort Order: By Market Cap or Company Size Performance: Year-to-date, Week and Day |  |
|
Get the most comprehensive stock market coverage daily at 12Stocks.com ➞ Best Stocks Today ➞ Best Stocks Weekly ➞ Best Stocks Year-to-Date ➞ Best Stocks Trends ➞  Best Stocks Today 12Stocks.com Best Nasdaq Stocks ➞ Best S&P 500 Stocks ➞ Best Tech Stocks ➞ Best Biotech Stocks ➞ |
| Detailed Overview of S&P 100 Stocks |
| S&P 100 Technical Overview, Leaders & Laggards, Top S&P 100 ETF Funds & Detailed S&P 100 Stocks List, Charts, Trends & More |
| S&P 100: Technical Analysis, Trends & YTD Performance | |
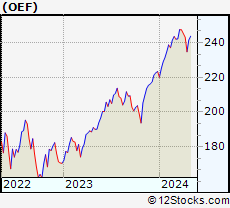
| S&P 100 index as represented by
OEF, an exchange-traded fund [ETF], holds basket of one hundred US (mostly largecap) stocks from across all major sectors of the US stock market. The S&P 100 index (contains stocks like Apple and Exxon) is up by 7.41% and is currently outperforming the overall market by 1.77% year-to-date. Below is a quick view of technical charts and trends: | |
 OEF Weekly Chart |
|
| Long Term Trend: Good | |
| Medium Term Trend: Not Good | |
 OEF Daily Chart |
|
| Short Term Trend: Very Good | |
| Overall Trend Score: 58 | |
| YTD Performance: 7.41% | |
| **Trend Scores & Views Are Only For Educational Purposes And Not For Investing | |
| 12Stocks.com: Investing in S&P 100 Index using Exchange Traded Funds | |
|
The following table shows list of key exchange traded funds (ETF) that
help investors track S&P 100 index. We have also included ETF funds that track S&P 500 index since it is market-cap weighted. The following list also includes leveraged ETF funds that track twice or thrice the daily returns of S&P 100 indices. Short or inverse ETF funds move in the opposite direction to the index they track and are useful during market pullbacks or during bear markets. Quick View: Move mouse or cursor over ETF symbol (ticker) to view short-term technical chart and over ETF name to view long term chart. Click on ticker or stock name for detailed view. Click on to add stock symbol to your watchlist and to view watchlist. |
12Stocks.com List of ETFs that track S&P 100 Index
| Ticker | ETF Name | Watchlist | Recent Price | Smart Investing & Trading Score | Change % | Week % | Year-to-date % |
| SPY | SPDR S&P 500 ETF | | 505.65 | 58 | 1.19 | 2.12 | 6.38% |
| SPXS | Direxion Daily S&P 500 Bear 3X ETF | | 9.75 | 32 | -5.43 | -5.89 | -15.58% |
| SH | ProShares Short S&P500 | | 12.34 | 42 | -1.20 | -1.99 | -5% |
| SDS | ProShares UltraShort S&P500 | | 26.78 | 37 | -2.30 | -4.01 | -10.49% |
| SSO | ProShares Ultra S&P500 | | 72.04 | 58 | 2.43 | 4.24 | 10.71% |
| SPXU | ProShares UltraPro Short S&P500 | | 35.99 | 42 | -3.62 | -6.1 | -16.3% |
| UPRO | ProShares UltraPro S&P500 | | 62.93 | 58 | 3.59 | 6.37 | 14.96% |
| SPXL | Direxion Daily S&P500 Bull 3X ETF | | 119.51 | 58 | 3.52 | 6.18 | 14.92% |
| VOO | Vanguard 500 ETF | | 464.84 | 58 | 2.03 | 2.14 | 6.42% |
| OEF | iShares S&P 100 | | 239.95 | 58 | 1.33 | 2.25 | 7.41% |
| 12Stocks.com: Charts, Trends, Fundamental Data and Performances of S&P 100 Stocks | |
|
We now take in-depth look at all S&P 100 stocks including charts, multi-period performances and overall trends (as measured by Smart Investing & Trading Score). One can sort S&P 100 stocks (click link to choose) by Daily, Weekly and by Year-to-Date performances. Also, one can sort by size of the company or by market capitalization. |
| Select Your Default Chart Type: | |||||
| |||||
| Click on stock symbol or name for detailed view. Click on to add stock symbol to your watchlist and to view watchlist. Quick View: Move mouse or cursor over "Daily" to quickly view daily technical stock chart and over "Weekly" to view weekly technical stock chart. | |||||

 | TMO Thermo Fisher Scientific Inc. |
| Sector: Health Care | |
| SubSector: Medical Laboratories & Research | |
| MarketCap: 112999 Millions | |
| Recent Price: 574.59 Smart Investing & Trading Score: 85 | |
| Day Percent Change: 4.78% Day Change: 26.21 | |
| Week Change: 5.47% Year-to-date Change: 8.3% | |
| TMO Links: Profile News Message Board | |
| Charts:- Daily , Weekly | |
| Add TMO to Watchlist: View: Get Complete TMO Trend Analysis ➞ | |
 | UPS United Parcel Service, Inc. |
| Sector: Transports | |
| SubSector: Air Delivery & Freight Services | |
| MarketCap: 81928.9 Millions | |
| Recent Price: 148.87 Smart Investing & Trading Score: 85 | |
| Day Percent Change: 2.41% Day Change: 3.51 | |
| Week Change: 4.27% Year-to-date Change: -5.3% | |
| UPS Links: Profile News Message Board | |
| Charts:- Daily , Weekly | |
| Add UPS to Watchlist: View: Get Complete UPS Trend Analysis ➞ | |
 | CL Colgate-Palmolive Company |
| Sector: Consumer Staples | |
| SubSector: Personal Products | |
| MarketCap: 57242.7 Millions | |
| Recent Price: 88.58 Smart Investing & Trading Score: 85 | |
| Day Percent Change: 0.28% Day Change: 0.25 | |
| Week Change: 1.66% Year-to-date Change: 11.1% | |
| CL Links: Profile News Message Board | |
| Charts:- Daily , Weekly | |
| Add CL to Watchlist: View: Get Complete CL Trend Analysis ➞ | |
 | COST Costco Wholesale Corporation |
| Sector: Services & Goods | |
| SubSector: Discount, Variety Stores | |
| MarketCap: 136355 Millions | |
| Recent Price: 722.68 Smart Investing & Trading Score: 80 | |
| Day Percent Change: 1.01% Day Change: 7.22 | |
| Week Change: 1.86% Year-to-date Change: 9.5% | |
| COST Links: Profile News Message Board | |
| Charts:- Daily , Weekly | |
| Add COST to Watchlist: View: Get Complete COST Trend Analysis ➞ | |
 | F Ford Motor Company |
| Sector: Consumer Staples | |
| SubSector: Auto Manufacturers - Major | |
| MarketCap: 19052.1 Millions | |
| Recent Price: 12.94 Smart Investing & Trading Score: 80 | |
| Day Percent Change: 0.47% Day Change: 0.06 | |
| Week Change: 6.59% Year-to-date Change: 6.2% | |
| F Links: Profile News Message Board | |
| Charts:- Daily , Weekly | |
| Add F to Watchlist: View: Get Complete F Trend Analysis ➞ | |
 | LMT Lockheed Martin Corporation |
| Sector: Industrials | |
| SubSector: Aerospace/Defense Products & Services | |
| MarketCap: 94116.4 Millions | |
| Recent Price: 460.08 Smart Investing & Trading Score: 78 | |
| Day Percent Change: -0.27% Day Change: -1.25 | |
| Week Change: -0.82% Year-to-date Change: 1.5% | |
| LMT Links: Profile News Message Board | |
| Charts:- Daily , Weekly | |
| Add LMT to Watchlist: View: Get Complete LMT Trend Analysis ➞ | |
 | FDX FedEx Corporation |
| Sector: Transports | |
| SubSector: Air Delivery & Freight Services | |
| MarketCap: 33188 Millions | |
| Recent Price: 271.75 Smart Investing & Trading Score: 78 | |
| Day Percent Change: 0.59% Day Change: 1.60 | |
| Week Change: 1.78% Year-to-date Change: 7.4% | |
| FDX Links: Profile News Message Board | |
| Charts:- Daily , Weekly | |
| Add FDX to Watchlist: View: Get Complete FDX Trend Analysis ➞ | |
 | XOM Exxon Mobil Corporation |
| Sector: Energy | |
| SubSector: Major Integrated Oil & Gas | |
| MarketCap: 156450 Millions | |
| Recent Price: 121.03 Smart Investing & Trading Score: 76 | |
| Day Percent Change: 0.39% Day Change: 0.47 | |
| Week Change: 0.96% Year-to-date Change: 21.1% | |
| XOM Links: Profile News Message Board | |
| Charts:- Daily , Weekly | |
| Add XOM to Watchlist: View: Get Complete XOM Trend Analysis ➞ | |
 | GD General Dynamics Corporation |
| Sector: Industrials | |
| SubSector: Aerospace/Defense Products & Services | |
| MarketCap: 37063.8 Millions | |
| Recent Price: 292.72 Smart Investing & Trading Score: 75 | |
| Day Percent Change: 0.48% Day Change: 1.41 | |
| Week Change: 1.42% Year-to-date Change: 12.7% | |
| GD Links: Profile News Message Board | |
| Charts:- Daily , Weekly | |
| Add GD to Watchlist: View: Get Complete GD Trend Analysis ➞ | |
 | MET MetLife, Inc. |
| Sector: Financials | |
| SubSector: Life Insurance | |
| MarketCap: 26272.9 Millions | |
| Recent Price: 72.22 Smart Investing & Trading Score: 75 | |
| Day Percent Change: 0.36% Day Change: 0.26 | |
| Week Change: 1.56% Year-to-date Change: 9.2% | |
| MET Links: Profile News Message Board | |
| Charts:- Daily , Weekly | |
| Add MET to Watchlist: View: Get Complete MET Trend Analysis ➞ | |
 | ABBV AbbVie Inc. |
| Sector: Health Care | |
| SubSector: Drug Manufacturers - Major | |
| MarketCap: 110080 Millions | |
| Recent Price: 169.54 Smart Investing & Trading Score: 73 | |
| Day Percent Change: 0.98% Day Change: 1.65 | |
| Week Change: 1.88% Year-to-date Change: 9.4% | |
| ABBV Links: Profile News Message Board | |
| Charts:- Daily , Weekly | |
| Add ABBV to Watchlist: View: Get Complete ABBV Trend Analysis ➞ | |
 | JPM JPMorgan Chase & Co. |
| Sector: Financials | |
| SubSector: Money Center Banks | |
| MarketCap: 279736 Millions | |
| Recent Price: 192.14 Smart Investing & Trading Score: 70 | |
| Day Percent Change: 1.44% Day Change: 2.73 | |
| Week Change: 3.41% Year-to-date Change: 13.0% | |
| JPM Links: Profile News Message Board | |
| Charts:- Daily , Weekly | |
| Add JPM to Watchlist: View: Get Complete JPM Trend Analysis ➞ | |
 | MRK Merck & Co., Inc. |
| Sector: Health Care | |
| SubSector: Drug Manufacturers - Major | |
| MarketCap: 192657 Millions | |
| Recent Price: 126.88 Smart Investing & Trading Score: 70 | |
| Day Percent Change: -0.05% Day Change: -0.06 | |
| Week Change: 0.87% Year-to-date Change: 16.4% | |
| MRK Links: Profile News Message Board | |
| Charts:- Daily , Weekly | |
| Add MRK to Watchlist: View: Get Complete MRK Trend Analysis ➞ | |
 | AIG American International Group, Inc. |
| Sector: Financials | |
| SubSector: Property & Casualty Insurance | |
| MarketCap: 21219 Millions | |
| Recent Price: 74.93 Smart Investing & Trading Score: 70 | |
| Day Percent Change: -0.04% Day Change: -0.03 | |
| Week Change: 0.94% Year-to-date Change: 10.6% | |
| AIG Links: Profile News Message Board | |
| Charts:- Daily , Weekly | |
| Add AIG to Watchlist: View: Get Complete AIG Trend Analysis ➞ | |
 | PYPL PayPal Holdings, Inc. |
| Sector: Financials | |
| SubSector: Credit Services | |
| MarketCap: 108949 Millions | |
| Recent Price: 64.43 Smart Investing & Trading Score: 68 | |
| Day Percent Change: 1.96% Day Change: 1.24 | |
| Week Change: 3.4% Year-to-date Change: 4.9% | |
| PYPL Links: Profile News Message Board | |
| Charts:- Daily , Weekly | |
| Add PYPL to Watchlist: View: Get Complete PYPL Trend Analysis ➞ | |
 | CAT Caterpillar Inc. |
| Sector: Industrials | |
| SubSector: Farm & Construction Machinery | |
| MarketCap: 58636 Millions | |
| Recent Price: 363.25 Smart Investing & Trading Score: 68 | |
| Day Percent Change: 1.58% Day Change: 5.64 | |
| Week Change: 2.42% Year-to-date Change: 22.9% | |
| CAT Links: Profile News Message Board | |
| Charts:- Daily , Weekly | |
| Add CAT to Watchlist: View: Get Complete CAT Trend Analysis ➞ | |
 | DIS The Walt Disney Company |
| Sector: Services & Goods | |
| SubSector: Entertainment - Diversified | |
| MarketCap: 178396 Millions | |
| Recent Price: 113.71 Smart Investing & Trading Score: 68 | |
| Day Percent Change: 1.54% Day Change: 1.72 | |
| Week Change: 0.98% Year-to-date Change: 25.9% | |
| DIS Links: Profile News Message Board | |
| Charts:- Daily , Weekly | |
| Add DIS to Watchlist: View: Get Complete DIS Trend Analysis ➞ | |
 | TXN Texas Instruments Incorporated |
| Sector: Technology | |
| SubSector: Semiconductor - Broad Line | |
| MarketCap: 99509.1 Millions | |
| Recent Price: 165.47 Smart Investing & Trading Score: 68 | |
| Day Percent Change: 1.25% Day Change: 2.04 | |
| Week Change: 3.63% Year-to-date Change: -2.9% | |
| TXN Links: Profile News Message Board | |
| Charts:- Daily , Weekly | |
| Add TXN to Watchlist: View: Get Complete TXN Trend Analysis ➞ | |
 | PEP PepsiCo, Inc. |
| Sector: Consumer Staples | |
| SubSector: Beverages - Soft Drinks | |
| MarketCap: 162458 Millions | |
| Recent Price: 171.22 Smart Investing & Trading Score: 66 | |
| Day Percent Change: -2.97% Day Change: -5.24 | |
| Week Change: -1.67% Year-to-date Change: 0.8% | |
| PEP Links: Profile News Message Board | |
| Charts:- Daily , Weekly | |
| Add PEP to Watchlist: View: Get Complete PEP Trend Analysis ➞ | |
 | MDLZ Mondelez International, Inc. |
| Sector: Consumer Staples | |
| SubSector: Confectioners | |
| MarketCap: 68385.8 Millions | |
| Recent Price: 70.75 Smart Investing & Trading Score: 64 | |
| Day Percent Change: 1.93% Day Change: 1.34 | |
| Week Change: 3.88% Year-to-date Change: -2.3% | |
| MDLZ Links: Profile News Message Board | |
| Charts:- Daily , Weekly | |
| Add MDLZ to Watchlist: View: Get Complete MDLZ Trend Analysis ➞ | |
 | AMGN Amgen Inc. |
| Sector: Health Care | |
| SubSector: Biotechnology | |
| MarketCap: 121030 Millions | |
| Recent Price: 273.54 Smart Investing & Trading Score: 64 | |
| Day Percent Change: 0.60% Day Change: 1.63 | |
| Week Change: 1.71% Year-to-date Change: -5.0% | |
| AMGN Links: Profile News Message Board | |
| Charts:- Daily , Weekly | |
| Add AMGN to Watchlist: View: Get Complete AMGN Trend Analysis ➞ | |
 | MCD McDonald s Corporation |
| Sector: Services & Goods | |
| SubSector: Restaurants | |
| MarketCap: 122481 Millions | |
| Recent Price: 276.88 Smart Investing & Trading Score: 64 | |
| Day Percent Change: 0.47% Day Change: 1.30 | |
| Week Change: 1.8% Year-to-date Change: -6.6% | |
| MCD Links: Profile News Message Board | |
| Charts:- Daily , Weekly | |
| Add MCD to Watchlist: View: Get Complete MCD Trend Analysis ➞ | |
 | SBUX Starbucks Corporation |
| Sector: Services & Goods | |
| SubSector: Specialty Eateries | |
| MarketCap: 74909.7 Millions | |
| Recent Price: 87.87 Smart Investing & Trading Score: 64 | |
| Day Percent Change: -0.35% Day Change: -0.31 | |
| Week Change: 0.3% Year-to-date Change: -8.5% | |
| SBUX Links: Profile News Message Board | |
| Charts:- Daily , Weekly | |
| Add SBUX to Watchlist: View: Get Complete SBUX Trend Analysis ➞ | |
 | BMY Bristol-Myers Squibb Company |
| Sector: Health Care | |
| SubSector: Drug Manufacturers - Major | |
| MarketCap: 117052 Millions | |
| Recent Price: 48.99 Smart Investing & Trading Score: 62 | |
| Day Percent Change: -0.31% Day Change: -0.15 | |
| Week Change: 0.12% Year-to-date Change: -4.5% | |
| BMY Links: Profile News Message Board | |
| Charts:- Daily , Weekly | |
| Add BMY to Watchlist: View: Get Complete BMY Trend Analysis ➞ | |
 | COP ConocoPhillips |
| Sector: Energy | |
| SubSector: Independent Oil & Gas | |
| MarketCap: 33504.3 Millions | |
| Recent Price: 129.84 Smart Investing & Trading Score: 61 | |
| Day Percent Change: 0.39% Day Change: 0.51 | |
| Week Change: 0.36% Year-to-date Change: 11.9% | |
| COP Links: Profile News Message Board | |
| Charts:- Daily , Weekly | |
| Add COP to Watchlist: View: Get Complete COP Trend Analysis ➞ | |
| For tabular summary view of above stock list: Summary View ➞ 0 - 25 , 25 - 50 , 50 - 75 , 75 - 100 , 100 - 125 | ||
| Click To Change The Sort Order: By Market Cap or Company Size Performance: Year-to-date, Week and Day | |
| Select Chart Type: | ||
|
Best Stocks Today 12Stocks.com |
� 2024 12Stocks.com Terms & Conditions Privacy Contact Us
All Information Provided Only For Education And Not To Be Used For Investing or Trading. See Terms & Conditions


One More Thing ... Get Best Stocks Delivered Daily!
Never Ever Miss A Move With Our Top Ten Stocks Lists
Find Best Stocks In Any Market - Bull or Bear Market
Take A Peek At Our Top Ten Stocks Lists: Daily, Weekly, Year-to-Date & Top Trends
Find Best Stocks In Any Market - Bull or Bear Market
Take A Peek At Our Top Ten Stocks Lists: Daily, Weekly, Year-to-Date & Top Trends
S&P 100 Stocks With Best Up Trends [0-bearish to 100-bullish]: Danaher [100], Philip Morris[100], Citi [100], American Express[100], Morgan Stanley[100], Bank of America[100], Goldman Sachs[100], NextEra Energy[100], Charles Schwab[100], Altria [100], Procter & Gamble[100]
Best S&P 100 Stocks Year-to-Date:
NVIDIA [66.44%], Meta Platforms[40.09%], Eli Lilly[27.92%], American Express[27.55%], General Electric[27.42%], Walt Disney[25.94%], General Motors[25.56%], Wells Fargo[23.81%], Caterpillar [22.86%], Citi [21.83%], Exxon Mobil[21.05%] Best S&P 100 Stocks This Week:
General Electric[9.83%], NVIDIA [8.17%], Danaher [7.47%], Ford Motor[6.59%], General Motors[6.44%], Citi [5.97%], Thermo Fisher[5.47%], Goldman Sachs[4.95%], United Parcel[4.27%], Philip Morris[4.15%], Netflix [4.09%] Best S&P 100 Stocks Daily:
General Electric[8.28%], Danaher [7.21%], Thermo Fisher[4.78%], General Motors[4.37%], Netflix [4.17%], Philip Morris[3.83%], NVIDIA [3.65%], Meta Platforms[2.95%], Verizon [2.85%], Citi [2.82%], American Express[2.56%]