
 Login Sign Up


| |||||
 |  | ||||

| 12Stocks.com Market Intelligence |
Best Healthcare Stocks
 | "Discover best trending healthcare stocks with 12Stocks.com." |
| - Subu Vdaygiri, Founder, 12Stocks.com |
| In a hurry? Healthcare Stocks Lists: Performance Trends Table, Stock Charts
Sort Healthcare stocks: Daily, Weekly, Year-to-Date, Market Cap & Trends. Filter Healthcare stocks list by size:All Healthcare Large Mid-Range Small |
| 12Stocks.com Healthcare Stocks Performances & Trends Daily | |||||||||
|
|  The overall Smart Investing & Trading Score is 38 (0-bearish to 100-bullish) which puts Healthcare sector in short term bearish to neutral trend. The Smart Investing & Trading Score from previous trading session is 52 and hence a deterioration of trend.
| ||||||||
Here are the Smart Investing & Trading Scores of the most requested Healthcare stocks at 12Stocks.com (click stock name for detailed review):
|


| 12Stocks.com: Investing in Healthcare sector with Stocks | |
|
The following table helps investors and traders sort through current performance and trends (as measured by Smart Investing & Trading Score) of various
stocks in the Healthcare sector. Quick View: Move mouse or cursor over stock symbol (ticker) to view short-term Technical chart and over stock name to view long term chart. Click on  to add stock symbol to your watchlist and to add stock symbol to your watchlist and  to view watchlist. Click on any ticker or stock name for detailed market intelligence report for that stock. to view watchlist. Click on any ticker or stock name for detailed market intelligence report for that stock. |
12Stocks.com Performance of Stocks in Healthcare Sector
| Ticker | Stock Name | Watchlist | Category | Recent Price | Smart Investing & Trading Score | Change % | YTD Change% |
| XAIR | Beyond Air |   | Equipment | 1.16 | 20 | -9.77% | -41.07% |
| SLRN | Acelyrin | | Biotechnology | 4.24 | 20 | -8.62% | -42.47% |
| RVNC | Revance | | Biotechnology | 3.29 | 20 | -7.84% | -62.57% |
| EGRX | Eagle | | Pharmaceutical | 4.24 | 20 | -6.81% | -18.93% |
| AKRO | Akero | | Biotechnology | 18.91 | 20 | -6.64% | -18.99% |
| RCKT | Rocket | | Biotechnology | 22.13 | 20 | -6.35% | -26.16% |
| DYN | Dyne | | Biotechnology | 23.70 | 20 | -5.14% | 78.16% |
| VIR | Vir Biotechnology | | Biotechnology | 7.63 | 20 | -5.10% | -24.16% |
| APTO | Aptose Biosciences | | Biotechnology | 1.16 | 20 | -4.92% | -54.33% |
| AVNS | Avanos | | Instruments | 17.85 | 20 | -4.60% | -20.42% |
| RYTM | Rhythm | | Biotechnology | 38.19 | 20 | -3.83% | -16.92% |
| ORMP | Oramed | | Biotechnology | 2.30 | 20 | -2.95% | -0.43% |
| NAUT | Nautilus Biotechnology | | Biotechnology | 2.36 | 20 | -2.88% | -28.27% |
| SEER | Seer | | Biotechnology | 1.73 | 20 | -2.81% | -11.28% |
| BBIO | BridgeBio Pharma | | Biotechnology | 24.35 | 20 | -2.72% | -39.68% |
| VVOS | Vivos | | Medical Devices | 2.51 | 20 | -2.71% | -79.81% |
| MNOV | MediciNova | | Biotechnology | 1.32 | 20 | -2.58% | -12.00% |
| STRO | Sutro Biopharma | | Biotechnology | 3.41 | 20 | -1.73% | -20.51% |
| ARGX | argenx SE | | Biotechnology | 368.55 | 20 | -1.72% | -3.12% |
| PCRX | Pacira BioSciences | | Pharmaceutical | 25.50 | 20 | -1.54% | -24.42% |
| UTMD | Utah | | Instruments | 66.29 | 20 | -1.30% | -21.29% |
| AFIB | Acutus | | Medical Devices | 0.17 | 20 | -1.30% | -19.38% |
| KALA | Kala | | Biotechnology | 6.32 | 20 | -1.25% | -9.71% |
| ALLK | Allakos | | Biotechnology | 1.01 | 20 | -0.98% | -63.00% |
| LGND | Ligand | | Biotechnology | 70.37 | 20 | -0.89% | -1.47% |
| For chart view version of above stock list: Chart View ➞ 0 - 25 , 25 - 50 , 50 - 75 , 75 - 100 , 100 - 125 , 125 - 150 , 150 - 175 , 175 - 200 , 200 - 225 , 225 - 250 , 250 - 275 , 275 - 300 , 300 - 325 , 325 - 350 , 350 - 375 , 375 - 400 , 400 - 425 , 425 - 450 , 450 - 475 , 475 - 500 , 500 - 525 , 525 - 550 , 550 - 575 , 575 - 600 , 600 - 625 , 625 - 650 , 650 - 675 , 675 - 700 , 700 - 725 | ||
 | Click To Change The Sort Order: By Market Cap or Company Size Performance: Year-to-date, Week and Day |  |
|
Get the most comprehensive stock market coverage daily at 12Stocks.com ➞ Best Stocks Today ➞ Best Stocks Weekly ➞ Best Stocks Year-to-Date ➞ Best Stocks Trends ➞  Best Stocks Today 12Stocks.com Best Nasdaq Stocks ➞ Best S&P 500 Stocks ➞ Best Tech Stocks ➞ Best Biotech Stocks ➞ |
| Detailed Overview of Healthcare Stocks |
| Healthcare Technical Overview, Leaders & Laggards, Top Healthcare ETF Funds & Detailed Healthcare Stocks List, Charts, Trends & More |
| Healthcare Sector: Technical Analysis, Trends & YTD Performance | |
| Healthcare sector is composed of stocks
from pharmaceutical, biotech, diagnostics labs, insurance providers
and healthcare services. Healthcare sector, as represented by XLV, an exchange-traded fund [ETF] that holds basket of Healthcare stocks (e.g, Merck, Amgen) is up by 2.6% and is currently underperforming the overall market by -2.56% year-to-date. Below is a quick view of Technical charts and trends: |
|
 XLV Weekly Chart |
|
| Long Term Trend: Not Good | |
| Medium Term Trend: Not Good | |
 XLV Daily Chart |
|
| Short Term Trend: Very Good | |
| Overall Trend Score: 38 | |
| YTD Performance: 2.6% | |
| **Trend Scores & Views Are Only For Educational Purposes And Not For Investing | |
| 12Stocks.com: Top Performing Healthcare Sector Stocks | ||||||||||||||||||||||||||||||||||||||||||||||||
 The top performing Healthcare sector stocks year to date are
Now, more recently, over last week, the top performing Healthcare sector stocks on the move are


|
||||||||||||||||||||||||||||||||||||||||||||||||
| 12Stocks.com: Investing in Healthcare Sector using Exchange Traded Funds | |
|
The following table shows list of key exchange traded funds (ETF) that
help investors track Healthcare Index. For detailed view, check out our ETF Funds section of our website. Quick View: Move mouse or cursor over ETF symbol (ticker) to view short-term Technical chart and over ETF name to view long term chart. Click on ticker or stock name for detailed view. Click on to add stock symbol to your watchlist and to view watchlist. |
12Stocks.com List of ETFs that track Healthcare Index
| Ticker | ETF Name | Watchlist | Recent Price | Smart Investing & Trading Score | Change % | Week % | Year-to-date % |
| XLV | Health Care | | 139.92 | 38 | -0.67 | 0.7 | 2.6% |
| XBI | Biotech | | 82.22 | 25 | -2.05 | -0.74 | -7.92% |
| IBB | Biotechnology | | 125.67 | 18 | -1.64 | 0.76 | -7.49% |
| BBH | Biotech | | 154.61 | 49 | -1.73 | 1.48 | -6.47% |
| VHT | Health Care | | 255.24 | 45 | -0.79 | 0.75 | 1.81% |
| IYH | Healthcare | | 58.68 | 45 | -0.69 | 0.89 | 2.5% |
| IHF | Healthcare Providers | | 52.11 | 55 | -0.29 | -0.19 | -0.76% |
| IHI | Medical Devices | | 55.27 | 43 | -0.66 | 1.67 | 2.41% |
| BIB | Biotechnology | | 48.83 | 32 | -2.69 | 1.31 | -14.41% |
| BIS | Short Biotech | | 20.59 | 61 | 2.49 | -1.46 | 13.95% |
| XHE | Health Care Equipment | | 81.77 | 28 | -1.73 | 0.62 | -2.96% |
| CURE | Healthcare Bull 3X | | 105.32 | 25 | -2.35 | 1.92 | 3.52% |
| LABU | Biotech Bull 3X | | 83.72 | 25 | -6.35 | -2.71 | -31.36% |
| LABD | Biotech Bear 3X | | 11.03 | 75 | 6.36 | 2.13 | 13.83% |
| PSCH | SmallCap Health Care | | 40.31 | 35 | -1.98 | 0.32 | -5.82% |
| XHS | Health Care Services | | 87.68 | 68 | -1.15 | 0.68 | -1.43% |
| PTH | DWA Healthcare Momentum | | 39.60 | 46 | -0.08 | 0.18 | 1.18% |
| BTEC | Principal Healthcare Innovators | | 34.21 | 32 | 0.02 | 1.04 | -5.83% |
| RXL | Health Care | | 94.52 | 17 | -1.55 | 1.39 | 3.41% |
| RXD | Short Health Care | | 11.46 | 71 | 0.98 | -1.59 | -3.94% |
| 12Stocks.com: Charts, Trends, Fundamental Data and Performances of Healthcare Stocks | |
|
We now take in-depth look at all Healthcare stocks including charts, multi-period performances and overall trends (as measured by Smart Investing & Trading Score). One can sort Healthcare stocks (click link to choose) by Daily, Weekly and by Year-to-Date performances. Also, one can sort by size of the company or by market capitalization. |
| Select Your Default Chart Type: | |||||
| |||||
| Click on stock symbol or name for detailed view. Click on to add stock symbol to your watchlist and to view watchlist. Quick View: Move mouse or cursor over "Daily" to quickly view daily Technical stock chart and over "Weekly" to view weekly Technical stock chart. | |||||

 | XAIR Beyond Air, Inc. |
| Sector: Health Care | |
| SubSector: Medical Appliances & Equipment | |
| MarketCap: 132.48 Millions | |
| Recent Price: 1.16 Smart Investing & Trading Score: 20 | |
| Day Percent Change: -9.77% Day Change: -0.13 | |
| Week Change: -5.33% Year-to-date Change: -41.1% | |
| XAIR Links: Profile News Message Board | |
| Charts:- Daily , Weekly | |
| Add XAIR to Watchlist: View: Get Complete XAIR Trend Analysis ➞ | |
 | SLRN Acelyrin, Inc. |
| Sector: Health Care | |
| SubSector: Biotechnology | |
| MarketCap: 2030 Millions | |
| Recent Price: 4.24 Smart Investing & Trading Score: 20 | |
| Day Percent Change: -8.62% Day Change: -0.40 | |
| Week Change: -15.37% Year-to-date Change: -42.5% | |
| SLRN Links: Profile News Message Board | |
| Charts:- Daily , Weekly | |
| Add SLRN to Watchlist: View: Get Complete SLRN Trend Analysis ➞ | |
 | RVNC Revance Therapeutics, Inc. |
| Sector: Health Care | |
| SubSector: Biotechnology | |
| MarketCap: 854.185 Millions | |
| Recent Price: 3.29 Smart Investing & Trading Score: 20 | |
| Day Percent Change: -7.84% Day Change: -0.28 | |
| Week Change: -12.96% Year-to-date Change: -62.6% | |
| RVNC Links: Profile News Message Board | |
| Charts:- Daily , Weekly | |
| Add RVNC to Watchlist: View: Get Complete RVNC Trend Analysis ➞ | |
 | EGRX Eagle Pharmaceuticals, Inc. |
| Sector: Health Care | |
| SubSector: Drugs - Generic | |
| MarketCap: 573.385 Millions | |
| Recent Price: 4.24 Smart Investing & Trading Score: 20 | |
| Day Percent Change: -6.81% Day Change: -0.31 | |
| Week Change: -8.03% Year-to-date Change: -18.9% | |
| EGRX Links: Profile News Message Board | |
| Charts:- Daily , Weekly | |
| Add EGRX to Watchlist: View: Get Complete EGRX Trend Analysis ➞ | |
 | AKRO Akero Therapeutics, Inc. |
| Sector: Health Care | |
| SubSector: Biotechnology | |
| MarketCap: 675.085 Millions | |
| Recent Price: 18.91 Smart Investing & Trading Score: 20 | |
| Day Percent Change: -6.64% Day Change: -1.35 | |
| Week Change: -8.89% Year-to-date Change: -19.0% | |
| AKRO Links: Profile News Message Board | |
| Charts:- Daily , Weekly | |
| Add AKRO to Watchlist: View: Get Complete AKRO Trend Analysis ➞ | |
 | RCKT Rocket Pharmaceuticals, Inc. |
| Sector: Health Care | |
| SubSector: Biotechnology | |
| MarketCap: 899.585 Millions | |
| Recent Price: 22.13 Smart Investing & Trading Score: 20 | |
| Day Percent Change: -6.35% Day Change: -1.50 | |
| Week Change: -3.02% Year-to-date Change: -26.2% | |
| RCKT Links: Profile News Message Board | |
| Charts:- Daily , Weekly | |
| Add RCKT to Watchlist: View: Get Complete RCKT Trend Analysis ➞ | |
 | DYN Dyne Therapeutics, Inc. |
| Sector: Health Care | |
| SubSector: Biotechnology | |
| MarketCap: 88487 Millions | |
| Recent Price: 23.70 Smart Investing & Trading Score: 20 | |
| Day Percent Change: -5.14% Day Change: -1.29 | |
| Week Change: -0.69% Year-to-date Change: 78.2% | |
| DYN Links: Profile News Message Board | |
| Charts:- Daily , Weekly | |
| Add DYN to Watchlist: View: Get Complete DYN Trend Analysis ➞ | |
 | VIR Vir Biotechnology, Inc. |
| Sector: Health Care | |
| SubSector: Biotechnology | |
| MarketCap: 3916.75 Millions | |
| Recent Price: 7.63 Smart Investing & Trading Score: 20 | |
| Day Percent Change: -5.10% Day Change: -0.41 | |
| Week Change: -4.15% Year-to-date Change: -24.2% | |
| VIR Links: Profile News Message Board | |
| Charts:- Daily , Weekly | |
| Add VIR to Watchlist: View: Get Complete VIR Trend Analysis ➞ | |
 | APTO Aptose Biosciences Inc. |
| Sector: Health Care | |
| SubSector: Biotechnology | |
| MarketCap: 484.585 Millions | |
| Recent Price: 1.16 Smart Investing & Trading Score: 20 | |
| Day Percent Change: -4.92% Day Change: -0.06 | |
| Week Change: -5.77% Year-to-date Change: -54.3% | |
| APTO Links: Profile News Message Board | |
| Charts:- Daily , Weekly | |
| Add APTO to Watchlist: View: Get Complete APTO Trend Analysis ➞ | |
 | AVNS Avanos Medical, Inc. |
| Sector: Health Care | |
| SubSector: Medical Instruments & Supplies | |
| MarketCap: 1229.6 Millions | |
| Recent Price: 17.85 Smart Investing & Trading Score: 20 | |
| Day Percent Change: -4.60% Day Change: -0.86 | |
| Week Change: -4.6% Year-to-date Change: -20.4% | |
| AVNS Links: Profile News Message Board | |
| Charts:- Daily , Weekly | |
| Add AVNS to Watchlist: View: Get Complete AVNS Trend Analysis ➞ | |
 | RYTM Rhythm Pharmaceuticals, Inc. |
| Sector: Health Care | |
| SubSector: Biotechnology | |
| MarketCap: 643.685 Millions | |
| Recent Price: 38.19 Smart Investing & Trading Score: 20 | |
| Day Percent Change: -3.83% Day Change: -1.52 | |
| Week Change: 0.57% Year-to-date Change: -16.9% | |
| RYTM Links: Profile News Message Board | |
| Charts:- Daily , Weekly | |
| Add RYTM to Watchlist: View: Get Complete RYTM Trend Analysis ➞ | |
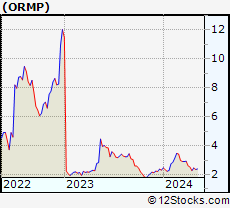 | ORMP Oramed Pharmaceuticals Inc. |
| Sector: Health Care | |
| SubSector: Biotechnology | |
| MarketCap: 73.7785 Millions | |
| Recent Price: 2.30 Smart Investing & Trading Score: 20 | |
| Day Percent Change: -2.95% Day Change: -0.07 | |
| Week Change: 1.32% Year-to-date Change: -0.4% | |
| ORMP Links: Profile News Message Board | |
| Charts:- Daily , Weekly | |
| Add ORMP to Watchlist: View: Get Complete ORMP Trend Analysis ➞ | |
 | NAUT Nautilus Biotechnology, Inc. |
| Sector: Health Care | |
| SubSector: Biotechnology | |
| MarketCap: 458 Millions | |
| Recent Price: 2.36 Smart Investing & Trading Score: 20 | |
| Day Percent Change: -2.88% Day Change: -0.07 | |
| Week Change: -4.07% Year-to-date Change: -28.3% | |
| NAUT Links: Profile News Message Board | |
| Charts:- Daily , Weekly | |
| Add NAUT to Watchlist: View: Get Complete NAUT Trend Analysis ➞ | |
 | SEER Seer, Inc. |
| Sector: Health Care | |
| SubSector: Biotechnology | |
| MarketCap: 48287 Millions | |
| Recent Price: 1.73 Smart Investing & Trading Score: 20 | |
| Day Percent Change: -2.81% Day Change: -0.05 | |
| Week Change: 1.17% Year-to-date Change: -11.3% | |
| SEER Links: Profile News Message Board | |
| Charts:- Daily , Weekly | |
| Add SEER to Watchlist: View: Get Complete SEER Trend Analysis ➞ | |
 | BBIO BridgeBio Pharma, Inc. |
| Sector: Health Care | |
| SubSector: Biotechnology | |
| MarketCap: 3879.35 Millions | |
| Recent Price: 24.35 Smart Investing & Trading Score: 20 | |
| Day Percent Change: -2.72% Day Change: -0.68 | |
| Week Change: -1.58% Year-to-date Change: -39.7% | |
| BBIO Links: Profile News Message Board | |
| Charts:- Daily , Weekly | |
| Add BBIO to Watchlist: View: Get Complete BBIO Trend Analysis ➞ | |
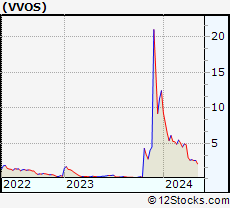 | VVOS Vivos Therapeutics, Inc. |
| Sector: Health Care | |
| SubSector: Medical Devices | |
| MarketCap: 21487 Millions | |
| Recent Price: 2.51 Smart Investing & Trading Score: 20 | |
| Day Percent Change: -2.71% Day Change: -0.07 | |
| Week Change: -7.72% Year-to-date Change: -79.8% | |
| VVOS Links: Profile News Message Board | |
| Charts:- Daily , Weekly | |
| Add VVOS to Watchlist: View: Get Complete VVOS Trend Analysis ➞ | |
 | MNOV MediciNova, Inc. |
| Sector: Health Care | |
| SubSector: Biotechnology | |
| MarketCap: 137.685 Millions | |
| Recent Price: 1.32 Smart Investing & Trading Score: 20 | |
| Day Percent Change: -2.58% Day Change: -0.03 | |
| Week Change: -5.04% Year-to-date Change: -12.0% | |
| MNOV Links: Profile News Message Board | |
| Charts:- Daily , Weekly | |
| Add MNOV to Watchlist: View: Get Complete MNOV Trend Analysis ➞ | |
 | STRO Sutro Biopharma, Inc. |
| Sector: Health Care | |
| SubSector: Biotechnology | |
| MarketCap: 196.485 Millions | |
| Recent Price: 3.41 Smart Investing & Trading Score: 20 | |
| Day Percent Change: -1.73% Day Change: -0.06 | |
| Week Change: -6.19% Year-to-date Change: -20.5% | |
| STRO Links: Profile News Message Board | |
| Charts:- Daily , Weekly | |
| Add STRO to Watchlist: View: Get Complete STRO Trend Analysis ➞ | |
 | ARGX argenx SE |
| Sector: Health Care | |
| SubSector: Biotechnology | |
| MarketCap: 5077.05 Millions | |
| Recent Price: 368.55 Smart Investing & Trading Score: 20 | |
| Day Percent Change: -1.72% Day Change: -6.45 | |
| Week Change: 2.34% Year-to-date Change: -3.1% | |
| ARGX Links: Profile News Message Board | |
| Charts:- Daily , Weekly | |
| Add ARGX to Watchlist: View: Get Complete ARGX Trend Analysis ➞ | |
 | PCRX Pacira BioSciences, Inc. |
| Sector: Health Care | |
| SubSector: Drugs - Generic | |
| MarketCap: 1403.95 Millions | |
| Recent Price: 25.50 Smart Investing & Trading Score: 20 | |
| Day Percent Change: -1.54% Day Change: -0.40 | |
| Week Change: -2.86% Year-to-date Change: -24.4% | |
| PCRX Links: Profile News Message Board | |
| Charts:- Daily , Weekly | |
| Add PCRX to Watchlist: View: Get Complete PCRX Trend Analysis ➞ | |
 | UTMD Utah Medical Products, Inc. |
| Sector: Health Care | |
| SubSector: Medical Instruments & Supplies | |
| MarketCap: 285.86 Millions | |
| Recent Price: 66.29 Smart Investing & Trading Score: 20 | |
| Day Percent Change: -1.30% Day Change: -0.87 | |
| Week Change: -3.34% Year-to-date Change: -21.3% | |
| UTMD Links: Profile News Message Board | |
| Charts:- Daily , Weekly | |
| Add UTMD to Watchlist: View: Get Complete UTMD Trend Analysis ➞ | |
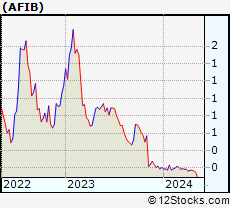 | AFIB Acutus Medical, Inc. |
| Sector: Health Care | |
| SubSector: Medical Devices | |
| MarketCap: 83487 Millions | |
| Recent Price: 0.17 Smart Investing & Trading Score: 20 | |
| Day Percent Change: -1.30% Day Change: 0.00 | |
| Week Change: -4.14% Year-to-date Change: -19.4% | |
| AFIB Links: Profile News Message Board | |
| Charts:- Daily , Weekly | |
| Add AFIB to Watchlist: View: Get Complete AFIB Trend Analysis ➞ | |
 | KALA Kala Pharmaceuticals, Inc. |
| Sector: Health Care | |
| SubSector: Biotechnology | |
| MarketCap: 276.485 Millions | |
| Recent Price: 6.32 Smart Investing & Trading Score: 20 | |
| Day Percent Change: -1.25% Day Change: -0.08 | |
| Week Change: -7.2% Year-to-date Change: -9.7% | |
| KALA Links: Profile News Message Board | |
| Charts:- Daily , Weekly | |
| Add KALA to Watchlist: View: Get Complete KALA Trend Analysis ➞ | |
 | ALLK Allakos Inc. |
| Sector: Health Care | |
| SubSector: Biotechnology | |
| MarketCap: 3233.55 Millions | |
| Recent Price: 1.01 Smart Investing & Trading Score: 20 | |
| Day Percent Change: -0.98% Day Change: -0.01 | |
| Week Change: -5.16% Year-to-date Change: -63.0% | |
| ALLK Links: Profile News Message Board | |
| Charts:- Daily , Weekly | |
| Add ALLK to Watchlist: View: Get Complete ALLK Trend Analysis ➞ | |
 | LGND Ligand Pharmaceuticals Incorporated |
| Sector: Health Care | |
| SubSector: Biotechnology | |
| MarketCap: 1344.45 Millions | |
| Recent Price: 70.37 Smart Investing & Trading Score: 20 | |
| Day Percent Change: -0.89% Day Change: -0.63 | |
| Week Change: -2.9% Year-to-date Change: -1.5% | |
| LGND Links: Profile News Message Board | |
| Charts:- Daily , Weekly | |
| Add LGND to Watchlist: View: Get Complete LGND Trend Analysis ➞ | |
| For tabular summary view of above stock list: Summary View ➞ 0 - 25 , 25 - 50 , 50 - 75 , 75 - 100 , 100 - 125 , 125 - 150 , 150 - 175 , 175 - 200 , 200 - 225 , 225 - 250 , 250 - 275 , 275 - 300 , 300 - 325 , 325 - 350 , 350 - 375 , 375 - 400 , 400 - 425 , 425 - 450 , 450 - 475 , 475 - 500 , 500 - 525 , 525 - 550 , 550 - 575 , 575 - 600 , 600 - 625 , 625 - 650 , 650 - 675 , 675 - 700 , 700 - 725 | ||
| Click To Change The Sort Order: By Market Cap or Company Size Performance: Year-to-date, Week and Day | |
| Select Chart Type: | ||
|
Best Stocks Today 12Stocks.com |
© 2024 12Stocks.com Terms & Conditions Privacy Contact Us
All Information Provided Only For Education And Not To Be Used For Investing or Trading. See Terms & Conditions


One More Thing ... Get Best Stocks Delivered Daily!
Never Ever Miss A Move With Our Top Ten Stocks Lists
Find Best Stocks In Any Market - Bull or Bear Market
Take A Peek At Our Top Ten Stocks Lists: Daily, Weekly, Year-to-Date & Top Trends
Find Best Stocks In Any Market - Bull or Bear Market
Take A Peek At Our Top Ten Stocks Lists: Daily, Weekly, Year-to-Date & Top Trends
Healthcare Stocks With Best Up Trends [0-bearish to 100-bullish]: AstraZeneca [100], Merck [100], Annovis Bio[100], Haemonetics [100], Tandem Diabetes[100], Boston Scientific[100], Agios [100], Agenus [95], Mesoblast [95], Cullinan Oncology[93], Avadel [93]
Best Healthcare Stocks Year-to-Date:
Pieris [6273.63%], Precision BioSciences[2590.41%], Inovio [1885.29%], Assembly Biosciences[1529.07%], Aurora Cannabis[1311.17%], NuCana [1198.17%], Adverum Biotechnologies[1147.34%], Agenus [902.54%], Affimed N.V[680.8%], CareMax [490.72%], Mesoblast [459.09%] Best Healthcare Stocks This Week:
Pieris [7900%], Agenus [56.31%], VolitionRx [44.5%], ProKidney [32.84%], Seres [32.65%], Annovis Bio[30%], BeyondSpring [26.11%], Cullinan Oncology[22.92%], Pharvaris N.V[18.84%], OptiNose [18.42%], GeneDx [18.15%] Best Healthcare Stocks Daily:
OptiNose [14.56%], Galera [13.74%], Agenus [11.86%], VolitionRx [11.26%], ADiTx [10.57%], Apollomics [9.94%], Pharming [9.06%], Structure [8.13%], Pharvaris N.V[7.91%], ProKidney [7.75%], Community Health[7.26%]