
 Login Sign Up


| |||||
 |  | ||||

| 12Stocks.com Market Intelligence |
Best Healthcare Stocks
 | "Discover best trending healthcare stocks with 12Stocks.com." |
| - Subu Vdaygiri, Founder, 12Stocks.com |
| In a hurry? Healthcare Stocks Lists: Performance Trends Table, Stock Charts
Sort Healthcare stocks: Daily, Weekly, Year-to-Date, Market Cap & Trends. Filter Healthcare stocks list by size:All Healthcare Large Mid-Range Small |
| 12Stocks.com Healthcare Stocks Performances & Trends Daily | |||||||||
|
|  The overall Smart Investing & Trading Score is 38 (0-bearish to 100-bullish) which puts Healthcare sector in short term bearish to neutral trend. The Smart Investing & Trading Score from previous trading session is 25 and hence an improvement of trend.
| ||||||||
Here are the Smart Investing & Trading Scores of the most requested Healthcare stocks at 12Stocks.com (click stock name for detailed review):
|


| 12Stocks.com: Investing in Healthcare sector with Stocks | |
|
The following table helps investors and traders sort through current performance and trends (as measured by Smart Investing & Trading Score) of various
stocks in the Healthcare sector. Quick View: Move mouse or cursor over stock symbol (ticker) to view short-term Technical chart and over stock name to view long term chart. Click on  to add stock symbol to your watchlist and to add stock symbol to your watchlist and  to view watchlist. Click on any ticker or stock name for detailed market intelligence report for that stock. to view watchlist. Click on any ticker or stock name for detailed market intelligence report for that stock. |
12Stocks.com Performance of Stocks in Healthcare Sector
| Ticker | Stock Name | Watchlist | Category | Recent Price | Smart Investing & Trading Score | Change % | YTD Change% |
| VRTX | Vertex |   | Biotechnology | 399.92 | 49 | 1.43% | -1.71% |
| TAK | Takeda | | Pharmaceutical | 13.36 | 49 | 0.91% | -6.38% |
| JNJ | Johnson & Johnson | | Pharmaceutical | 149.12 | 49 | 0.82% | -4.86% |
| DVAX | Dynavax Technologies | | Biotechnology | 11.84 | 49 | 0.34% | -15.31% |
| USNA | USANA Health | | Pharmaceutical | 44.23 | 49 | 0.23% | -17.48% |
| NHC | National | | Long-Term | 89.99 | 49 | -0.70% | -2.63% |
| ASND | Ascendis Pharma | | Biotechnology | 142.10 | 49 | 1.38% | 12.82% |
| PRLD | Prelude | | Biotechnology | 3.85 | 48 | 7.84% | -11.49% |
| SANA | Sana Biotechnology | | Biotechnology | 7.93 | 48 | 4.20% | 91.78% |
| VCEL | Vericel | | Biotechnology | 45.43 | 48 | 3.86% | 27.58% |
| EQ | Equillium | | Biotechnology | 1.65 | 48 | 1.23% | 126.03% |
| MEDP | Medpace | | Laboratories | 376.26 | 48 | 1.18% | 22.75% |
| CRNX | Crinetics | | Biotechnology | 43.44 | 48 | 1.07% | 22.09% |
| ANGO | AngioDynamics | | Instruments | 6.26 | 48 | 0.00% | -20.15% |
| IOVA | Iovance Bio | | Biotechnology | 11.32 | 48 | 0.00% | 39.24% |
| VNDA | Vanda | | Biotechnology | 4.80 | 48 | -6.07% | 13.74% |
| IMAB | I Mab | | Biotechnology | 1.80 | 48 | -0.55% | -5.26% |
| MTD | Mettler-Toledo | | Instruments | 1199.46 | 48 | 0.92% | -1.11% |
| ADPT | Adaptive Biotechnologies | | Biotechnology | 2.52 | 47 | 5.00% | -48.57% |
| SLGL | Sol-Gel Technologies | | Biotechnology | 0.94 | 47 | 3.88% | -15.38% |
| DH | Definitive | | Health Information | 7.33 | 47 | 3.82% | -27.21% |
| CLLS | Cellectis S.A | | Biotechnology | 2.64 | 47 | 3.53% | -14.29% |
| CTSO | Cytosorbents | | Laboratories | 0.82 | 47 | 2.09% | -26.23% |
| ASRT | Assertio | | Pharmaceutical | 0.87 | 47 | 13.48% | -19.88% |
| ALHC | Alignment | | Healthcare Plans | 5.01 | 47 | -3.65% | -43.39% |
| For chart view version of above stock list: Chart View ➞ 0 - 25 , 25 - 50 , 50 - 75 , 75 - 100 , 100 - 125 , 125 - 150 , 150 - 175 , 175 - 200 , 200 - 225 , 225 - 250 , 250 - 275 , 275 - 300 , 300 - 325 , 325 - 350 , 350 - 375 , 375 - 400 , 400 - 425 , 425 - 450 , 450 - 475 , 475 - 500 , 500 - 525 , 525 - 550 , 550 - 575 , 575 - 600 , 600 - 625 , 625 - 650 , 650 - 675 , 675 - 700 , 700 - 725 | ||
 | Click To Change The Sort Order: By Market Cap or Company Size Performance: Year-to-date, Week and Day |  |
|
Get the most comprehensive stock market coverage daily at 12Stocks.com ➞ Best Stocks Today ➞ Best Stocks Weekly ➞ Best Stocks Year-to-Date ➞ Best Stocks Trends ➞  Best Stocks Today 12Stocks.com Best Nasdaq Stocks ➞ Best S&P 500 Stocks ➞ Best Tech Stocks ➞ Best Biotech Stocks ➞ |
| Detailed Overview of Healthcare Stocks |
| Healthcare Technical Overview, Leaders & Laggards, Top Healthcare ETF Funds & Detailed Healthcare Stocks List, Charts, Trends & More |
| Healthcare Sector: Technical Analysis, Trends & YTD Performance | |
| Healthcare sector is composed of stocks
from pharmaceutical, biotech, diagnostics labs, insurance providers
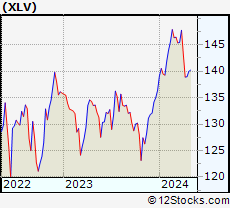
and healthcare services. Healthcare sector, as represented by XLV, an exchange-traded fund [ETF] that holds basket of Healthcare stocks (e.g, Merck, Amgen) is up by 2.27% and is currently underperforming the overall market by -2.12% year-to-date. Below is a quick view of Technical charts and trends: |
|
 XLV Weekly Chart |
|
| Long Term Trend: Not Good | |
| Medium Term Trend: Not Good | |
 XLV Daily Chart |
|
| Short Term Trend: Very Good | |
| Overall Trend Score: 38 | |
| YTD Performance: 2.27% | |
| **Trend Scores & Views Are Only For Educational Purposes And Not For Investing | |
| 12Stocks.com: Top Performing Healthcare Sector Stocks | ||||||||||||||||||||||||||||||||||||||||||||||||
 The top performing Healthcare sector stocks year to date are
Now, more recently, over last week, the top performing Healthcare sector stocks on the move are


|
||||||||||||||||||||||||||||||||||||||||||||||||
| 12Stocks.com: Investing in Healthcare Sector using Exchange Traded Funds | |
|
The following table shows list of key exchange traded funds (ETF) that
help investors track Healthcare Index. For detailed view, check out our ETF Funds section of our website. Quick View: Move mouse or cursor over ETF symbol (ticker) to view short-term Technical chart and over ETF name to view long term chart. Click on ticker or stock name for detailed view. Click on to add stock symbol to your watchlist and to view watchlist. |
12Stocks.com List of ETFs that track Healthcare Index
| Ticker | ETF Name | Watchlist | Recent Price | Smart Investing & Trading Score | Change % | Week % | Year-to-date % |
| XLV | Health Care | | 139.48 | 38 | 0.38 | 0.38 | 2.27% |
| XBI | Biotech | | 82.81 | 10 | -0.03 | -0.03 | -7.26% |
| IBB | Biotechnology | | 126.11 | 25 | 1.11 | 1.11 | -7.17% |
| BBH | Biotech | | 154.56 | 32 | 1.44 | 1.44 | -6.5% |
| VHT | Health Care | | 254.53 | 25 | 0.47 | 0.47 | 1.53% |
| IYH | Healthcare | | 58.43 | 38 | 0.46 | 0.46 | 2.06% |
| IHF | Healthcare Providers | | 52.08 | 70 | -0.26 | -0.26 | -0.83% |
| IHI | Medical Devices | | 54.70 | 23 | 0.63 | 0.63 | 1.35% |
| BIB | Biotechnology | | 49.10 | 25 | 1.87 | 1.87 | -13.94% |
| BIS | Short Biotech | | 20.47 | 76 | -2.03 | -2.03 | 13.28% |
| XHE | Health Care Equipment | | 81.68 | 28 | 0.50 | 0.5 | -3.06% |
| CURE | Healthcare Bull 3X | | 104.45 | 32 | 1.08 | 1.08 | 2.66% |
| LABU | Biotech Bull 3X | | 86.43 | 10 | 0.44 | 0.44 | -29.14% |
| LABD | Biotech Bear 3X | | 10.75 | 95 | -0.46 | -0.46 | 10.94% |
| PSCH | SmallCap Health Care | | 40.39 | 35 | 0.52 | 0.52 | -5.63% |
| XHS | Health Care Services | | 87.45 | 50 | 0.42 | 0.42 | -1.69% |
| PTH | DWA Healthcare Momentum | | 39.34 | 20 | -0.48 | -0.48 | 0.51% |
| BTEC | Principal Healthcare Innovators | | 33.76 | 10 | -0.30 | -0.3 | -7.07% |
| RXL | Health Care | | 95.32 | 32 | 2.25 | 2.25 | 4.29% |
| RXD | Short Health Care | | 11.50 | 61 | -1.24 | -1.24 | -3.6% |
| 12Stocks.com: Charts, Trends, Fundamental Data and Performances of Healthcare Stocks | |
|
We now take in-depth look at all Healthcare stocks including charts, multi-period performances and overall trends (as measured by Smart Investing & Trading Score). One can sort Healthcare stocks (click link to choose) by Daily, Weekly and by Year-to-Date performances. Also, one can sort by size of the company or by market capitalization. |
| Select Your Default Chart Type: | |||||
| |||||
| Click on stock symbol or name for detailed view. Click on to add stock symbol to your watchlist and to view watchlist. Quick View: Move mouse or cursor over "Daily" to quickly view daily Technical stock chart and over "Weekly" to view weekly Technical stock chart. | |||||

 | VRTX Vertex Pharmaceuticals Incorporated |
| Sector: Health Care | |
| SubSector: Biotechnology | |
| MarketCap: 57669.6 Millions | |
| Recent Price: 399.92 Smart Investing & Trading Score: 49 | |
| Day Percent Change: 1.43% Day Change: 5.64 | |
| Week Change: 1.43% Year-to-date Change: -1.7% | |
| VRTX Links: Profile News Message Board | |
| Charts:- Daily , Weekly | |
| Add VRTX to Watchlist: View: Get Complete VRTX Trend Analysis ➞ | |
 | TAK Takeda Pharmaceutical Company Limited |
| Sector: Health Care | |
| SubSector: Drugs - Generic | |
| MarketCap: 41342.5 Millions | |
| Recent Price: 13.36 Smart Investing & Trading Score: 49 | |
| Day Percent Change: 0.91% Day Change: 0.12 | |
| Week Change: 0.91% Year-to-date Change: -6.4% | |
| TAK Links: Profile News Message Board | |
| Charts:- Daily , Weekly | |
| Add TAK to Watchlist: View: Get Complete TAK Trend Analysis ➞ | |
 | JNJ Johnson & Johnson |
| Sector: Health Care | |
| SubSector: Drug Manufacturers - Major | |
| MarketCap: 331972 Millions | |
| Recent Price: 149.12 Smart Investing & Trading Score: 49 | |
| Day Percent Change: 0.82% Day Change: 1.21 | |
| Week Change: 0.82% Year-to-date Change: -4.9% | |
| JNJ Links: Profile News Message Board | |
| Charts:- Daily , Weekly | |
| Add JNJ to Watchlist: View: Get Complete JNJ Trend Analysis ➞ | |
 | DVAX Dynavax Technologies Corporation |
| Sector: Health Care | |
| SubSector: Biotechnology | |
| MarketCap: 276.885 Millions | |
| Recent Price: 11.84 Smart Investing & Trading Score: 49 | |
| Day Percent Change: 0.34% Day Change: 0.04 | |
| Week Change: 0.34% Year-to-date Change: -15.3% | |
| DVAX Links: Profile News Message Board | |
| Charts:- Daily , Weekly | |
| Add DVAX to Watchlist: View: Get Complete DVAX Trend Analysis ➞ | |
 | USNA USANA Health Sciences, Inc. |
| Sector: Health Care | |
| SubSector: Drug Related Products | |
| MarketCap: 1185.13 Millions | |
| Recent Price: 44.23 Smart Investing & Trading Score: 49 | |
| Day Percent Change: 0.23% Day Change: 0.10 | |
| Week Change: 0.23% Year-to-date Change: -17.5% | |
| USNA Links: Profile News Message Board | |
| Charts:- Daily , Weekly | |
| Add USNA to Watchlist: View: Get Complete USNA Trend Analysis ➞ | |
 | NHC National HealthCare Corporation |
| Sector: Health Care | |
| SubSector: Long-Term Care Facilities | |
| MarketCap: 1164.86 Millions | |
| Recent Price: 89.99 Smart Investing & Trading Score: 49 | |
| Day Percent Change: -0.70% Day Change: -0.63 | |
| Week Change: -0.7% Year-to-date Change: -2.6% | |
| NHC Links: Profile News Message Board | |
| Charts:- Daily , Weekly | |
| Add NHC to Watchlist: View: Get Complete NHC Trend Analysis ➞ | |
 | ASND Ascendis Pharma A/S |
| Sector: Health Care | |
| SubSector: Biotechnology | |
| MarketCap: 5470.35 Millions | |
| Recent Price: 142.10 Smart Investing & Trading Score: 49 | |
| Day Percent Change: 1.38% Day Change: 1.93 | |
| Week Change: 1.38% Year-to-date Change: 12.8% | |
| ASND Links: Profile News Message Board | |
| Charts:- Daily , Weekly | |
| Add ASND to Watchlist: View: Get Complete ASND Trend Analysis ➞ | |
 | PRLD Prelude Therapeutics Incorporated |
| Sector: Health Care | |
| SubSector: Biotechnology | |
| MarketCap: 26087 Millions | |
| Recent Price: 3.85 Smart Investing & Trading Score: 48 | |
| Day Percent Change: 7.84% Day Change: 0.28 | |
| Week Change: 7.84% Year-to-date Change: -11.5% | |
| PRLD Links: Profile News Message Board | |
| Charts:- Daily , Weekly | |
| Add PRLD to Watchlist: View: Get Complete PRLD Trend Analysis ➞ | |
 | SANA Sana Biotechnology, Inc. |
| Sector: Health Care | |
| SubSector: Biotechnology | |
| MarketCap: 1210 Millions | |
| Recent Price: 7.93 Smart Investing & Trading Score: 48 | |
| Day Percent Change: 4.20% Day Change: 0.32 | |
| Week Change: 4.2% Year-to-date Change: 91.8% | |
| SANA Links: Profile News Message Board | |
| Charts:- Daily , Weekly | |
| Add SANA to Watchlist: View: Get Complete SANA Trend Analysis ➞ | |
 | VCEL Vericel Corporation |
| Sector: Health Care | |
| SubSector: Biotechnology | |
| MarketCap: 391.885 Millions | |
| Recent Price: 45.43 Smart Investing & Trading Score: 48 | |
| Day Percent Change: 3.86% Day Change: 1.69 | |
| Week Change: 3.86% Year-to-date Change: 27.6% | |
| VCEL Links: Profile News Message Board | |
| Charts:- Daily , Weekly | |
| Add VCEL to Watchlist: View: Get Complete VCEL Trend Analysis ➞ | |
 | EQ Equillium, Inc. |
| Sector: Health Care | |
| SubSector: Biotechnology | |
| MarketCap: 56.4785 Millions | |
| Recent Price: 1.65 Smart Investing & Trading Score: 48 | |
| Day Percent Change: 1.23% Day Change: 0.02 | |
| Week Change: 1.23% Year-to-date Change: 126.0% | |
| EQ Links: Profile News Message Board | |
| Charts:- Daily , Weekly | |
| Add EQ to Watchlist: View: Get Complete EQ Trend Analysis ➞ | |
 | MEDP Medpace Holdings, Inc. |
| Sector: Health Care | |
| SubSector: Medical Laboratories & Research | |
| MarketCap: 2888.7 Millions | |
| Recent Price: 376.26 Smart Investing & Trading Score: 48 | |
| Day Percent Change: 1.18% Day Change: 4.39 | |
| Week Change: 1.18% Year-to-date Change: 22.8% | |
| MEDP Links: Profile News Message Board | |
| Charts:- Daily , Weekly | |
| Add MEDP to Watchlist: View: Get Complete MEDP Trend Analysis ➞ | |
 | CRNX Crinetics Pharmaceuticals, Inc. |
| Sector: Health Care | |
| SubSector: Biotechnology | |
| MarketCap: 381.085 Millions | |
| Recent Price: 43.44 Smart Investing & Trading Score: 48 | |
| Day Percent Change: 1.07% Day Change: 0.46 | |
| Week Change: 1.07% Year-to-date Change: 22.1% | |
| CRNX Links: Profile News Message Board | |
| Charts:- Daily , Weekly | |
| Add CRNX to Watchlist: View: Get Complete CRNX Trend Analysis ➞ | |
 | ANGO AngioDynamics, Inc. |
| Sector: Health Care | |
| SubSector: Medical Instruments & Supplies | |
| MarketCap: 370.86 Millions | |
| Recent Price: 6.26 Smart Investing & Trading Score: 48 | |
| Day Percent Change: 0.00% Day Change: 0.00 | |
| Week Change: 0% Year-to-date Change: -20.2% | |
| ANGO Links: Profile News Message Board | |
| Charts:- Daily , Weekly | |
| Add ANGO to Watchlist: View: Get Complete ANGO Trend Analysis ➞ | |
 | IOVA Iovance Biotherapeutics, Inc. |
| Sector: Health Care | |
| SubSector: Biotechnology | |
| MarketCap: 3533.35 Millions | |
| Recent Price: 11.32 Smart Investing & Trading Score: 48 | |
| Day Percent Change: 0.00% Day Change: 0.00 | |
| Week Change: 0% Year-to-date Change: 39.2% | |
| IOVA Links: Profile News Message Board | |
| Charts:- Daily , Weekly | |
| Add IOVA to Watchlist: View: Get Complete IOVA Trend Analysis ➞ | |
 | VNDA Vanda Pharmaceuticals Inc. |
| Sector: Health Care | |
| SubSector: Biotechnology | |
| MarketCap: 464.585 Millions | |
| Recent Price: 4.80 Smart Investing & Trading Score: 48 | |
| Day Percent Change: -6.07% Day Change: -0.31 | |
| Week Change: -6.07% Year-to-date Change: 13.7% | |
| VNDA Links: Profile News Message Board | |
| Charts:- Daily , Weekly | |
| Add VNDA to Watchlist: View: Get Complete VNDA Trend Analysis ➞ | |
 | IMAB I Mab |
| Sector: Health Care | |
| SubSector: Biotechnology | |
| MarketCap: 26187 Millions | |
| Recent Price: 1.80 Smart Investing & Trading Score: 48 | |
| Day Percent Change: -0.55% Day Change: -0.01 | |
| Week Change: -0.55% Year-to-date Change: -5.3% | |
| IMAB Links: Profile News Message Board | |
| Charts:- Daily , Weekly | |
| Add IMAB to Watchlist: View: Get Complete IMAB Trend Analysis ➞ | |
 | MTD Mettler-Toledo International Inc. |
| Sector: Health Care | |
| SubSector: Medical Instruments & Supplies | |
| MarketCap: 15973.1 Millions | |
| Recent Price: 1199.46 Smart Investing & Trading Score: 48 | |
| Day Percent Change: 0.92% Day Change: 10.92 | |
| Week Change: 0.92% Year-to-date Change: -1.1% | |
| MTD Links: Profile News Message Board | |
| Charts:- Daily , Weekly | |
| Add MTD to Watchlist: View: Get Complete MTD Trend Analysis ➞ | |
 | ADPT Adaptive Biotechnologies Corporation |
| Sector: Health Care | |
| SubSector: Biotechnology | |
| MarketCap: 3525.75 Millions | |
| Recent Price: 2.52 Smart Investing & Trading Score: 47 | |
| Day Percent Change: 5.00% Day Change: 0.12 | |
| Week Change: 5% Year-to-date Change: -48.6% | |
| ADPT Links: Profile News Message Board | |
| Charts:- Daily , Weekly | |
| Add ADPT to Watchlist: View: Get Complete ADPT Trend Analysis ➞ | |
 | SLGL Sol-Gel Technologies Ltd. |
| Sector: Health Care | |
| SubSector: Biotechnology | |
| MarketCap: 183.285 Millions | |
| Recent Price: 0.94 Smart Investing & Trading Score: 47 | |
| Day Percent Change: 3.88% Day Change: 0.03 | |
| Week Change: 3.88% Year-to-date Change: -15.4% | |
| SLGL Links: Profile News Message Board | |
| Charts:- Daily , Weekly | |
| Add SLGL to Watchlist: View: Get Complete SLGL Trend Analysis ➞ | |
 | DH Definitive Healthcare Corp. |
| Sector: Health Care | |
| SubSector: Health Information Services | |
| MarketCap: 1690 Millions | |
| Recent Price: 7.33 Smart Investing & Trading Score: 47 | |
| Day Percent Change: 3.82% Day Change: 0.27 | |
| Week Change: 3.82% Year-to-date Change: -27.2% | |
| DH Links: Profile News Message Board | |
| Charts:- Daily , Weekly | |
| Add DH to Watchlist: View: Get Complete DH Trend Analysis ➞ | |
 | CLLS Cellectis S.A. |
| Sector: Health Care | |
| SubSector: Biotechnology | |
| MarketCap: 398.685 Millions | |
| Recent Price: 2.64 Smart Investing & Trading Score: 47 | |
| Day Percent Change: 3.53% Day Change: 0.09 | |
| Week Change: 3.53% Year-to-date Change: -14.3% | |
| CLLS Links: Profile News Message Board | |
| Charts:- Daily , Weekly | |
| Add CLLS to Watchlist: View: Get Complete CLLS Trend Analysis ➞ | |
 | CTSO Cytosorbents Corporation |
| Sector: Health Care | |
| SubSector: Medical Laboratories & Research | |
| MarketCap: 166.2 Millions | |
| Recent Price: 0.82 Smart Investing & Trading Score: 47 | |
| Day Percent Change: 2.09% Day Change: 0.02 | |
| Week Change: 2.09% Year-to-date Change: -26.2% | |
| CTSO Links: Profile News Message Board | |
| Charts:- Daily , Weekly | |
| Add CTSO to Watchlist: View: Get Complete CTSO Trend Analysis ➞ | |
 | ASRT Assertio Therapeutics, Inc. |
| Sector: Health Care | |
| SubSector: Drugs - Generic | |
| MarketCap: 65.8185 Millions | |
| Recent Price: 0.87 Smart Investing & Trading Score: 47 | |
| Day Percent Change: 13.48% Day Change: 0.10 | |
| Week Change: 13.48% Year-to-date Change: -19.9% | |
| ASRT Links: Profile News Message Board | |
| Charts:- Daily , Weekly | |
| Add ASRT to Watchlist: View: Get Complete ASRT Trend Analysis ➞ | |
 | ALHC Alignment Healthcare, Inc. |
| Sector: Health Care | |
| SubSector: Healthcare Plans | |
| MarketCap: 1100 Millions | |
| Recent Price: 5.01 Smart Investing & Trading Score: 47 | |
| Day Percent Change: -3.65% Day Change: -0.19 | |
| Week Change: -3.65% Year-to-date Change: -43.4% | |
| ALHC Links: Profile News Message Board | |
| Charts:- Daily , Weekly | |
| Add ALHC to Watchlist: View: Get Complete ALHC Trend Analysis ➞ | |
| For tabular summary view of above stock list: Summary View ➞ 0 - 25 , 25 - 50 , 50 - 75 , 75 - 100 , 100 - 125 , 125 - 150 , 150 - 175 , 175 - 200 , 200 - 225 , 225 - 250 , 250 - 275 , 275 - 300 , 300 - 325 , 325 - 350 , 350 - 375 , 375 - 400 , 400 - 425 , 425 - 450 , 450 - 475 , 475 - 500 , 500 - 525 , 525 - 550 , 550 - 575 , 575 - 600 , 600 - 625 , 625 - 650 , 650 - 675 , 675 - 700 , 700 - 725 | ||
| Click To Change The Sort Order: By Market Cap or Company Size Performance: Year-to-date, Week and Day | |
| Select Chart Type: | ||
|
Best Stocks Today 12Stocks.com |
© 2024 12Stocks.com Terms & Conditions Privacy Contact Us
All Information Provided Only For Education And Not To Be Used For Investing or Trading. See Terms & Conditions


One More Thing ... Get Best Stocks Delivered Daily!
Never Ever Miss A Move With Our Top Ten Stocks Lists
Find Best Stocks In Any Market - Bull or Bear Market
Take A Peek At Our Top Ten Stocks Lists: Daily, Weekly, Year-to-Date & Top Trends
Find Best Stocks In Any Market - Bull or Bear Market
Take A Peek At Our Top Ten Stocks Lists: Daily, Weekly, Year-to-Date & Top Trends
Healthcare Stocks With Best Up Trends [0-bearish to 100-bullish]: Fresenius [100], Glaukos [100], AstraZeneca [100], Lantheus [95], Annovis Bio[93], Quest Diagnostics[93], GeneDx [90], Agios [90], Haleon [90], Anika [90], Prestige Consumer[90]
Best Healthcare Stocks Year-to-Date:
Precision BioSciences[2552.05%], Inovio [1864.71%], Assembly Biosciences[1512%], Adverum Biotechnologies[1406.38%], NuCana [1231.98%], Aurora Cannabis[1218.77%], Affimed N.V[700%], Agenus [596.94%], CareMax [561.86%], Corbus [524.17%], Mesoblast [402.73%] Best Healthcare Stocks This Week:
ProKidney [33.33%], MSP Recovery[28.69%], CareMax [24.9%], BeyondSpring [17.22%], Molecular Partners[16.87%], ArTara [16.41%], Regencell Bioscience[16.04%], OptiNose [15.07%], Annovis Bio[14.9%], Seres [11.56%], Cara [10.5%] Best Healthcare Stocks Daily:
ProKidney [33.33%], MSP Recovery[28.69%], CareMax [24.90%], BeyondSpring [17.22%], Molecular Partners[16.87%], ArTara [16.41%], Regencell Bioscience[16.04%], OptiNose [15.07%], Annovis Bio[14.90%], Seres [11.56%], Cara [10.50%]