
 Login Sign Up


| |||||
 |  | ||||

| 12Stocks.com Market Intelligence |
Best Healthcare Stocks
 | "Discover best trending healthcare stocks with 12Stocks.com." |
| - Subu Vdaygiri, Founder, 12Stocks.com |
| In a hurry? Healthcare Stocks Lists: Performance Trends Table, Stock Charts
Sort Healthcare stocks: Daily, Weekly, Year-to-Date, Market Cap & Trends. Filter Healthcare stocks list by size:All Healthcare Large Mid-Range Small |
| 12Stocks.com Healthcare Stocks Performances & Trends Daily | |||||||||
|
|  The overall Smart Investing & Trading Score is 18 (0-bearish to 100-bullish) which puts Healthcare sector in short term bearish trend. The Smart Investing & Trading Score from previous trading session is 10 and an improvement of trend continues.
| ||||||||
Here are the Smart Investing & Trading Scores of the most requested Healthcare stocks at 12Stocks.com (click stock name for detailed review):
|


| 12Stocks.com: Investing in Healthcare sector with Stocks | |
|
The following table helps investors and traders sort through current performance and trends (as measured by Smart Investing & Trading Score) of various
stocks in the Healthcare sector. Quick View: Move mouse or cursor over stock symbol (ticker) to view short-term Technical chart and over stock name to view long term chart. Click on  to add stock symbol to your watchlist and to add stock symbol to your watchlist and  to view watchlist. Click on any ticker or stock name for detailed market intelligence report for that stock. to view watchlist. Click on any ticker or stock name for detailed market intelligence report for that stock. |
12Stocks.com Performance of Stocks in Healthcare Sector
| Ticker | Stock Name | Watchlist | Category | Recent Price | Smart Investing & Trading Score | Change % | YTD Change% |
| PTPI | Petros |   | Biotechnology | 0.69 | 17 | 0.15% | -51.58% |
| PRVA | Privia Health | | Health Information | 17.86 | 17 | 0.14% | -24.42% |
| BGNE | BeiGene | | Biotechnology | 131.96 | 17 | 0.08% | -26.84% |
| NUVL | Nuvalent | | Biotechnology | 64.23 | 17 | 0.06% | -12.60% |
| SHCR | Sharecare | | Health Information | 0.66 | 17 | 0.05% | -39.14% |
| CASI | CASI | | Biotechnology | 2.24 | 17 | 0.00% | -68.72% |
| CUE | Cue Biopharma | | Biotechnology | 1.58 | 17 | -3.07% | -40.15% |
| CDMO | Avid Bioservices | | Biotechnology | 6.54 | 17 | -2.53% | 0.62% |
| THTX | Theratechnologies | | Pharmaceutical | 1.32 | 17 | -1.49% | -18.52% |
| PLSE | Pulse Biosciences | | Instruments | 7.36 | 17 | -1.47% | -39.87% |
| IRON | Disc Medicine | | Biotechnology | 30.09 | 17 | -0.66% | -48.13% |
| MLSS | Milestone Scientific | | Instruments | 0.57 | 17 | -0.31% | -17.18% |
| LBPH | Longboard | | Biotechnology | 18.01 | 15 | 6.07% | 194.76% |
| DNA | Ginkgo Bioworks | | Biotechnology | 0.92 | 15 | 5.13% | -45.46% |
| SEER | Seer | | Biotechnology | 1.75 | 15 | 3.85% | -10.00% |
| PSNL | Personalis | | Biotechnology | 1.23 | 15 | 2.50% | -41.43% |
| ALLK | Allakos | | Biotechnology | 1.06 | 15 | 0.00% | -61.17% |
| TLRY | Tilray | | Pharmaceutical | 1.72 | 15 | 0.00% | -25.22% |
| VXRT | Vaxart | | Biotechnology | 0.84 | 15 | -3.48% | 45.95% |
| VALN | Valneva SE | | Biotechnology | 7.75 | 15 | -3.12% | -25.27% |
| AIH | Aesthetic | | Specialized | 0.38 | 15 | -2.86% | -44.32% |
| MDXG | MiMedx | | Equipment | 6.16 | 15 | -2.69% | -29.76% |
| ALVR | AlloVir | | Biotechnology | 0.74 | 15 | -2.23% | 8.87% |
| KRON | Kronos Bio | | Biotechnology | 1.01 | 15 | -1.94% | -19.20% |
| ALLO | Allogene | | Biotechnology | 3.46 | 15 | -1.42% | 7.79% |
| For chart view version of above stock list: Chart View ➞ 0 - 25 , 25 - 50 , 50 - 75 , 75 - 100 , 100 - 125 , 125 - 150 , 150 - 175 , 175 - 200 , 200 - 225 , 225 - 250 , 250 - 275 , 275 - 300 , 300 - 325 , 325 - 350 , 350 - 375 , 375 - 400 , 400 - 425 , 425 - 450 , 450 - 475 , 475 - 500 , 500 - 525 , 525 - 550 , 550 - 575 , 575 - 600 , 600 - 625 , 625 - 650 , 650 - 675 , 675 - 700 , 700 - 725 | ||
 | Click To Change The Sort Order: By Market Cap or Company Size Performance: Year-to-date, Week and Day |  |
|
Get the most comprehensive stock market coverage daily at 12Stocks.com ➞ Best Stocks Today ➞ Best Stocks Weekly ➞ Best Stocks Year-to-Date ➞ Best Stocks Trends ➞  Best Stocks Today 12Stocks.com Best Nasdaq Stocks ➞ Best S&P 500 Stocks ➞ Best Tech Stocks ➞ Best Biotech Stocks ➞ |
| Detailed Overview of Healthcare Stocks |
| Healthcare Technical Overview, Leaders & Laggards, Top Healthcare ETF Funds & Detailed Healthcare Stocks List, Charts, Trends & More |
| Healthcare Sector: Technical Analysis, Trends & YTD Performance | |
| Healthcare sector is composed of stocks
from pharmaceutical, biotech, diagnostics labs, insurance providers
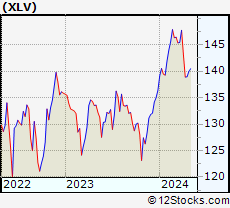
and healthcare services. Healthcare sector, as represented by XLV, an exchange-traded fund [ETF] that holds basket of Healthcare stocks (e.g, Merck, Amgen) is up by 1.5% and is currently underperforming the overall market by -2.69% year-to-date. Below is a quick view of Technical charts and trends: |
|
 XLV Weekly Chart |
|
| Long Term Trend: Not Good | |
| Medium Term Trend: Not Good | |
 XLV Daily Chart |
|
| Short Term Trend: Deteriorating | |
| Overall Trend Score: 18 | |
| YTD Performance: 1.5% | |
| **Trend Scores & Views Are Only For Educational Purposes And Not For Investing | |
| 12Stocks.com: Top Performing Healthcare Sector Stocks | ||||||||||||||||||||||||||||||||||||||||||||||||
 The top performing Healthcare sector stocks year to date are
Now, more recently, over last week, the top performing Healthcare sector stocks on the move are


|
||||||||||||||||||||||||||||||||||||||||||||||||
| 12Stocks.com: Investing in Healthcare Sector using Exchange Traded Funds | |
|
The following table shows list of key exchange traded funds (ETF) that
help investors track Healthcare Index. For detailed view, check out our ETF Funds section of our website. Quick View: Move mouse or cursor over ETF symbol (ticker) to view short-term Technical chart and over ETF name to view long term chart. Click on ticker or stock name for detailed view. Click on to add stock symbol to your watchlist and to view watchlist. |
12Stocks.com List of ETFs that track Healthcare Index
| Ticker | ETF Name | Watchlist | Recent Price | Smart Investing & Trading Score | Change % | Week % | Year-to-date % |
| XLV | Health Care | | 138.43 | 18 | -0.01 | -0.35 | 1.5% |
| XBI | Biotech | | 83.48 | 0 | -1.38 | -5.3 | -6.51% |
| IBB | Biotechnology | | 124.64 | 0 | -0.99 | -3.81 | -8.25% |
| BBH | Biotech | | 152.35 | 10 | -0.43 | -3.33 | -7.84% |
| VHT | Health Care | | 252.83 | 18 | -0.12 | -0.76 | 0.85% |
| IYH | Healthcare | | 58.05 | 18 | -0.02 | -0.6 | 1.4% |
| IHF | Healthcare Providers | | 51.55 | 32 | 0.93 | 1.99 | -1.84% |
| IHI | Medical Devices | | 54.53 | 5 | -0.46 | -2.8 | 1.04% |
| BIB | Biotechnology | | 47.94 | 0 | -2.02 | -6.71 | -15.97% |
| BIS | Short Biotech | | 20.87 | 100 | 1.69 | 6.46 | 15.47% |
| XHE | Health Care Equipment | | 81.44 | 10 | -0.74 | -2.93 | -3.35% |
| CURE | Healthcare Bull 3X | | 102.22 | 18 | -0.44 | -1.14 | 0.47% |
| LABU | Biotech Bull 3X | | 88.04 | 0 | -4.33 | -15.63 | -27.82% |
| LABD | Biotech Bear 3X | | 10.52 | 100 | 4.37 | 17.15 | 8.57% |
| PSCH | SmallCap Health Care | | 40.08 | 10 | -0.87 | -3.26 | -6.36% |
| XHS | Health Care Services | | 86.19 | 10 | -0.16 | -2.07 | -3.1% |
| PTH | DWA Healthcare Momentum | | 39.57 | 23 | -2.18 | -5.4 | 1.1% |
| BTEC | Principal Healthcare Innovators | | 34.09 | 0 | -1.51 | -5.29 | -6.17% |
| RXL | Health Care | | 92.44 | 10 | -0.61 | -0.88 | 1.13% |
| RXD | Short Health Care | | 11.67 | 76 | -0.05 | 0.64 | -2.11% |
| 12Stocks.com: Charts, Trends, Fundamental Data and Performances of Healthcare Stocks | |
|
We now take in-depth look at all Healthcare stocks including charts, multi-period performances and overall trends (as measured by Smart Investing & Trading Score). One can sort Healthcare stocks (click link to choose) by Daily, Weekly and by Year-to-Date performances. Also, one can sort by size of the company or by market capitalization. |
| Select Your Default Chart Type: | |||||
| |||||
| Click on stock symbol or name for detailed view. Click on to add stock symbol to your watchlist and to view watchlist. Quick View: Move mouse or cursor over "Daily" to quickly view daily Technical stock chart and over "Weekly" to view weekly Technical stock chart. | |||||

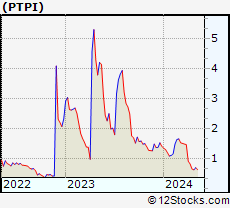 | PTPI Petros Pharmaceuticals, Inc. |
| Sector: Health Care | |
| SubSector: Biotechnology | |
| MarketCap: 21487 Millions | |
| Recent Price: 0.69 Smart Investing & Trading Score: 17 | |
| Day Percent Change: 0.15% Day Change: 0.00 | |
| Week Change: -17.26% Year-to-date Change: -51.6% | |
| PTPI Links: Profile News Message Board | |
| Charts:- Daily , Weekly | |
| Add PTPI to Watchlist: View: Get Complete PTPI Trend Analysis ➞ | |
 | PRVA Privia Health Group, Inc. |
| Sector: Health Care | |
| SubSector: Health Information Services | |
| MarketCap: 3130 Millions | |
| Recent Price: 17.86 Smart Investing & Trading Score: 17 | |
| Day Percent Change: 0.14% Day Change: 0.02 | |
| Week Change: -3.67% Year-to-date Change: -24.4% | |
| PRVA Links: Profile News Message Board | |
| Charts:- Daily , Weekly | |
| Add PRVA to Watchlist: View: Get Complete PRVA Trend Analysis ➞ | |
 | BGNE BeiGene, Ltd. |
| Sector: Health Care | |
| SubSector: Biotechnology | |
| MarketCap: 10838.5 Millions | |
| Recent Price: 131.96 Smart Investing & Trading Score: 17 | |
| Day Percent Change: 0.08% Day Change: 0.10 | |
| Week Change: -6.61% Year-to-date Change: -26.8% | |
| BGNE Links: Profile News Message Board | |
| Charts:- Daily , Weekly | |
| Add BGNE to Watchlist: View: Get Complete BGNE Trend Analysis ➞ | |
 | NUVL Nuvalent, Inc. |
| Sector: Health Care | |
| SubSector: Biotechnology | |
| MarketCap: 2400 Millions | |
| Recent Price: 64.23 Smart Investing & Trading Score: 17 | |
| Day Percent Change: 0.06% Day Change: 0.04 | |
| Week Change: -1.95% Year-to-date Change: -12.6% | |
| NUVL Links: Profile News Message Board | |
| Charts:- Daily , Weekly | |
| Add NUVL to Watchlist: View: Get Complete NUVL Trend Analysis ➞ | |
 | SHCR Sharecare, Inc. |
| Sector: Health Care | |
| SubSector: Health Information Services | |
| MarketCap: 640 Millions | |
| Recent Price: 0.66 Smart Investing & Trading Score: 17 | |
| Day Percent Change: 0.05% Day Change: 0.00 | |
| Week Change: -11.06% Year-to-date Change: -39.1% | |
| SHCR Links: Profile News Message Board | |
| Charts:- Daily , Weekly | |
| Add SHCR to Watchlist: View: Get Complete SHCR Trend Analysis ➞ | |
 | CASI CASI Pharmaceuticals, Inc. |
| Sector: Health Care | |
| SubSector: Biotechnology | |
| MarketCap: 210.085 Millions | |
| Recent Price: 2.24 Smart Investing & Trading Score: 17 | |
| Day Percent Change: 0.00% Day Change: 0.00 | |
| Week Change: -13.85% Year-to-date Change: -68.7% | |
| CASI Links: Profile News Message Board | |
| Charts:- Daily , Weekly | |
| Add CASI to Watchlist: View: Get Complete CASI Trend Analysis ➞ | |
 | CUE Cue Biopharma, Inc. |
| Sector: Health Care | |
| SubSector: Biotechnology | |
| MarketCap: 352.785 Millions | |
| Recent Price: 1.58 Smart Investing & Trading Score: 17 | |
| Day Percent Change: -3.07% Day Change: -0.05 | |
| Week Change: -9.71% Year-to-date Change: -40.2% | |
| CUE Links: Profile News Message Board | |
| Charts:- Daily , Weekly | |
| Add CUE to Watchlist: View: Get Complete CUE Trend Analysis ➞ | |
 | CDMO Avid Bioservices, Inc. |
| Sector: Health Care | |
| SubSector: Biotechnology | |
| MarketCap: 203.685 Millions | |
| Recent Price: 6.54 Smart Investing & Trading Score: 17 | |
| Day Percent Change: -2.53% Day Change: -0.17 | |
| Week Change: -2.97% Year-to-date Change: 0.6% | |
| CDMO Links: Profile News Message Board | |
| Charts:- Daily , Weekly | |
| Add CDMO to Watchlist: View: Get Complete CDMO Trend Analysis ➞ | |
 | THTX Theratechnologies Inc. |
| Sector: Health Care | |
| SubSector: Drugs - Generic | |
| MarketCap: 123.185 Millions | |
| Recent Price: 1.32 Smart Investing & Trading Score: 17 | |
| Day Percent Change: -1.49% Day Change: -0.02 | |
| Week Change: -7.04% Year-to-date Change: -18.5% | |
| THTX Links: Profile News Message Board | |
| Charts:- Daily , Weekly | |
| Add THTX to Watchlist: View: Get Complete THTX Trend Analysis ➞ | |
 | PLSE Pulse Biosciences, Inc. |
| Sector: Health Care | |
| SubSector: Medical Instruments & Supplies | |
| MarketCap: 131.96 Millions | |
| Recent Price: 7.36 Smart Investing & Trading Score: 17 | |
| Day Percent Change: -1.47% Day Change: -0.11 | |
| Week Change: 1.94% Year-to-date Change: -39.9% | |
| PLSE Links: Profile News Message Board | |
| Charts:- Daily , Weekly | |
| Add PLSE to Watchlist: View: Get Complete PLSE Trend Analysis ➞ | |
 | IRON Disc Medicine Opco Inc |
| Sector: Health Care | |
| SubSector: Biotechnology | |
| MarketCap: 1100 Millions | |
| Recent Price: 30.09 Smart Investing & Trading Score: 17 | |
| Day Percent Change: -0.66% Day Change: -0.20 | |
| Week Change: -5.47% Year-to-date Change: -48.1% | |
| IRON Links: Profile News Message Board | |
| Charts:- Daily , Weekly | |
| Add IRON to Watchlist: View: Get Complete IRON Trend Analysis ➞ | |
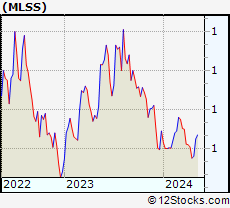 | MLSS Milestone Scientific Inc. |
| Sector: Health Care | |
| SubSector: Medical Instruments & Supplies | |
| MarketCap: 72.186 Millions | |
| Recent Price: 0.57 Smart Investing & Trading Score: 17 | |
| Day Percent Change: -0.31% Day Change: 0.00 | |
| Week Change: -6.13% Year-to-date Change: -17.2% | |
| MLSS Links: Profile News Message Board | |
| Charts:- Daily , Weekly | |
| Add MLSS to Watchlist: View: Get Complete MLSS Trend Analysis ➞ | |
 | LBPH Longboard Pharmaceuticals, Inc. |
| Sector: Health Care | |
| SubSector: Biotechnology | |
| MarketCap: 169 Millions | |
| Recent Price: 18.01 Smart Investing & Trading Score: 15 | |
| Day Percent Change: 6.07% Day Change: 1.03 | |
| Week Change: -6.2% Year-to-date Change: 194.8% | |
| LBPH Links: Profile News Message Board | |
| Charts:- Daily , Weekly | |
| Add LBPH to Watchlist: View: Get Complete LBPH Trend Analysis ➞ | |
 | DNA Ginkgo Bioworks Holdings, Inc. |
| Sector: Health Care | |
| SubSector: Biotechnology | |
| MarketCap: 3680 Millions | |
| Recent Price: 0.92 Smart Investing & Trading Score: 15 | |
| Day Percent Change: 5.13% Day Change: 0.04 | |
| Week Change: -9.28% Year-to-date Change: -45.5% | |
| DNA Links: Profile News Message Board | |
| Charts:- Daily , Weekly | |
| Add DNA to Watchlist: View: Get Complete DNA Trend Analysis ➞ | |
 | SEER Seer, Inc. |
| Sector: Health Care | |
| SubSector: Biotechnology | |
| MarketCap: 48287 Millions | |
| Recent Price: 1.75 Smart Investing & Trading Score: 15 | |
| Day Percent Change: 3.85% Day Change: 0.06 | |
| Week Change: -4.62% Year-to-date Change: -10.0% | |
| SEER Links: Profile News Message Board | |
| Charts:- Daily , Weekly | |
| Add SEER to Watchlist: View: Get Complete SEER Trend Analysis ➞ | |
 | PSNL Personalis, Inc. |
| Sector: Health Care | |
| SubSector: Biotechnology | |
| MarketCap: 242.385 Millions | |
| Recent Price: 1.23 Smart Investing & Trading Score: 15 | |
| Day Percent Change: 2.50% Day Change: 0.03 | |
| Week Change: -3.53% Year-to-date Change: -41.4% | |
| PSNL Links: Profile News Message Board | |
| Charts:- Daily , Weekly | |
| Add PSNL to Watchlist: View: Get Complete PSNL Trend Analysis ➞ | |
 | ALLK Allakos Inc. |
| Sector: Health Care | |
| SubSector: Biotechnology | |
| MarketCap: 3233.55 Millions | |
| Recent Price: 1.06 Smart Investing & Trading Score: 15 | |
| Day Percent Change: 0.00% Day Change: 0.00 | |
| Week Change: -4.5% Year-to-date Change: -61.2% | |
| ALLK Links: Profile News Message Board | |
| Charts:- Daily , Weekly | |
| Add ALLK to Watchlist: View: Get Complete ALLK Trend Analysis ➞ | |
 | TLRY Tilray, Inc. |
| Sector: Health Care | |
| SubSector: Drug Manufacturers - Other | |
| MarketCap: 452.533 Millions | |
| Recent Price: 1.72 Smart Investing & Trading Score: 15 | |
| Day Percent Change: 0.00% Day Change: 0.00 | |
| Week Change: -5.49% Year-to-date Change: -25.2% | |
| TLRY Links: Profile News Message Board | |
| Charts:- Daily , Weekly | |
| Add TLRY to Watchlist: View: Get Complete TLRY Trend Analysis ➞ | |
 | VXRT Vaxart, Inc. |
| Sector: Health Care | |
| SubSector: Biotechnology | |
| MarketCap: 129.785 Millions | |
| Recent Price: 0.84 Smart Investing & Trading Score: 15 | |
| Day Percent Change: -3.48% Day Change: -0.03 | |
| Week Change: -8.14% Year-to-date Change: 46.0% | |
| VXRT Links: Profile News Message Board | |
| Charts:- Daily , Weekly | |
| Add VXRT to Watchlist: View: Get Complete VXRT Trend Analysis ➞ | |
 | VALN Valneva SE |
| Sector: Health Care | |
| SubSector: Biotechnology | |
| MarketCap: 1010 Millions | |
| Recent Price: 7.75 Smart Investing & Trading Score: 15 | |
| Day Percent Change: -3.12% Day Change: -0.25 | |
| Week Change: -8.93% Year-to-date Change: -25.3% | |
| VALN Links: Profile News Message Board | |
| Charts:- Daily , Weekly | |
| Add VALN to Watchlist: View: Get Complete VALN Trend Analysis ➞ | |
 | AIH Aesthetic Medical International Holdings Group Limited |
| Sector: Health Care | |
| SubSector: Specialized Health Services | |
| MarketCap: 205.356 Millions | |
| Recent Price: 0.38 Smart Investing & Trading Score: 15 | |
| Day Percent Change: -2.86% Day Change: -0.01 | |
| Week Change: -11.93% Year-to-date Change: -44.3% | |
| AIH Links: Profile News Message Board | |
| Charts:- Daily , Weekly | |
| Add AIH to Watchlist: View: Get Complete AIH Trend Analysis ➞ | |
 | MDXG MiMedx Group, Inc. |
| Sector: Health Care | |
| SubSector: Medical Appliances & Equipment | |
| MarketCap: 371.08 Millions | |
| Recent Price: 6.16 Smart Investing & Trading Score: 15 | |
| Day Percent Change: -2.69% Day Change: -0.17 | |
| Week Change: -4.35% Year-to-date Change: -29.8% | |
| MDXG Links: Profile News Message Board | |
| Charts:- Daily , Weekly | |
| Add MDXG to Watchlist: View: Get Complete MDXG Trend Analysis ➞ | |
 | ALVR AlloVir, Inc. |
| Sector: Health Care | |
| SubSector: Biotechnology | |
| MarketCap: 25787 Millions | |
| Recent Price: 0.74 Smart Investing & Trading Score: 15 | |
| Day Percent Change: -2.23% Day Change: -0.02 | |
| Week Change: -3.51% Year-to-date Change: 8.9% | |
| ALVR Links: Profile News Message Board | |
| Charts:- Daily , Weekly | |
| Add ALVR to Watchlist: View: Get Complete ALVR Trend Analysis ➞ | |
 | KRON Kronos Bio, Inc. |
| Sector: Health Care | |
| SubSector: Biotechnology | |
| MarketCap: 17287 Millions | |
| Recent Price: 1.01 Smart Investing & Trading Score: 15 | |
| Day Percent Change: -1.94% Day Change: -0.02 | |
| Week Change: -10.62% Year-to-date Change: -19.2% | |
| KRON Links: Profile News Message Board | |
| Charts:- Daily , Weekly | |
| Add KRON to Watchlist: View: Get Complete KRON Trend Analysis ➞ | |
 | ALLO Allogene Therapeutics, Inc. |
| Sector: Health Care | |
| SubSector: Biotechnology | |
| MarketCap: 2858.65 Millions | |
| Recent Price: 3.46 Smart Investing & Trading Score: 15 | |
| Day Percent Change: -1.42% Day Change: -0.05 | |
| Week Change: -8.95% Year-to-date Change: 7.8% | |
| ALLO Links: Profile News Message Board | |
| Charts:- Daily , Weekly | |
| Add ALLO to Watchlist: View: Get Complete ALLO Trend Analysis ➞ | |
| For tabular summary view of above stock list: Summary View ➞ 0 - 25 , 25 - 50 , 50 - 75 , 75 - 100 , 100 - 125 , 125 - 150 , 150 - 175 , 175 - 200 , 200 - 225 , 225 - 250 , 250 - 275 , 275 - 300 , 300 - 325 , 325 - 350 , 350 - 375 , 375 - 400 , 400 - 425 , 425 - 450 , 450 - 475 , 475 - 500 , 500 - 525 , 525 - 550 , 550 - 575 , 575 - 600 , 600 - 625 , 625 - 650 , 650 - 675 , 675 - 700 , 700 - 725 | ||
| Click To Change The Sort Order: By Market Cap or Company Size Performance: Year-to-date, Week and Day | |
| Select Chart Type: | ||
|
Best Stocks Today 12Stocks.com |
© 2024 12Stocks.com Terms & Conditions Privacy Contact Us
All Information Provided Only For Education And Not To Be Used For Investing or Trading. See Terms & Conditions


One More Thing ... Get Best Stocks Delivered Daily!
Never Ever Miss A Move With Our Top Ten Stocks Lists
Find Best Stocks In Any Market - Bull or Bear Market
Take A Peek At Our Top Ten Stocks Lists: Daily, Weekly, Year-to-Date & Top Trends
Find Best Stocks In Any Market - Bull or Bear Market
Take A Peek At Our Top Ten Stocks Lists: Daily, Weekly, Year-to-Date & Top Trends
Healthcare Stocks With Best Up Trends [0-bearish to 100-bullish]: Zhongchao [100], Cullinan Oncology[100], Oscar Health[100], ALX Oncology[100], Geron [95], Zura Bio[93], PROCEPT BioRobotics[93], NuCana [93], Reneo [93], Vanda [93], Lantheus [93]
Best Healthcare Stocks Year-to-Date:
Precision BioSciences[2836.99%], Inovio [1900%], Assembly Biosciences[1525.41%], Adverum Biotechnologies[1381.14%], Aurora Cannabis[1272.32%], NuCana [1269.17%], Zhongchao [825.77%], Affimed N.V[711.2%], Corbus [504.8%], Agenus [500.31%], CareMax [417.53%] Best Healthcare Stocks This Week:
NuCana [1708.84%], Zhongchao [106.1%], Regencell Bioscience[37.01%], 23andMe Holding[33.3%], ProKidney [32%], ALX Oncology[20.64%], Vanda [20.63%], Galera [16.43%], Venus Concept[15.35%], Cullinan Oncology[13.89%], Rani [13.15%] Best Healthcare Stocks Daily:
Zhongchao [146.72%], 23andMe Holding[65.91%], Veru [22.41%], Canopy Growth[20.65%], Zura Bio[17.20%], Aurora Cannabis[12.87%], Bicycle [12.33%], Regencell Bioscience[10.20%], Vaxxinity [10.05%], DURECT [9.77%], Annovis Bio[9.57%]