
 Login Sign Up


| |||||
 |  | ||||

| 12Stocks.com Market Intelligence |
Best Healthcare Stocks
 | "Discover best trending healthcare stocks with 12Stocks.com." |
| - Subu Vdaygiri, Founder, 12Stocks.com |
| In a hurry? Healthcare Stocks Lists: Performance Trends Table, Stock Charts
Sort Healthcare stocks: Daily, Weekly, Year-to-Date, Market Cap & Trends. Filter Healthcare stocks list by size:All Healthcare Large Mid-Range Small |
| 12Stocks.com Healthcare Stocks Performances & Trends Daily | |||||||||
|
|  The overall Smart Investing & Trading Score is 57 (0-bearish to 100-bullish) which puts Healthcare sector in short term neutral trend. The Smart Investing & Trading Score from previous trading session is 60 and a deterioration of trend continues.
| ||||||||
Here are the Smart Investing & Trading Scores of the most requested Healthcare stocks at 12Stocks.com (click stock name for detailed review):
|


| 12Stocks.com: Investing in Healthcare sector with Stocks | |
|
The following table helps investors and traders sort through current performance and trends (as measured by Smart Investing & Trading Score) of various
stocks in the Healthcare sector. Quick View: Move mouse or cursor over stock symbol (ticker) to view short-term Technical chart and over stock name to view long term chart. Click on  to add stock symbol to your watchlist and to add stock symbol to your watchlist and  to view watchlist. Click on any ticker or stock name for detailed market intelligence report for that stock. to view watchlist. Click on any ticker or stock name for detailed market intelligence report for that stock. |
12Stocks.com Performance of Stocks in Healthcare Sector
| Ticker | Stock Name | Watchlist | Category | Recent Price | Smart Investing & Trading Score | Change % | YTD Change% |
| IMNM | Immunome |   | Biotechnology | 15.78 | 32 | 5.41% | 47.61% |
| AKBA | Akebia | | Biotechnology | 1.37 | 32 | 5.38% | 10.48% |
| SWTX | SpringWorks | | Biotechnology | 45.11 | 32 | 4.06% | 23.59% |
| ETNB | 89bio | | Biotechnology | 9.22 | 32 | 4.06% | -17.46% |
| ZBH | Zimmer Biomet | | Equipment | 121.66 | 32 | 2.70% | -0.03% |
| LXRX | Lexicon | | Biotechnology | 1.74 | 32 | 2.35% | 13.73% |
| HRTX | Heron | | Biotechnology | 2.61 | 32 | 2.35% | 53.53% |
| PTGX | Protagonist | | Biotechnology | 26.09 | 32 | 2.15% | 13.78% |
| ABEO | Abeona | | Biotechnology | 4.60 | 32 | 13.02% | -8.18% |
| AUTL | Autolus | | Biotechnology | 4.19 | 32 | 1.95% | -34.94% |
| GEHC | GE | | Health Information | 79.50 | 32 | 1.86% | 2.79% |
| BEAM | Beam | | Biotechnology | 23.13 | 32 | 1.80% | -15.03% |
| BVS | Bioventus | | Medical Devices | 4.02 | 32 | 1.77% | -24.01% |
| CRL | Charles River | | Laboratories | 233.47 | 32 | 1.56% | -1.24% |
| ALC | Alcon | | Instruments | 79.57 | 32 | 1.47% | 1.86% |
| CYTK | Cytokinetics | | Biotechnology | 65.27 | 32 | 1.45% | -21.82% |
| ARVN | Arvinas | | Biotechnology | 32.82 | 32 | 1.20% | -20.26% |
| XGN | Exagen | | Laboratories | 1.40 | 32 | 1.08% | -29.65% |
| ACLX | Arcellx | | Biotechnology | 53.63 | 32 | 1.06% | -3.90% |
| COO | Cooper | | Instruments | 90.64 | 32 | 0.99% | -4.20% |
| CNTA | Centessa | | Biotechnology | 9.53 | 32 | 0.95% | 17.95% |
| NERV | Minerva Neurosciences | | Biotechnology | 2.37 | 32 | 0.85% | -61.46% |
| RCEL | Avita | | Equipment | 8.75 | 32 | 0.34% | -36.22% |
| KZR | Kezar Life | | Biotechnology | 0.86 | 32 | 0.32% | -9.50% |
| FONR | FONAR | | Equipment | 16.31 | 32 | 0.31% | -16.62% |
| For chart view version of above stock list: Chart View ➞ 0 - 25 , 25 - 50 , 50 - 75 , 75 - 100 , 100 - 125 , 125 - 150 , 150 - 175 , 175 - 200 , 200 - 225 , 225 - 250 , 250 - 275 , 275 - 300 , 300 - 325 , 325 - 350 , 350 - 375 , 375 - 400 , 400 - 425 , 425 - 450 , 450 - 475 , 475 - 500 , 500 - 525 , 525 - 550 , 550 - 575 , 575 - 600 , 600 - 625 , 625 - 650 , 650 - 675 , 675 - 700 , 700 - 725 | ||
 | Click To Change The Sort Order: By Market Cap or Company Size Performance: Year-to-date, Week and Day |  |
|
Get the most comprehensive stock market coverage daily at 12Stocks.com ➞ Best Stocks Today ➞ Best Stocks Weekly ➞ Best Stocks Year-to-Date ➞ Best Stocks Trends ➞  Best Stocks Today 12Stocks.com Best Nasdaq Stocks ➞ Best S&P 500 Stocks ➞ Best Tech Stocks ➞ Best Biotech Stocks ➞ |
| Detailed Overview of Healthcare Stocks |
| Healthcare Technical Overview, Leaders & Laggards, Top Healthcare ETF Funds & Detailed Healthcare Stocks List, Charts, Trends & More |
| Healthcare Sector: Technical Analysis, Trends & YTD Performance | |
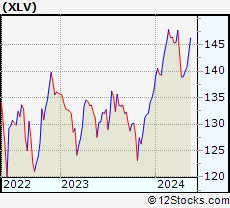
| Healthcare sector is composed of stocks
from pharmaceutical, biotech, diagnostics labs, insurance providers
and healthcare services. Healthcare sector, as represented by XLV, an exchange-traded fund [ETF] that holds basket of Healthcare stocks (e.g, Merck, Amgen) is up by 3.26% and is currently underperforming the overall market by -3.62% year-to-date. Below is a quick view of Technical charts and trends: |
|
 XLV Weekly Chart |
|
| Long Term Trend: Not Good | |
| Medium Term Trend: Good | |
 XLV Daily Chart |
|
| Short Term Trend: Very Good | |
| Overall Trend Score: 57 | |
| YTD Performance: 3.26% | |
| **Trend Scores & Views Are Only For Educational Purposes And Not For Investing | |
| 12Stocks.com: Top Performing Healthcare Sector Stocks | ||||||||||||||||||||||||||||||||||||||||||||||||
 The top performing Healthcare sector stocks year to date are
Now, more recently, over last week, the top performing Healthcare sector stocks on the move are


|
||||||||||||||||||||||||||||||||||||||||||||||||
| 12Stocks.com: Investing in Healthcare Sector using Exchange Traded Funds | |
|
The following table shows list of key exchange traded funds (ETF) that
help investors track Healthcare Index. For detailed view, check out our ETF Funds section of our website. Quick View: Move mouse or cursor over ETF symbol (ticker) to view short-term Technical chart and over ETF name to view long term chart. Click on ticker or stock name for detailed view. Click on to add stock symbol to your watchlist and to view watchlist. |
12Stocks.com List of ETFs that track Healthcare Index
| Ticker | ETF Name | Watchlist | Recent Price | Smart Investing & Trading Score | Change % | Week % | Year-to-date % |
| XLV | Health Care | | 140.83 | 57 | 0.25 | 0.62 | 3.26% |
| XBI | Biotech | | 89.98 | 69 | 1.86 | 7.77 | 0.77% |
| IBB | Biotechnology | | 132.96 | 69 | 1.77 | 5.12 | -2.13% |
| BBH | Biotech | | 164.15 | 100 | 2.27 | 5.46 | -0.7% |
| VHT | Health Care | | 258.02 | 57 | 0.34 | 1.06 | 2.92% |
| IYH | Healthcare | | 59.26 | 57 | 0.24 | 1.11 | 3.51% |
| IHF | Healthcare Providers | | 51.69 | 30 | 0.08 | -0.44 | -1.56% |
| IHI | Medical Devices | | 55.49 | 32 | 0.60 | -0.07 | 2.82% |
| BIB | Biotechnology | | 55.63 | 74 | 3.40 | 12.02 | -2.49% |
| BIS | Short Biotech | | 17.99 | 36 | -3.59 | -11.03 | -0.44% |
| XHE | Health Care Equipment | | 85.99 | 87 | 1.30 | 4.32 | 2.05% |
| CURE | Healthcare Bull 3X | | 106.89 | 57 | 1.02 | 1.51 | 5.06% |
| LABU | Biotech Bull 3X | | 108.99 | 64 | 5.83 | 24.55 | -10.64% |
| LABD | Biotech Bear 3X | | 8.28 | 36 | -5.48 | -21.29 | -14.55% |
| PSCH | SmallCap Health Care | | 42.43 | 82 | 0.90 | 4.25 | -0.86% |
| XHS | Health Care Services | | 88.53 | 39 | 0.44 | 0.75 | -0.47% |
| PTH | DWA Healthcare Momentum | | 42.05 | 62 | 0.74 | 5.41 | 7.43% |
| BTEC | Principal Healthcare Innovators | | 36.97 | 69 | 2.74 | 7.94 | 1.76% |
| RXL | Health Care | | 95.65 | 57 | 0.46 | 0.87 | 4.64% |
| RXD | Short Health Care | | 11.29 | 49 | -0.49 | -1.44 | -5.37% |
| 12Stocks.com: Charts, Trends, Fundamental Data and Performances of Healthcare Stocks | |
|
We now take in-depth look at all Healthcare stocks including charts, multi-period performances and overall trends (as measured by Smart Investing & Trading Score). One can sort Healthcare stocks (click link to choose) by Daily, Weekly and by Year-to-Date performances. Also, one can sort by size of the company or by market capitalization. |
| Select Your Default Chart Type: | |||||
| |||||
| Click on stock symbol or name for detailed view. Click on to add stock symbol to your watchlist and to view watchlist. Quick View: Move mouse or cursor over "Daily" to quickly view daily Technical stock chart and over "Weekly" to view weekly Technical stock chart. | |||||

 | IMNM Immunome, Inc. |
| Sector: Health Care | |
| SubSector: Biotechnology | |
| MarketCap: 12487 Millions | |
| Recent Price: 15.78 Smart Investing & Trading Score: 32 | |
| Day Percent Change: 5.41% Day Change: 0.81 | |
| Week Change: 14.93% Year-to-date Change: 47.6% | |
| IMNM Links: Profile News Message Board | |
| Charts:- Daily , Weekly | |
| Add IMNM to Watchlist: View: Get Complete IMNM Trend Analysis ➞ | |
 | AKBA Akebia Therapeutics, Inc. |
| Sector: Health Care | |
| SubSector: Biotechnology | |
| MarketCap: 794.285 Millions | |
| Recent Price: 1.37 Smart Investing & Trading Score: 32 | |
| Day Percent Change: 5.38% Day Change: 0.07 | |
| Week Change: 2.24% Year-to-date Change: 10.5% | |
| AKBA Links: Profile News Message Board | |
| Charts:- Daily , Weekly | |
| Add AKBA to Watchlist: View: Get Complete AKBA Trend Analysis ➞ | |
 | SWTX SpringWorks Therapeutics, Inc. |
| Sector: Health Care | |
| SubSector: Biotechnology | |
| MarketCap: 1311.85 Millions | |
| Recent Price: 45.11 Smart Investing & Trading Score: 32 | |
| Day Percent Change: 4.06% Day Change: 1.76 | |
| Week Change: -0.92% Year-to-date Change: 23.6% | |
| SWTX Links: Profile News Message Board | |
| Charts:- Daily , Weekly | |
| Add SWTX to Watchlist: View: Get Complete SWTX Trend Analysis ➞ | |
 | ETNB 89bio, Inc. |
| Sector: Health Care | |
| SubSector: Biotechnology | |
| MarketCap: 517.485 Millions | |
| Recent Price: 9.22 Smart Investing & Trading Score: 32 | |
| Day Percent Change: 4.06% Day Change: 0.36 | |
| Week Change: 11.62% Year-to-date Change: -17.5% | |
| ETNB Links: Profile News Message Board | |
| Charts:- Daily , Weekly | |
| Add ETNB to Watchlist: View: Get Complete ETNB Trend Analysis ➞ | |
 | ZBH Zimmer Biomet Holdings, Inc. |
| Sector: Health Care | |
| SubSector: Medical Appliances & Equipment | |
| MarketCap: 19339.4 Millions | |
| Recent Price: 121.66 Smart Investing & Trading Score: 32 | |
| Day Percent Change: 2.70% Day Change: 3.20 | |
| Week Change: 1.94% Year-to-date Change: 0.0% | |
| ZBH Links: Profile News Message Board | |
| Charts:- Daily , Weekly | |
| Add ZBH to Watchlist: View: Get Complete ZBH Trend Analysis ➞ | |
 | LXRX Lexicon Pharmaceuticals, Inc. |
| Sector: Health Care | |
| SubSector: Biotechnology | |
| MarketCap: 251.185 Millions | |
| Recent Price: 1.74 Smart Investing & Trading Score: 32 | |
| Day Percent Change: 2.35% Day Change: 0.04 | |
| Week Change: 10.13% Year-to-date Change: 13.7% | |
| LXRX Links: Profile News Message Board | |
| Charts:- Daily , Weekly | |
| Add LXRX to Watchlist: View: Get Complete LXRX Trend Analysis ➞ | |
 | HRTX Heron Therapeutics, Inc. |
| Sector: Health Care | |
| SubSector: Biotechnology | |
| MarketCap: 1172.75 Millions | |
| Recent Price: 2.61 Smart Investing & Trading Score: 32 | |
| Day Percent Change: 2.35% Day Change: 0.06 | |
| Week Change: 6.53% Year-to-date Change: 53.5% | |
| HRTX Links: Profile News Message Board | |
| Charts:- Daily , Weekly | |
| Add HRTX to Watchlist: View: Get Complete HRTX Trend Analysis ➞ | |
 | PTGX Protagonist Therapeutics, Inc. |
| Sector: Health Care | |
| SubSector: Biotechnology | |
| MarketCap: 165.285 Millions | |
| Recent Price: 26.09 Smart Investing & Trading Score: 32 | |
| Day Percent Change: 2.15% Day Change: 0.55 | |
| Week Change: 3.74% Year-to-date Change: 13.8% | |
| PTGX Links: Profile News Message Board | |
| Charts:- Daily , Weekly | |
| Add PTGX to Watchlist: View: Get Complete PTGX Trend Analysis ➞ | |
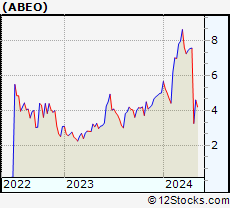 | ABEO Abeona Therapeutics Inc. |
| Sector: Health Care | |
| SubSector: Biotechnology | |
| MarketCap: 224.985 Millions | |
| Recent Price: 4.60 Smart Investing & Trading Score: 32 | |
| Day Percent Change: 13.02% Day Change: 0.53 | |
| Week Change: 41.1% Year-to-date Change: -8.2% | |
| ABEO Links: Profile News Message Board | |
| Charts:- Daily , Weekly | |
| Add ABEO to Watchlist: View: Get Complete ABEO Trend Analysis ➞ | |
 | AUTL Autolus Therapeutics plc |
| Sector: Health Care | |
| SubSector: Biotechnology | |
| MarketCap: 296.285 Millions | |
| Recent Price: 4.19 Smart Investing & Trading Score: 32 | |
| Day Percent Change: 1.95% Day Change: 0.08 | |
| Week Change: 4.75% Year-to-date Change: -34.9% | |
| AUTL Links: Profile News Message Board | |
| Charts:- Daily , Weekly | |
| Add AUTL to Watchlist: View: Get Complete AUTL Trend Analysis ➞ | |
 | GEHC GE HealthCare Technologies Inc. |
| Sector: Health Care | |
| SubSector: Health Information Services | |
| MarketCap: 36240 Millions | |
| Recent Price: 79.50 Smart Investing & Trading Score: 32 | |
| Day Percent Change: 1.86% Day Change: 1.45 | |
| Week Change: -7.77% Year-to-date Change: 2.8% | |
| GEHC Links: Profile News Message Board | |
| Charts:- Daily , Weekly | |
| Add GEHC to Watchlist: View: Get Complete GEHC Trend Analysis ➞ | |
 | BEAM Beam Therapeutics Inc. |
| Sector: Health Care | |
| SubSector: Biotechnology | |
| MarketCap: 44987 Millions | |
| Recent Price: 23.13 Smart Investing & Trading Score: 32 | |
| Day Percent Change: 1.80% Day Change: 0.41 | |
| Week Change: 8.19% Year-to-date Change: -15.0% | |
| BEAM Links: Profile News Message Board | |
| Charts:- Daily , Weekly | |
| Add BEAM to Watchlist: View: Get Complete BEAM Trend Analysis ➞ | |
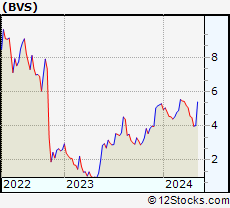 | BVS Bioventus Inc. |
| Sector: Health Care | |
| SubSector: Medical Devices | |
| MarketCap: 234 Millions | |
| Recent Price: 4.02 Smart Investing & Trading Score: 32 | |
| Day Percent Change: 1.77% Day Change: 0.07 | |
| Week Change: 1.01% Year-to-date Change: -24.0% | |
| BVS Links: Profile News Message Board | |
| Charts:- Daily , Weekly | |
| Add BVS to Watchlist: View: Get Complete BVS Trend Analysis ➞ | |
 | CRL Charles River Laboratories International, Inc. |
| Sector: Health Care | |
| SubSector: Medical Laboratories & Research | |
| MarketCap: 5700.5 Millions | |
| Recent Price: 233.47 Smart Investing & Trading Score: 32 | |
| Day Percent Change: 1.56% Day Change: 3.58 | |
| Week Change: 1.94% Year-to-date Change: -1.2% | |
| CRL Links: Profile News Message Board | |
| Charts:- Daily , Weekly | |
| Add CRL to Watchlist: View: Get Complete CRL Trend Analysis ➞ | |
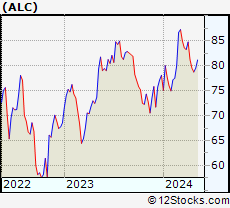 | ALC Alcon, Inc. |
| Sector: Health Care | |
| SubSector: Medical Instruments & Supplies | |
| MarketCap: 20968.1 Millions | |
| Recent Price: 79.57 Smart Investing & Trading Score: 32 | |
| Day Percent Change: 1.47% Day Change: 1.15 | |
| Week Change: 1.02% Year-to-date Change: 1.9% | |
| ALC Links: Profile News Message Board | |
| Charts:- Daily , Weekly | |
| Add ALC to Watchlist: View: Get Complete ALC Trend Analysis ➞ | |
 | CYTK Cytokinetics, Incorporated |
| Sector: Health Care | |
| SubSector: Biotechnology | |
| MarketCap: 654.285 Millions | |
| Recent Price: 65.27 Smart Investing & Trading Score: 32 | |
| Day Percent Change: 1.45% Day Change: 0.93 | |
| Week Change: -0.11% Year-to-date Change: -21.8% | |
| CYTK Links: Profile News Message Board | |
| Charts:- Daily , Weekly | |
| Add CYTK to Watchlist: View: Get Complete CYTK Trend Analysis ➞ | |
 | ARVN Arvinas, Inc. |
| Sector: Health Care | |
| SubSector: Biotechnology | |
| MarketCap: 3469.85 Millions | |
| Recent Price: 32.82 Smart Investing & Trading Score: 32 | |
| Day Percent Change: 1.20% Day Change: 0.39 | |
| Week Change: 1.39% Year-to-date Change: -20.3% | |
| ARVN Links: Profile News Message Board | |
| Charts:- Daily , Weekly | |
| Add ARVN to Watchlist: View: Get Complete ARVN Trend Analysis ➞ | |
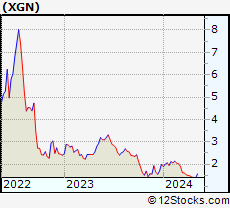 | XGN Exagen Inc. |
| Sector: Health Care | |
| SubSector: Medical Laboratories & Research | |
| MarketCap: 231.7 Millions | |
| Recent Price: 1.40 Smart Investing & Trading Score: 32 | |
| Day Percent Change: 1.08% Day Change: 0.01 | |
| Week Change: -0.85% Year-to-date Change: -29.7% | |
| XGN Links: Profile News Message Board | |
| Charts:- Daily , Weekly | |
| Add XGN to Watchlist: View: Get Complete XGN Trend Analysis ➞ | |
 | ACLX Arcellx, Inc. |
| Sector: Health Care | |
| SubSector: Biotechnology | |
| MarketCap: 1530 Millions | |
| Recent Price: 53.63 Smart Investing & Trading Score: 32 | |
| Day Percent Change: 1.06% Day Change: 0.57 | |
| Week Change: 3.39% Year-to-date Change: -3.9% | |
| ACLX Links: Profile News Message Board | |
| Charts:- Daily , Weekly | |
| Add ACLX to Watchlist: View: Get Complete ACLX Trend Analysis ➞ | |
 | COO The Cooper Companies, Inc. |
| Sector: Health Care | |
| SubSector: Medical Instruments & Supplies | |
| MarketCap: 15460 Millions | |
| Recent Price: 90.64 Smart Investing & Trading Score: 32 | |
| Day Percent Change: 0.99% Day Change: 0.89 | |
| Week Change: 2.03% Year-to-date Change: -4.2% | |
| COO Links: Profile News Message Board | |
| Charts:- Daily , Weekly | |
| Add COO to Watchlist: View: Get Complete COO Trend Analysis ➞ | |
 | CNTA Centessa Pharmaceuticals plc |
| Sector: Health Care | |
| SubSector: Biotechnology | |
| MarketCap: 616 Millions | |
| Recent Price: 9.53 Smart Investing & Trading Score: 32 | |
| Day Percent Change: 0.95% Day Change: 0.09 | |
| Week Change: 6.66% Year-to-date Change: 18.0% | |
| CNTA Links: Profile News Message Board | |
| Charts:- Daily , Weekly | |
| Add CNTA to Watchlist: View: Get Complete CNTA Trend Analysis ➞ | |
 | NERV Minerva Neurosciences, Inc. |
| Sector: Health Care | |
| SubSector: Biotechnology | |
| MarketCap: 223.385 Millions | |
| Recent Price: 2.37 Smart Investing & Trading Score: 32 | |
| Day Percent Change: 0.85% Day Change: 0.02 | |
| Week Change: -2.75% Year-to-date Change: -61.5% | |
| NERV Links: Profile News Message Board | |
| Charts:- Daily , Weekly | |
| Add NERV to Watchlist: View: Get Complete NERV Trend Analysis ➞ | |
 | RCEL Avita Medical Limited |
| Sector: Health Care | |
| SubSector: Medical Appliances & Equipment | |
| MarketCap: 481.18 Millions | |
| Recent Price: 8.75 Smart Investing & Trading Score: 32 | |
| Day Percent Change: 0.34% Day Change: 0.03 | |
| Week Change: 2.7% Year-to-date Change: -36.2% | |
| RCEL Links: Profile News Message Board | |
| Charts:- Daily , Weekly | |
| Add RCEL to Watchlist: View: Get Complete RCEL Trend Analysis ➞ | |
 | KZR Kezar Life Sciences, Inc. |
| Sector: Health Care | |
| SubSector: Biotechnology | |
| MarketCap: 174.885 Millions | |
| Recent Price: 0.86 Smart Investing & Trading Score: 32 | |
| Day Percent Change: 0.32% Day Change: 0.00 | |
| Week Change: 6.52% Year-to-date Change: -9.5% | |
| KZR Links: Profile News Message Board | |
| Charts:- Daily , Weekly | |
| Add KZR to Watchlist: View: Get Complete KZR Trend Analysis ➞ | |
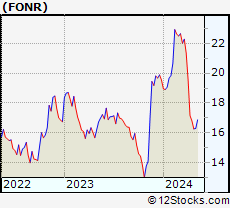 | FONR FONAR Corporation |
| Sector: Health Care | |
| SubSector: Medical Appliances & Equipment | |
| MarketCap: 92.408 Millions | |
| Recent Price: 16.31 Smart Investing & Trading Score: 32 | |
| Day Percent Change: 0.31% Day Change: 0.05 | |
| Week Change: 0.25% Year-to-date Change: -16.6% | |
| FONR Links: Profile News Message Board | |
| Charts:- Daily , Weekly | |
| Add FONR to Watchlist: View: Get Complete FONR Trend Analysis ➞ | |
| For tabular summary view of above stock list: Summary View ➞ 0 - 25 , 25 - 50 , 50 - 75 , 75 - 100 , 100 - 125 , 125 - 150 , 150 - 175 , 175 - 200 , 200 - 225 , 225 - 250 , 250 - 275 , 275 - 300 , 300 - 325 , 325 - 350 , 350 - 375 , 375 - 400 , 400 - 425 , 425 - 450 , 450 - 475 , 475 - 500 , 500 - 525 , 525 - 550 , 550 - 575 , 575 - 600 , 600 - 625 , 625 - 650 , 650 - 675 , 675 - 700 , 700 - 725 | ||
| Click To Change The Sort Order: By Market Cap or Company Size Performance: Year-to-date, Week and Day | |
| Select Chart Type: | ||
|
Best Stocks Today 12Stocks.com |
© 2024 12Stocks.com Terms & Conditions Privacy Contact Us
All Information Provided Only For Education And Not To Be Used For Investing or Trading. See Terms & Conditions


One More Thing ... Get Best Stocks Delivered Daily!
Never Ever Miss A Move With Our Top Ten Stocks Lists
Find Best Stocks In Any Market - Bull or Bear Market
Take A Peek At Our Top Ten Stocks Lists: Daily, Weekly, Year-to-Date & Top Trends
Find Best Stocks In Any Market - Bull or Bear Market
Take A Peek At Our Top Ten Stocks Lists: Daily, Weekly, Year-to-Date & Top Trends
Healthcare Stocks With Best Up Trends [0-bearish to 100-bullish]: Twist Bioscience[100], Joint [100], Tandem Diabetes[100], Alignment [100], Emergent Bio[100], DURECT [100], Amgen [100], LeMaitre Vascular[100], Select [100], Quantum-Si [100], Janux [100]
Best Healthcare Stocks Year-to-Date:
Pieris [5987.91%], Avenue [2868.94%], Precision BioSciences[2782.19%], Inovio [2272.55%], Assembly Biosciences[1503.46%], Agenus [1478.69%], Aurora Cannabis[1315.37%], Adverum Biotechnologies[1285.49%], NuCana [1252.27%], Affimed N.V[767.2%], GeneDx [625.37%] Best Healthcare Stocks This Week:
CytomX [178.62%], Emergent Bio[102.6%], GeneDx [78.07%], Deciphera [73.24%], Cue Biopharma[56.04%], Codexis [47.37%], Abeona [41.1%], Seres [40.61%], TransMedics [39%], Ardelyx [35.83%], Poseida [35.21%] Best Healthcare Stocks Daily:
Twist Bioscience[28.74%], Ardelyx [28.42%], Joint [25.35%], Tandem Diabetes[22.32%], Alignment [21.97%], Emergent Bio[17.88%], Butterfly Network[17.42%], Codexis [17.37%], Vaxxinity [17.27%], DURECT [17.17%], OptiNose [15.09%]