
 Login Sign Up


| |||||
 |  | ||||

| 12Stocks.com Market Intelligence |
Best Healthcare Stocks
 | "Discover best trending healthcare stocks with 12Stocks.com." |
| - Subu Vdaygiri, Founder, 12Stocks.com |
| In a hurry? Healthcare Stocks Lists: Performance Trends Table, Stock Charts
Sort Healthcare stocks: Daily, Weekly, Year-to-Date, Market Cap & Trends. Filter Healthcare stocks list by size:All Healthcare Large Mid-Range Small |
| 12Stocks.com Healthcare Stocks Performances & Trends Daily | |||||||||
|
|  The overall Smart Investing & Trading Score is 57 (0-bearish to 100-bullish) which puts Healthcare sector in short term neutral trend. The Smart Investing & Trading Score from previous trading session is 60 and a deterioration of trend continues.
| ||||||||
Here are the Smart Investing & Trading Scores of the most requested Healthcare stocks at 12Stocks.com (click stock name for detailed review):
|


| 12Stocks.com: Investing in Healthcare sector with Stocks | |
|
The following table helps investors and traders sort through current performance and trends (as measured by Smart Investing & Trading Score) of various
stocks in the Healthcare sector. Quick View: Move mouse or cursor over stock symbol (ticker) to view short-term Technical chart and over stock name to view long term chart. Click on  to add stock symbol to your watchlist and to add stock symbol to your watchlist and  to view watchlist. Click on any ticker or stock name for detailed market intelligence report for that stock. to view watchlist. Click on any ticker or stock name for detailed market intelligence report for that stock. |
12Stocks.com Performance of Stocks in Healthcare Sector
| Ticker | Stock Name | Watchlist | Category | Recent Price | Smart Investing & Trading Score | Change % | YTD Change% |
| GPCR | Structure |   | Biotechnology | 39.91 | 64 | 2.78% | 4.82% |
| PCVX | Vaxcyte | | Biotechnology | 65.97 | 64 | 2.20% | 5.10% |
| LFST | LifeStance Health | | Medical Care Facilities | 6.57 | 64 | 2.18% | -17.06% |
| CRVS | Corvus | | Biotechnology | 1.92 | 64 | 10.98% | 9.09% |
| GRTS | Gritstone Oncology | | Biotechnology | 0.96 | 64 | 10.66% | -52.81% |
| XENE | Xenon | | Biotechnology | 43.75 | 64 | 1.74% | -5.02% |
| SRRK | Scholar Rock | | Biotechnology | 15.35 | 64 | 1.66% | -18.35% |
| SNN | Smith & Nephew | | Equipment | 24.78 | 64 | 1.39% | -9.16% |
| PETQ | PetIQ | | Pharmaceutical | 17.04 | 64 | 1.19% | -13.72% |
| MDT | Medtronic | | Equipment | 81.69 | 64 | 0.95% | -0.84% |
| IMCR | Immunocore | | Biotechnology | 60.03 | 64 | 0.95% | -11.58% |
| MIRM | Mirum | | Biotechnology | 25.84 | 64 | 0.94% | -12.47% |
| CARA | Cara | | Biotechnology | 0.78 | 64 | 0.78% | 4.74% |
| STE | STERIS | | Instruments | 207.82 | 64 | 0.77% | -5.47% |
| TRVN | Trevena | | Biotechnology | 0.41 | 64 | 0.76% | -42.86% |
| RDY | Dr. Reddy | | Pharmaceutical | 75.21 | 64 | 0.58% | 8.09% |
| BBIO | BridgeBio Pharma | | Biotechnology | 27.83 | 64 | 0.32% | -31.06% |
| PLSE | Pulse Biosciences | | Instruments | 7.82 | 64 | -2.86% | -36.11% |
| UBX | Unity Biotechnology | | Biotechnology | 1.61 | 64 | -1.23% | -16.58% |
| BWAY | Brainsway | | Laboratories | 5.78 | 64 | -0.69% | -10.80% |
| KALV | KalVista | | Biotechnology | 12.13 | 64 | -0.33% | -0.98% |
| NRC | National Research | | Laboratories | 34.87 | 64 | -0.29% | -11.86% |
| ZTS | Zoetis | | Pharmaceutical | 167.07 | 64 | -0.10% | -15.35% |
| XFOR | X4 | | Biotechnology | 1.15 | 63 | 6.48% | 37.15% |
| ASMB | Assembly Biosciences | | Biotechnology | 13.15 | 63 | 2.65% | NA |
| For chart view version of above stock list: Chart View ➞ 0 - 25 , 25 - 50 , 50 - 75 , 75 - 100 , 100 - 125 , 125 - 150 , 150 - 175 , 175 - 200 , 200 - 225 , 225 - 250 , 250 - 275 , 275 - 300 , 300 - 325 , 325 - 350 , 350 - 375 , 375 - 400 , 400 - 425 , 425 - 450 , 450 - 475 , 475 - 500 , 500 - 525 , 525 - 550 , 550 - 575 , 575 - 600 , 600 - 625 , 625 - 650 , 650 - 675 , 675 - 700 , 700 - 725 | ||
 | Click To Change The Sort Order: By Market Cap or Company Size Performance: Year-to-date, Week and Day |  |
|
Get the most comprehensive stock market coverage daily at 12Stocks.com ➞ Best Stocks Today ➞ Best Stocks Weekly ➞ Best Stocks Year-to-Date ➞ Best Stocks Trends ➞  Best Stocks Today 12Stocks.com Best Nasdaq Stocks ➞ Best S&P 500 Stocks ➞ Best Tech Stocks ➞ Best Biotech Stocks ➞ |
| Detailed Overview of Healthcare Stocks |
| Healthcare Technical Overview, Leaders & Laggards, Top Healthcare ETF Funds & Detailed Healthcare Stocks List, Charts, Trends & More |
| Healthcare Sector: Technical Analysis, Trends & YTD Performance | |
| Healthcare sector is composed of stocks
from pharmaceutical, biotech, diagnostics labs, insurance providers
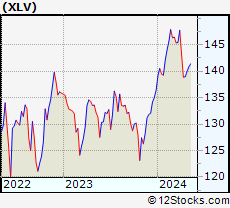
and healthcare services. Healthcare sector, as represented by XLV, an exchange-traded fund [ETF] that holds basket of Healthcare stocks (e.g, Merck, Amgen) is up by 3.26% and is currently underperforming the overall market by -3.62% year-to-date. Below is a quick view of Technical charts and trends: |
|
 XLV Weekly Chart |
|
| Long Term Trend: Not Good | |
| Medium Term Trend: Good | |
 XLV Daily Chart |
|
| Short Term Trend: Very Good | |
| Overall Trend Score: 57 | |
| YTD Performance: 3.26% | |
| **Trend Scores & Views Are Only For Educational Purposes And Not For Investing | |
| 12Stocks.com: Top Performing Healthcare Sector Stocks | ||||||||||||||||||||||||||||||||||||||||||||||||
 The top performing Healthcare sector stocks year to date are
Now, more recently, over last week, the top performing Healthcare sector stocks on the move are


|
||||||||||||||||||||||||||||||||||||||||||||||||
| 12Stocks.com: Investing in Healthcare Sector using Exchange Traded Funds | |
|
The following table shows list of key exchange traded funds (ETF) that
help investors track Healthcare Index. For detailed view, check out our ETF Funds section of our website. Quick View: Move mouse or cursor over ETF symbol (ticker) to view short-term Technical chart and over ETF name to view long term chart. Click on ticker or stock name for detailed view. Click on to add stock symbol to your watchlist and to view watchlist. |
12Stocks.com List of ETFs that track Healthcare Index
| Ticker | ETF Name | Watchlist | Recent Price | Smart Investing & Trading Score | Change % | Week % | Year-to-date % |
| XLV | Health Care | | 140.83 | 57 | 0.25 | 0.62 | 3.26% |
| XBI | Biotech | | 89.98 | 69 | 1.86 | 7.77 | 0.77% |
| IBB | Biotechnology | | 132.96 | 69 | 1.77 | 5.12 | -2.13% |
| BBH | Biotech | | 164.15 | 100 | 2.27 | 5.46 | -0.7% |
| VHT | Health Care | | 258.02 | 37 | 0.34 | 1.06 | 2.92% |
| IYH | Healthcare | | 59.26 | 32 | 0.24 | 1.11 | 3.51% |
| IHF | Healthcare Providers | | 51.69 | 30 | 0.08 | -0.44 | -1.56% |
| IHI | Medical Devices | | 55.49 | 17 | 0.60 | -0.07 | 2.82% |
| BIB | Biotechnology | | 55.63 | 74 | 3.40 | 12.02 | -2.49% |
| BIS | Short Biotech | | 17.99 | 36 | -3.59 | -11.03 | -0.44% |
| XHE | Health Care Equipment | | 85.99 | 67 | 1.30 | 4.32 | 2.05% |
| CURE | Healthcare Bull 3X | | 106.89 | 57 | 1.02 | 1.51 | 5.06% |
| LABU | Biotech Bull 3X | | 108.99 | 64 | 5.83 | 24.55 | -10.64% |
| LABD | Biotech Bear 3X | | 8.28 | 36 | -5.48 | -21.29 | -14.55% |
| PSCH | SmallCap Health Care | | 42.43 | 82 | 0.90 | 4.25 | -0.86% |
| XHS | Health Care Services | | 88.53 | 39 | 0.44 | 0.75 | -0.47% |
| PTH | DWA Healthcare Momentum | | 42.05 | 69 | 0.74 | 5.41 | 7.43% |
| BTEC | Principal Healthcare Innovators | | 36.97 | 69 | 2.74 | 7.94 | 1.76% |
| RXL | Health Care | | 95.65 | 57 | 0.46 | 0.87 | 4.64% |
| RXD | Short Health Care | | 11.29 | 49 | -0.49 | -1.44 | -5.37% |
| 12Stocks.com: Charts, Trends, Fundamental Data and Performances of Healthcare Stocks | |
|
We now take in-depth look at all Healthcare stocks including charts, multi-period performances and overall trends (as measured by Smart Investing & Trading Score). One can sort Healthcare stocks (click link to choose) by Daily, Weekly and by Year-to-Date performances. Also, one can sort by size of the company or by market capitalization. |
| Select Your Default Chart Type: | |||||
| |||||
| Click on stock symbol or name for detailed view. Click on to add stock symbol to your watchlist and to view watchlist. Quick View: Move mouse or cursor over "Daily" to quickly view daily Technical stock chart and over "Weekly" to view weekly Technical stock chart. | |||||

 | GPCR Structure Therapeutics Inc. |
| Sector: Health Care | |
| SubSector: Biotechnology | |
| MarketCap: 1530 Millions | |
| Recent Price: 39.91 Smart Investing & Trading Score: 64 | |
| Day Percent Change: 2.78% Day Change: 1.08 | |
| Week Change: 2.58% Year-to-date Change: 4.8% | |
| GPCR Links: Profile News Message Board | |
| Charts:- Daily , Weekly | |
| Add GPCR to Watchlist: View: Get Complete GPCR Trend Analysis ➞ | |
 | PCVX Vaxcyte, Inc. |
| Sector: Health Care | |
| SubSector: Biotechnology | |
| MarketCap: 13887 Millions | |
| Recent Price: 65.97 Smart Investing & Trading Score: 64 | |
| Day Percent Change: 2.20% Day Change: 1.42 | |
| Week Change: 8.65% Year-to-date Change: 5.1% | |
| PCVX Links: Profile News Message Board | |
| Charts:- Daily , Weekly | |
| Add PCVX to Watchlist: View: Get Complete PCVX Trend Analysis ➞ | |
 | LFST LifeStance Health Group, Inc. |
| Sector: Health Care | |
| SubSector: Medical Care Facilities | |
| MarketCap: 3460 Millions | |
| Recent Price: 6.57 Smart Investing & Trading Score: 64 | |
| Day Percent Change: 2.18% Day Change: 0.14 | |
| Week Change: 5.89% Year-to-date Change: -17.1% | |
| LFST Links: Profile News Message Board | |
| Charts:- Daily , Weekly | |
| Add LFST to Watchlist: View: Get Complete LFST Trend Analysis ➞ | |
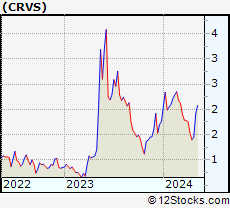 | CRVS Corvus Pharmaceuticals, Inc. |
| Sector: Health Care | |
| SubSector: Biotechnology | |
| MarketCap: 73.7785 Millions | |
| Recent Price: 1.92 Smart Investing & Trading Score: 64 | |
| Day Percent Change: 10.98% Day Change: 0.19 | |
| Week Change: 32.41% Year-to-date Change: 9.1% | |
| CRVS Links: Profile News Message Board | |
| Charts:- Daily , Weekly | |
| Add CRVS to Watchlist: View: Get Complete CRVS Trend Analysis ➞ | |
 | GRTS Gritstone Oncology, Inc. |
| Sector: Health Care | |
| SubSector: Biotechnology | |
| MarketCap: 240.085 Millions | |
| Recent Price: 0.96 Smart Investing & Trading Score: 64 | |
| Day Percent Change: 10.66% Day Change: 0.09 | |
| Week Change: 18.36% Year-to-date Change: -52.8% | |
| GRTS Links: Profile News Message Board | |
| Charts:- Daily , Weekly | |
| Add GRTS to Watchlist: View: Get Complete GRTS Trend Analysis ➞ | |
 | XENE Xenon Pharmaceuticals Inc. |
| Sector: Health Care | |
| SubSector: Biotechnology | |
| MarketCap: 388.585 Millions | |
| Recent Price: 43.75 Smart Investing & Trading Score: 64 | |
| Day Percent Change: 1.74% Day Change: 0.75 | |
| Week Change: 8.02% Year-to-date Change: -5.0% | |
| XENE Links: Profile News Message Board | |
| Charts:- Daily , Weekly | |
| Add XENE to Watchlist: View: Get Complete XENE Trend Analysis ➞ | |
 | SRRK Scholar Rock Holding Corporation |
| Sector: Health Care | |
| SubSector: Biotechnology | |
| MarketCap: 441.385 Millions | |
| Recent Price: 15.35 Smart Investing & Trading Score: 64 | |
| Day Percent Change: 1.66% Day Change: 0.25 | |
| Week Change: 5.64% Year-to-date Change: -18.4% | |
| SRRK Links: Profile News Message Board | |
| Charts:- Daily , Weekly | |
| Add SRRK to Watchlist: View: Get Complete SRRK Trend Analysis ➞ | |
 | SNN Smith & Nephew plc |
| Sector: Health Care | |
| SubSector: Medical Appliances & Equipment | |
| MarketCap: 15180.8 Millions | |
| Recent Price: 24.78 Smart Investing & Trading Score: 64 | |
| Day Percent Change: 1.39% Day Change: 0.34 | |
| Week Change: 1.35% Year-to-date Change: -9.2% | |
| SNN Links: Profile News Message Board | |
| Charts:- Daily , Weekly | |
| Add SNN to Watchlist: View: Get Complete SNN Trend Analysis ➞ | |
 | PETQ PetIQ, Inc. |
| Sector: Health Care | |
| SubSector: Drugs - Generic | |
| MarketCap: 587.585 Millions | |
| Recent Price: 17.04 Smart Investing & Trading Score: 64 | |
| Day Percent Change: 1.19% Day Change: 0.20 | |
| Week Change: 3.09% Year-to-date Change: -13.7% | |
| PETQ Links: Profile News Message Board | |
| Charts:- Daily , Weekly | |
| Add PETQ to Watchlist: View: Get Complete PETQ Trend Analysis ➞ | |
 | MDT Medtronic plc |
| Sector: Health Care | |
| SubSector: Medical Appliances & Equipment | |
| MarketCap: 113698 Millions | |
| Recent Price: 81.69 Smart Investing & Trading Score: 64 | |
| Day Percent Change: 0.95% Day Change: 0.77 | |
| Week Change: 2.45% Year-to-date Change: -0.8% | |
| MDT Links: Profile News Message Board | |
| Charts:- Daily , Weekly | |
| Add MDT to Watchlist: View: Get Complete MDT Trend Analysis ➞ | |
 | IMCR Immunocore Holdings plc |
| Sector: Health Care | |
| SubSector: Biotechnology | |
| MarketCap: 2830 Millions | |
| Recent Price: 60.03 Smart Investing & Trading Score: 64 | |
| Day Percent Change: 0.95% Day Change: 0.56 | |
| Week Change: 2.6% Year-to-date Change: -11.6% | |
| IMCR Links: Profile News Message Board | |
| Charts:- Daily , Weekly | |
| Add IMCR to Watchlist: View: Get Complete IMCR Trend Analysis ➞ | |
 | MIRM Mirum Pharmaceuticals, Inc. |
| Sector: Health Care | |
| SubSector: Biotechnology | |
| MarketCap: 309.585 Millions | |
| Recent Price: 25.84 Smart Investing & Trading Score: 64 | |
| Day Percent Change: 0.94% Day Change: 0.24 | |
| Week Change: 5.64% Year-to-date Change: -12.5% | |
| MIRM Links: Profile News Message Board | |
| Charts:- Daily , Weekly | |
| Add MIRM to Watchlist: View: Get Complete MIRM Trend Analysis ➞ | |
 | CARA Cara Therapeutics, Inc. |
| Sector: Health Care | |
| SubSector: Biotechnology | |
| MarketCap: 597.985 Millions | |
| Recent Price: 0.78 Smart Investing & Trading Score: 64 | |
| Day Percent Change: 0.78% Day Change: 0.01 | |
| Week Change: 13.72% Year-to-date Change: 4.7% | |
| CARA Links: Profile News Message Board | |
| Charts:- Daily , Weekly | |
| Add CARA to Watchlist: View: Get Complete CARA Trend Analysis ➞ | |
 | STE STERIS plc |
| Sector: Health Care | |
| SubSector: Medical Instruments & Supplies | |
| MarketCap: 10875 Millions | |
| Recent Price: 207.82 Smart Investing & Trading Score: 64 | |
| Day Percent Change: 0.77% Day Change: 1.58 | |
| Week Change: 1.92% Year-to-date Change: -5.5% | |
| STE Links: Profile News Message Board | |
| Charts:- Daily , Weekly | |
| Add STE to Watchlist: View: Get Complete STE Trend Analysis ➞ | |
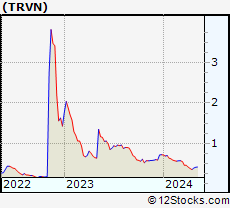 | TRVN Trevena, Inc. |
| Sector: Health Care | |
| SubSector: Biotechnology | |
| MarketCap: 57.7785 Millions | |
| Recent Price: 0.41 Smart Investing & Trading Score: 64 | |
| Day Percent Change: 0.76% Day Change: 0.00 | |
| Week Change: 5.52% Year-to-date Change: -42.9% | |
| TRVN Links: Profile News Message Board | |
| Charts:- Daily , Weekly | |
| Add TRVN to Watchlist: View: Get Complete TRVN Trend Analysis ➞ | |
 | RDY Dr. Reddy s Laboratories Limited |
| Sector: Health Care | |
| SubSector: Drug Manufacturers - Other | |
| MarketCap: 6590.23 Millions | |
| Recent Price: 75.21 Smart Investing & Trading Score: 64 | |
| Day Percent Change: 0.58% Day Change: 0.43 | |
| Week Change: 0.89% Year-to-date Change: 8.1% | |
| RDY Links: Profile News Message Board | |
| Charts:- Daily , Weekly | |
| Add RDY to Watchlist: View: Get Complete RDY Trend Analysis ➞ | |
 | BBIO BridgeBio Pharma, Inc. |
| Sector: Health Care | |
| SubSector: Biotechnology | |
| MarketCap: 3879.35 Millions | |
| Recent Price: 27.83 Smart Investing & Trading Score: 64 | |
| Day Percent Change: 0.32% Day Change: 0.09 | |
| Week Change: 11.86% Year-to-date Change: -31.1% | |
| BBIO Links: Profile News Message Board | |
| Charts:- Daily , Weekly | |
| Add BBIO to Watchlist: View: Get Complete BBIO Trend Analysis ➞ | |
 | PLSE Pulse Biosciences, Inc. |
| Sector: Health Care | |
| SubSector: Medical Instruments & Supplies | |
| MarketCap: 131.96 Millions | |
| Recent Price: 7.82 Smart Investing & Trading Score: 64 | |
| Day Percent Change: -2.86% Day Change: -0.23 | |
| Week Change: 8.76% Year-to-date Change: -36.1% | |
| PLSE Links: Profile News Message Board | |
| Charts:- Daily , Weekly | |
| Add PLSE to Watchlist: View: Get Complete PLSE Trend Analysis ➞ | |
 | UBX Unity Biotechnology, Inc. |
| Sector: Health Care | |
| SubSector: Biotechnology | |
| MarketCap: 254.985 Millions | |
| Recent Price: 1.61 Smart Investing & Trading Score: 64 | |
| Day Percent Change: -1.23% Day Change: -0.02 | |
| Week Change: 7.33% Year-to-date Change: -16.6% | |
| UBX Links: Profile News Message Board | |
| Charts:- Daily , Weekly | |
| Add UBX to Watchlist: View: Get Complete UBX Trend Analysis ➞ | |
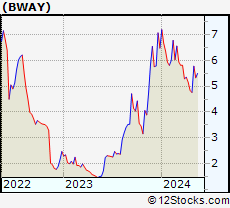 | BWAY Brainsway Ltd. |
| Sector: Health Care | |
| SubSector: Medical Laboratories & Research | |
| MarketCap: 65.03 Millions | |
| Recent Price: 5.78 Smart Investing & Trading Score: 64 | |
| Day Percent Change: -0.69% Day Change: -0.04 | |
| Week Change: 21.43% Year-to-date Change: -10.8% | |
| BWAY Links: Profile News Message Board | |
| Charts:- Daily , Weekly | |
| Add BWAY to Watchlist: View: Get Complete BWAY Trend Analysis ➞ | |
 | KALV KalVista Pharmaceuticals, Inc. |
| Sector: Health Care | |
| SubSector: Biotechnology | |
| MarketCap: 138.385 Millions | |
| Recent Price: 12.13 Smart Investing & Trading Score: 64 | |
| Day Percent Change: -0.33% Day Change: -0.04 | |
| Week Change: 12.52% Year-to-date Change: -1.0% | |
| KALV Links: Profile News Message Board | |
| Charts:- Daily , Weekly | |
| Add KALV to Watchlist: View: Get Complete KALV Trend Analysis ➞ | |
 | NRC National Research Corporation |
| Sector: Health Care | |
| SubSector: Medical Laboratories & Research | |
| MarketCap: 1187.7 Millions | |
| Recent Price: 34.87 Smart Investing & Trading Score: 64 | |
| Day Percent Change: -0.29% Day Change: -0.10 | |
| Week Change: 3.14% Year-to-date Change: -11.9% | |
| NRC Links: Profile News Message Board | |
| Charts:- Daily , Weekly | |
| Add NRC to Watchlist: View: Get Complete NRC Trend Analysis ➞ | |
 | ZTS Zoetis Inc. |
| Sector: Health Care | |
| SubSector: Drugs - Generic | |
| MarketCap: 51921.5 Millions | |
| Recent Price: 167.07 Smart Investing & Trading Score: 64 | |
| Day Percent Change: -0.10% Day Change: -0.16 | |
| Week Change: 5.46% Year-to-date Change: -15.4% | |
| ZTS Links: Profile News Message Board | |
| Charts:- Daily , Weekly | |
| Add ZTS to Watchlist: View: Get Complete ZTS Trend Analysis ➞ | |
 | XFOR X4 Pharmaceuticals, Inc. |
| Sector: Health Care | |
| SubSector: Biotechnology | |
| MarketCap: 143.385 Millions | |
| Recent Price: 1.15 Smart Investing & Trading Score: 63 | |
| Day Percent Change: 6.48% Day Change: 0.07 | |
| Week Change: -1.29% Year-to-date Change: 37.2% | |
| XFOR Links: Profile News Message Board | |
| Charts:- Daily , Weekly | |
| Add XFOR to Watchlist: View: Get Complete XFOR Trend Analysis ➞ | |
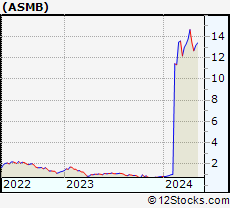 | ASMB Assembly Biosciences, Inc. |
| Sector: Health Care | |
| SubSector: Biotechnology | |
| MarketCap: 569.485 Millions | |
| Recent Price: 13.15 Smart Investing & Trading Score: 63 | |
| Day Percent Change: 2.65% Day Change: 0.34 | |
| Week Change: 3.95% Year-to-date Change: 1,503.5% | |
| ASMB Links: Profile News Message Board | |
| Charts:- Daily , Weekly | |
| Add ASMB to Watchlist: View: Get Complete ASMB Trend Analysis ➞ | |
| For tabular summary view of above stock list: Summary View ➞ 0 - 25 , 25 - 50 , 50 - 75 , 75 - 100 , 100 - 125 , 125 - 150 , 150 - 175 , 175 - 200 , 200 - 225 , 225 - 250 , 250 - 275 , 275 - 300 , 300 - 325 , 325 - 350 , 350 - 375 , 375 - 400 , 400 - 425 , 425 - 450 , 450 - 475 , 475 - 500 , 500 - 525 , 525 - 550 , 550 - 575 , 575 - 600 , 600 - 625 , 625 - 650 , 650 - 675 , 675 - 700 , 700 - 725 | ||
| Click To Change The Sort Order: By Market Cap or Company Size Performance: Year-to-date, Week and Day | |
| Select Chart Type: | ||
|
Best Stocks Today 12Stocks.com |
© 2024 12Stocks.com Terms & Conditions Privacy Contact Us
All Information Provided Only For Education And Not To Be Used For Investing or Trading. See Terms & Conditions


One More Thing ... Get Best Stocks Delivered Daily!
Never Ever Miss A Move With Our Top Ten Stocks Lists
Find Best Stocks In Any Market - Bull or Bear Market
Take A Peek At Our Top Ten Stocks Lists: Daily, Weekly, Year-to-Date & Top Trends
Find Best Stocks In Any Market - Bull or Bear Market
Take A Peek At Our Top Ten Stocks Lists: Daily, Weekly, Year-to-Date & Top Trends
Healthcare Stocks With Best Up Trends [0-bearish to 100-bullish]: Twist Bioscience[100], Joint [100], Tandem Diabetes[100], Alignment [100], Emergent Bio[100], DURECT [100], Amgen [100], LeMaitre Vascular[100], Select [100], Quantum-Si [100], Janux [100]
Best Healthcare Stocks Year-to-Date:
Pieris [5987.91%], Avenue [2868.94%], Precision BioSciences[2782.19%], Inovio [2272.55%], Assembly Biosciences[1503.46%], Agenus [1478.69%], Aurora Cannabis[1315.37%], Adverum Biotechnologies[1285.49%], NuCana [1252.27%], Affimed N.V[767.2%], GeneDx [625.37%] Best Healthcare Stocks This Week:
CytomX [178.62%], Emergent Bio[102.6%], GeneDx [78.07%], Deciphera [73.24%], Cue Biopharma[56.04%], Codexis [47.37%], Abeona [41.1%], Seres [40.61%], TransMedics [39%], Ardelyx [35.83%], Poseida [35.21%] Best Healthcare Stocks Daily:
Twist Bioscience[28.74%], Ardelyx [28.42%], Joint [25.35%], Tandem Diabetes[22.32%], Alignment [21.97%], Emergent Bio[17.88%], Butterfly Network[17.42%], Codexis [17.37%], Vaxxinity [17.27%], DURECT [17.17%], OptiNose [15.09%]