
 Login Sign Up


| |||||
 |  | ||||

| 12Stocks.com Market Intelligence |
Best Healthcare Stocks
 | "Discover best trending healthcare stocks with 12Stocks.com." |
| - Subu Vdaygiri, Founder, 12Stocks.com |
| In a hurry? Healthcare Stocks Lists: Performance Trends Table, Stock Charts
Sort Healthcare stocks: Daily, Weekly, Year-to-Date, Market Cap & Trends. Filter Healthcare stocks list by size:All Healthcare Large Mid-Range Small |
| 12Stocks.com Healthcare Stocks Performances & Trends Daily | |||||||||
|
|  The overall Smart Investing & Trading Score is 57 (0-bearish to 100-bullish) which puts Healthcare sector in short term neutral trend. The Smart Investing & Trading Score from previous trading session is 60 and a deterioration of trend continues.
| ||||||||
Here are the Smart Investing & Trading Scores of the most requested Healthcare stocks at 12Stocks.com (click stock name for detailed review):
|


| 12Stocks.com: Investing in Healthcare sector with Stocks | |
|
The following table helps investors and traders sort through current performance and trends (as measured by Smart Investing & Trading Score) of various
stocks in the Healthcare sector. Quick View: Move mouse or cursor over stock symbol (ticker) to view short-term Technical chart and over stock name to view long term chart. Click on  to add stock symbol to your watchlist and to add stock symbol to your watchlist and  to view watchlist. Click on any ticker or stock name for detailed market intelligence report for that stock. to view watchlist. Click on any ticker or stock name for detailed market intelligence report for that stock. |
12Stocks.com Performance of Stocks in Healthcare Sector
| Ticker | Stock Name | Watchlist | Category | Recent Price | Smart Investing & Trading Score | Change % | YTD Change% |
| AHCO | AdaptHealth |   | Equipment | 10.62 | 95 | 3.51% | 45.68% |
| SILK | Silk Road | | Equipment | 20.91 | 95 | 3.11% | 70.42% |
| AXON | Axovant Sciences | | Biotechnology | 327.93 | 95 | 2.94% | 26.94% |
| PRGO | Perrigo | | Pharmaceutical | 33.43 | 95 | 1.95% | 3.88% |
| CDMO | Avid Bioservices | | Biotechnology | 8.41 | 95 | 1.94% | 29.38% |
| BIIB | Biogen | | Biotechnology | 221.41 | 95 | 1.79% | -14.44% |
| ROIV | Roivant Sciences | | Biotechnology | 11.59 | 95 | 1.76% | 4.37% |
| THC | Tenet | | Hospitals | 122.36 | 95 | 1.73% | 61.92% |
| ARGX | argenx SE | | Biotechnology | 393.71 | 95 | 1.42% | 3.49% |
| VERU | Veru | | Pharmaceutical | 1.65 | 95 | 1.23% | 129.17% |
| HAE | Haemonetics | | Instruments | 95.38 | 95 | 1.04% | 11.54% |
| SRPT | Sarepta | | Biotechnology | 135.03 | 95 | 1.02% | 40.03% |
| VRCA | Verrica | | Biotechnology | 7.33 | 95 | 0.96% | 0.14% |
| OPK | OPKO Health | | Biotechnology | 1.31 | 95 | 0.77% | -13.25% |
| PNTG | Pennant | | Long-Term | 21.57 | 95 | 0.77% | 54.92% |
| MRVI | Maravai LifeSciences | | Biotechnology | 9.02 | 95 | 0.61% | 37.63% |
| SGHT | Sight Sciences | | Medical Devices | 5.80 | 95 | 0.00% | 12.29% |
| CUE | Cue Biopharma | | Biotechnology | 2.06 | 95 | -3.29% | -21.97% |
| LIVN | LivaNova | | Equipment | 62.52 | 95 | -2.54% | 20.83% |
| TLRY | Tilray | | Pharmaceutical | 2.06 | 95 | -2.14% | -10.65% |
| AMRX | Amneal | | Pharmaceutical | 6.65 | 95 | -1.63% | 9.56% |
| ANGO | AngioDynamics | | Instruments | 6.21 | 95 | -0.96% | -20.79% |
| MD | MEDNAX | | Specialized | 9.28 | 95 | -0.54% | -0.22% |
| VALN | Valneva SE | | Biotechnology | 7.71 | 93 | 3.82% | -25.65% |
| AMGN | Amgen | | Biotechnology | 299.41 | 93 | -3.82% | 3.95% |
| For chart view version of above stock list: Chart View ➞ 0 - 25 , 25 - 50 , 50 - 75 , 75 - 100 , 100 - 125 , 125 - 150 , 150 - 175 , 175 - 200 , 200 - 225 , 225 - 250 , 250 - 275 , 275 - 300 , 300 - 325 , 325 - 350 , 350 - 375 , 375 - 400 , 400 - 425 , 425 - 450 , 450 - 475 , 475 - 500 , 500 - 525 , 525 - 550 , 550 - 575 , 575 - 600 , 600 - 625 , 625 - 650 , 650 - 675 , 675 - 700 , 700 - 725 | ||
 | Click To Change The Sort Order: By Market Cap or Company Size Performance: Year-to-date, Week and Day |  |
|
Get the most comprehensive stock market coverage daily at 12Stocks.com ➞ Best Stocks Today ➞ Best Stocks Weekly ➞ Best Stocks Year-to-Date ➞ Best Stocks Trends ➞  Best Stocks Today 12Stocks.com Best Nasdaq Stocks ➞ Best S&P 500 Stocks ➞ Best Tech Stocks ➞ Best Biotech Stocks ➞ |
| Detailed Overview of Healthcare Stocks |
| Healthcare Technical Overview, Leaders & Laggards, Top Healthcare ETF Funds & Detailed Healthcare Stocks List, Charts, Trends & More |
| Healthcare Sector: Technical Analysis, Trends & YTD Performance | |
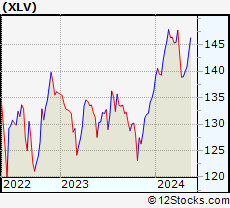
| Healthcare sector is composed of stocks
from pharmaceutical, biotech, diagnostics labs, insurance providers
and healthcare services. Healthcare sector, as represented by XLV, an exchange-traded fund [ETF] that holds basket of Healthcare stocks (e.g, Merck, Amgen) is up by 3.68% and is currently underperforming the overall market by -4.34% year-to-date. Below is a quick view of Technical charts and trends: |
|
 XLV Weekly Chart |
|
| Long Term Trend: Not Good | |
| Medium Term Trend: Very Good | |
 XLV Daily Chart |
|
| Short Term Trend: Very Good | |
| Overall Trend Score: 57 | |
| YTD Performance: 3.68% | |
| **Trend Scores & Views Are Only For Educational Purposes And Not For Investing | |
| 12Stocks.com: Top Performing Healthcare Sector Stocks | ||||||||||||||||||||||||||||||||||||||||||||||||
 The top performing Healthcare sector stocks year to date are
Now, more recently, over last week, the top performing Healthcare sector stocks on the move are


|
||||||||||||||||||||||||||||||||||||||||||||||||
| 12Stocks.com: Investing in Healthcare Sector using Exchange Traded Funds | |
|
The following table shows list of key exchange traded funds (ETF) that
help investors track Healthcare Index. For detailed view, check out our ETF Funds section of our website. Quick View: Move mouse or cursor over ETF symbol (ticker) to view short-term Technical chart and over ETF name to view long term chart. Click on ticker or stock name for detailed view. Click on to add stock symbol to your watchlist and to view watchlist. |
12Stocks.com List of ETFs that track Healthcare Index
| Ticker | ETF Name | Watchlist | Recent Price | Smart Investing & Trading Score | Change % | Week % | Year-to-date % |
| XLV | Health Care | | 141.40 | 57 | 0.40 | 0.4 | 3.68% |
| XBI | Biotech | | 90.58 | 20 | 0.67 | 0.67 | 1.44% |
| IBB | Biotechnology | | 133.00 | 57 | 0.03 | 0.03 | -2.1% |
| BBH | Biotech | | 163.68 | 80 | -0.29 | -0.29 | -0.99% |
| VHT | Health Care | | 259.16 | 57 | 0.44 | 0.44 | 3.37% |
| IYH | Healthcare | | 59.53 | 57 | 0.46 | 0.46 | 3.99% |
| IHF | Healthcare Providers | | 51.97 | 50 | 0.54 | 0.54 | -1.03% |
| IHI | Medical Devices | | 55.43 | 15 | -0.11 | -0.11 | 2.71% |
| BIB | Biotechnology | | 55.35 | 55 | -0.50 | -0.5 | -2.98% |
| BIS | Short Biotech | | 17.99 | 36 | 0.00 | 0 | -0.44% |
| XHE | Health Care Equipment | | 86.13 | 100 | 0.16 | 0.16 | 2.22% |
| CURE | Healthcare Bull 3X | | 107.73 | 22 | 0.79 | 0.79 | 5.89% |
| LABU | Biotech Bull 3X | | 110.61 | 15 | 1.49 | 1.49 | -9.31% |
| LABD | Biotech Bear 3X | | 8.14 | 58 | -1.69 | -1.69 | -16% |
| PSCH | SmallCap Health Care | | 42.42 | 82 | -0.02 | -0.02 | -0.89% |
| XHS | Health Care Services | | 89.29 | 57 | 0.86 | 0.86 | 0.38% |
| PTH | DWA Healthcare Momentum | | 42.05 | 64 | 0.00 | 0 | 7.43% |
| BTEC | Principal Healthcare Innovators | | 36.95 | 62 | -0.05 | -0.05 | 1.71% |
| RXL | Health Care | | 95.48 | 57 | -0.17 | -0.17 | 4.46% |
| RXD | Short Health Care | | 11.31 | 59 | 0.22 | 0.22 | -5.16% |
| 12Stocks.com: Charts, Trends, Fundamental Data and Performances of Healthcare Stocks | |
|
We now take in-depth look at all Healthcare stocks including charts, multi-period performances and overall trends (as measured by Smart Investing & Trading Score). One can sort Healthcare stocks (click link to choose) by Daily, Weekly and by Year-to-Date performances. Also, one can sort by size of the company or by market capitalization. |
| Select Your Default Chart Type: | |||||
| |||||
| Click on stock symbol or name for detailed view. Click on to add stock symbol to your watchlist and to view watchlist. Quick View: Move mouse or cursor over "Daily" to quickly view daily Technical stock chart and over "Weekly" to view weekly Technical stock chart. | |||||

 | AHCO AdaptHealth Corp. |
| Sector: Health Care | |
| SubSector: Medical Appliances & Equipment | |
| MarketCap: 1084.8 Millions | |
| Recent Price: 10.62 Smart Investing & Trading Score: 95 | |
| Day Percent Change: 3.51% Day Change: 0.36 | |
| Week Change: 3.51% Year-to-date Change: 45.7% | |
| AHCO Links: Profile News Message Board | |
| Charts:- Daily , Weekly | |
| Add AHCO to Watchlist: View: Get Complete AHCO Trend Analysis ➞ | |
 | SILK Silk Road Medical, Inc |
| Sector: Health Care | |
| SubSector: Medical Appliances & Equipment | |
| MarketCap: 881.78 Millions | |
| Recent Price: 20.91 Smart Investing & Trading Score: 95 | |
| Day Percent Change: 3.11% Day Change: 0.63 | |
| Week Change: 3.11% Year-to-date Change: 70.4% | |
| SILK Links: Profile News Message Board | |
| Charts:- Daily , Weekly | |
| Add SILK to Watchlist: View: Get Complete SILK Trend Analysis ➞ | |
 | AXON Axovant Sciences Ltd. |
| Sector: Health Care | |
| SubSector: Biotechnology | |
| MarketCap: 1492.04 Millions | |
| Recent Price: 327.93 Smart Investing & Trading Score: 95 | |
| Day Percent Change: 2.94% Day Change: 9.38 | |
| Week Change: 2.94% Year-to-date Change: 26.9% | |
| AXON Links: Profile News Message Board | |
| Charts:- Daily , Weekly | |
| Add AXON to Watchlist: View: Get Complete AXON Trend Analysis ➞ | |
 | PRGO Perrigo Company plc |
| Sector: Health Care | |
| SubSector: Drug Related Products | |
| MarketCap: 6493.93 Millions | |
| Recent Price: 33.43 Smart Investing & Trading Score: 95 | |
| Day Percent Change: 1.95% Day Change: 0.64 | |
| Week Change: 1.95% Year-to-date Change: 3.9% | |
| PRGO Links: Profile News Message Board | |
| Charts:- Daily , Weekly | |
| Add PRGO to Watchlist: View: Get Complete PRGO Trend Analysis ➞ | |
 | CDMO Avid Bioservices, Inc. |
| Sector: Health Care | |
| SubSector: Biotechnology | |
| MarketCap: 203.685 Millions | |
| Recent Price: 8.41 Smart Investing & Trading Score: 95 | |
| Day Percent Change: 1.94% Day Change: 0.16 | |
| Week Change: 1.94% Year-to-date Change: 29.4% | |
| CDMO Links: Profile News Message Board | |
| Charts:- Daily , Weekly | |
| Add CDMO to Watchlist: View: Get Complete CDMO Trend Analysis ➞ | |
 | BIIB Biogen Inc. |
| Sector: Health Care | |
| SubSector: Biotechnology | |
| MarketCap: 53102.6 Millions | |
| Recent Price: 221.41 Smart Investing & Trading Score: 95 | |
| Day Percent Change: 1.79% Day Change: 3.90 | |
| Week Change: 1.79% Year-to-date Change: -14.4% | |
| BIIB Links: Profile News Message Board | |
| Charts:- Daily , Weekly | |
| Add BIIB to Watchlist: View: Get Complete BIIB Trend Analysis ➞ | |
 | ROIV Roivant Sciences Ltd. |
| Sector: Health Care | |
| SubSector: Biotechnology | |
| MarketCap: 7780 Millions | |
| Recent Price: 11.59 Smart Investing & Trading Score: 95 | |
| Day Percent Change: 1.76% Day Change: 0.20 | |
| Week Change: 1.76% Year-to-date Change: 4.4% | |
| ROIV Links: Profile News Message Board | |
| Charts:- Daily , Weekly | |
| Add ROIV to Watchlist: View: Get Complete ROIV Trend Analysis ➞ | |
 | THC Tenet Healthcare Corporation |
| Sector: Health Care | |
| SubSector: Hospitals | |
| MarketCap: 1544.46 Millions | |
| Recent Price: 122.36 Smart Investing & Trading Score: 95 | |
| Day Percent Change: 1.73% Day Change: 2.08 | |
| Week Change: 1.73% Year-to-date Change: 61.9% | |
| THC Links: Profile News Message Board | |
| Charts:- Daily , Weekly | |
| Add THC to Watchlist: View: Get Complete THC Trend Analysis ➞ | |
 | ARGX argenx SE |
| Sector: Health Care | |
| SubSector: Biotechnology | |
| MarketCap: 5077.05 Millions | |
| Recent Price: 393.71 Smart Investing & Trading Score: 95 | |
| Day Percent Change: 1.42% Day Change: 5.51 | |
| Week Change: 1.42% Year-to-date Change: 3.5% | |
| ARGX Links: Profile News Message Board | |
| Charts:- Daily , Weekly | |
| Add ARGX to Watchlist: View: Get Complete ARGX Trend Analysis ➞ | |
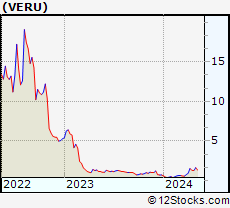 | VERU Veru Inc. |
| Sector: Health Care | |
| SubSector: Drug Manufacturers - Other | |
| MarketCap: 198.833 Millions | |
| Recent Price: 1.65 Smart Investing & Trading Score: 95 | |
| Day Percent Change: 1.23% Day Change: 0.02 | |
| Week Change: 1.23% Year-to-date Change: 129.2% | |
| VERU Links: Profile News Message Board | |
| Charts:- Daily , Weekly | |
| Add VERU to Watchlist: View: Get Complete VERU Trend Analysis ➞ | |
 | HAE Haemonetics Corporation |
| Sector: Health Care | |
| SubSector: Medical Instruments & Supplies | |
| MarketCap: 4500.7 Millions | |
| Recent Price: 95.38 Smart Investing & Trading Score: 95 | |
| Day Percent Change: 1.04% Day Change: 0.98 | |
| Week Change: 1.04% Year-to-date Change: 11.5% | |
| HAE Links: Profile News Message Board | |
| Charts:- Daily , Weekly | |
| Add HAE to Watchlist: View: Get Complete HAE Trend Analysis ➞ | |
 | SRPT Sarepta Therapeutics, Inc. |
| Sector: Health Care | |
| SubSector: Biotechnology | |
| MarketCap: 7388.05 Millions | |
| Recent Price: 135.03 Smart Investing & Trading Score: 95 | |
| Day Percent Change: 1.02% Day Change: 1.37 | |
| Week Change: 1.02% Year-to-date Change: 40.0% | |
| SRPT Links: Profile News Message Board | |
| Charts:- Daily , Weekly | |
| Add SRPT to Watchlist: View: Get Complete SRPT Trend Analysis ➞ | |
 | VRCA Verrica Pharmaceuticals Inc. |
| Sector: Health Care | |
| SubSector: Biotechnology | |
| MarketCap: 289.585 Millions | |
| Recent Price: 7.33 Smart Investing & Trading Score: 95 | |
| Day Percent Change: 0.96% Day Change: 0.07 | |
| Week Change: 0.96% Year-to-date Change: 0.1% | |
| VRCA Links: Profile News Message Board | |
| Charts:- Daily , Weekly | |
| Add VRCA to Watchlist: View: Get Complete VRCA Trend Analysis ➞ | |
 | OPK OPKO Health, Inc. |
| Sector: Health Care | |
| SubSector: Biotechnology | |
| MarketCap: 1116.05 Millions | |
| Recent Price: 1.31 Smart Investing & Trading Score: 95 | |
| Day Percent Change: 0.77% Day Change: 0.01 | |
| Week Change: 0.77% Year-to-date Change: -13.3% | |
| OPK Links: Profile News Message Board | |
| Charts:- Daily , Weekly | |
| Add OPK to Watchlist: View: Get Complete OPK Trend Analysis ➞ | |
 | PNTG The Pennant Group, Inc. |
| Sector: Health Care | |
| SubSector: Long-Term Care Facilities | |
| MarketCap: 451.786 Millions | |
| Recent Price: 21.57 Smart Investing & Trading Score: 95 | |
| Day Percent Change: 0.77% Day Change: 0.17 | |
| Week Change: 0.77% Year-to-date Change: 54.9% | |
| PNTG Links: Profile News Message Board | |
| Charts:- Daily , Weekly | |
| Add PNTG to Watchlist: View: Get Complete PNTG Trend Analysis ➞ | |
 | MRVI Maravai LifeSciences Holdings, Inc. |
| Sector: Health Care | |
| SubSector: Biotechnology | |
| MarketCap: 67887 Millions | |
| Recent Price: 9.02 Smart Investing & Trading Score: 95 | |
| Day Percent Change: 0.61% Day Change: 0.05 | |
| Week Change: 0.61% Year-to-date Change: 37.6% | |
| MRVI Links: Profile News Message Board | |
| Charts:- Daily , Weekly | |
| Add MRVI to Watchlist: View: Get Complete MRVI Trend Analysis ➞ | |
 | SGHT Sight Sciences, Inc. |
| Sector: Health Care | |
| SubSector: Medical Devices | |
| MarketCap: 381 Millions | |
| Recent Price: 5.80 Smart Investing & Trading Score: 95 | |
| Day Percent Change: 0.00% Day Change: 0.00 | |
| Week Change: 0% Year-to-date Change: 12.3% | |
| SGHT Links: Profile News Message Board | |
| Charts:- Daily , Weekly | |
| Add SGHT to Watchlist: View: Get Complete SGHT Trend Analysis ➞ | |
 | CUE Cue Biopharma, Inc. |
| Sector: Health Care | |
| SubSector: Biotechnology | |
| MarketCap: 352.785 Millions | |
| Recent Price: 2.06 Smart Investing & Trading Score: 95 | |
| Day Percent Change: -3.29% Day Change: -0.07 | |
| Week Change: -3.29% Year-to-date Change: -22.0% | |
| CUE Links: Profile News Message Board | |
| Charts:- Daily , Weekly | |
| Add CUE to Watchlist: View: Get Complete CUE Trend Analysis ➞ | |
 | LIVN LivaNova PLC |
| Sector: Health Care | |
| SubSector: Medical Appliances & Equipment | |
| MarketCap: 2060.5 Millions | |
| Recent Price: 62.52 Smart Investing & Trading Score: 95 | |
| Day Percent Change: -2.54% Day Change: -1.63 | |
| Week Change: -2.54% Year-to-date Change: 20.8% | |
| LIVN Links: Profile News Message Board | |
| Charts:- Daily , Weekly | |
| Add LIVN to Watchlist: View: Get Complete LIVN Trend Analysis ➞ | |
 | TLRY Tilray, Inc. |
| Sector: Health Care | |
| SubSector: Drug Manufacturers - Other | |
| MarketCap: 452.533 Millions | |
| Recent Price: 2.06 Smart Investing & Trading Score: 95 | |
| Day Percent Change: -2.14% Day Change: -0.04 | |
| Week Change: -2.14% Year-to-date Change: -10.7% | |
| TLRY Links: Profile News Message Board | |
| Charts:- Daily , Weekly | |
| Add TLRY to Watchlist: View: Get Complete TLRY Trend Analysis ➞ | |
 | AMRX Amneal Pharmaceuticals, Inc. |
| Sector: Health Care | |
| SubSector: Drug Related Products | |
| MarketCap: 1218.13 Millions | |
| Recent Price: 6.65 Smart Investing & Trading Score: 95 | |
| Day Percent Change: -1.63% Day Change: -0.11 | |
| Week Change: -1.63% Year-to-date Change: 9.6% | |
| AMRX Links: Profile News Message Board | |
| Charts:- Daily , Weekly | |
| Add AMRX to Watchlist: View: Get Complete AMRX Trend Analysis ➞ | |
 | ANGO AngioDynamics, Inc. |
| Sector: Health Care | |
| SubSector: Medical Instruments & Supplies | |
| MarketCap: 370.86 Millions | |
| Recent Price: 6.21 Smart Investing & Trading Score: 95 | |
| Day Percent Change: -0.96% Day Change: -0.06 | |
| Week Change: -0.96% Year-to-date Change: -20.8% | |
| ANGO Links: Profile News Message Board | |
| Charts:- Daily , Weekly | |
| Add ANGO to Watchlist: View: Get Complete ANGO Trend Analysis ➞ | |
 | MD MEDNAX, Inc. |
| Sector: Health Care | |
| SubSector: Specialized Health Services | |
| MarketCap: 913.656 Millions | |
| Recent Price: 9.28 Smart Investing & Trading Score: 95 | |
| Day Percent Change: -0.54% Day Change: -0.05 | |
| Week Change: -0.54% Year-to-date Change: -0.2% | |
| MD Links: Profile News Message Board | |
| Charts:- Daily , Weekly | |
| Add MD to Watchlist: View: Get Complete MD Trend Analysis ➞ | |
 | VALN Valneva SE |
| Sector: Health Care | |
| SubSector: Biotechnology | |
| MarketCap: 1010 Millions | |
| Recent Price: 7.71 Smart Investing & Trading Score: 93 | |
| Day Percent Change: 3.82% Day Change: 0.28 | |
| Week Change: 3.82% Year-to-date Change: -25.7% | |
| VALN Links: Profile News Message Board | |
| Charts:- Daily , Weekly | |
| Add VALN to Watchlist: View: Get Complete VALN Trend Analysis ➞ | |
 | AMGN Amgen Inc. |
| Sector: Health Care | |
| SubSector: Biotechnology | |
| MarketCap: 121030 Millions | |
| Recent Price: 299.41 Smart Investing & Trading Score: 93 | |
| Day Percent Change: -3.82% Day Change: -11.88 | |
| Week Change: -3.82% Year-to-date Change: 4.0% | |
| AMGN Links: Profile News Message Board | |
| Charts:- Daily , Weekly | |
| Add AMGN to Watchlist: View: Get Complete AMGN Trend Analysis ➞ | |
| For tabular summary view of above stock list: Summary View ➞ 0 - 25 , 25 - 50 , 50 - 75 , 75 - 100 , 100 - 125 , 125 - 150 , 150 - 175 , 175 - 200 , 200 - 225 , 225 - 250 , 250 - 275 , 275 - 300 , 300 - 325 , 325 - 350 , 350 - 375 , 375 - 400 , 400 - 425 , 425 - 450 , 450 - 475 , 475 - 500 , 500 - 525 , 525 - 550 , 550 - 575 , 575 - 600 , 600 - 625 , 625 - 650 , 650 - 675 , 675 - 700 , 700 - 725 | ||
| Click To Change The Sort Order: By Market Cap or Company Size Performance: Year-to-date, Week and Day | |
| Select Chart Type: | ||
|
Best Stocks Today 12Stocks.com |
© 2024 12Stocks.com Terms & Conditions Privacy Contact Us
All Information Provided Only For Education And Not To Be Used For Investing or Trading. See Terms & Conditions


One More Thing ... Get Best Stocks Delivered Daily!
Never Ever Miss A Move With Our Top Ten Stocks Lists
Find Best Stocks In Any Market - Bull or Bear Market
Take A Peek At Our Top Ten Stocks Lists: Daily, Weekly, Year-to-Date & Top Trends
Find Best Stocks In Any Market - Bull or Bear Market
Take A Peek At Our Top Ten Stocks Lists: Daily, Weekly, Year-to-Date & Top Trends
Healthcare Stocks With Best Up Trends [0-bearish to 100-bullish]: Outset [100], Lantern Pharma[100], PMV [100], Twist Bioscience[100], Mesoblast [100], Black Diamond[100], Co-Diagnostics [100], biote [100], Organon [100], iTeos [100], Alignment [100]
Best Healthcare Stocks Year-to-Date:
Pieris [5982.42%], Precision BioSciences[2804.11%], Avenue [2716.77%], Inovio [2235.29%], Assembly Biosciences[1483.95%], Agenus [1462.99%], Adverum Biotechnologies[1312.06%], Aurora Cannabis[1298.57%], NuCana [1228.6%], Affimed N.V[768.8%], Mesoblast [630.91%] Best Healthcare Stocks This Week:
P3 Health[25.16%], Outset [23%], Lineage Cell[22.64%], BioCryst [18.65%], Lantern Pharma[15.78%], OptiNose [13.86%], bluebird bio[12.8%], Akero [12.51%], Cutera [12.06%], Cerus [10.8%], Accuray [10.49%] Best Healthcare Stocks Daily:
P3 Health[25.16%], Outset [23.00%], Lineage Cell[22.64%], BioCryst [18.65%], Lantern Pharma[15.78%], OptiNose [13.86%], bluebird bio[12.80%], Akero [12.51%], Cutera [12.06%], Cerus [10.80%], Accuray [10.49%]