
 Login Sign Up


| |||||
 |  | ||||

| 12Stocks.com Market Intelligence |
Best Healthcare Stocks
 | "Discover best trending healthcare stocks with 12Stocks.com." |
| - Subu Vdaygiri, Founder, 12Stocks.com |
| In a hurry? Healthcare Stocks Lists: Performance Trends Table, Stock Charts
Sort Healthcare stocks: Daily, Weekly, Year-to-Date, Market Cap & Trends. Filter Healthcare stocks list by size:All Healthcare Large Mid-Range Small |
| 12Stocks.com Healthcare Stocks Performances & Trends Daily | |||||||||
|
|  The overall Smart Investing & Trading Score is 83 (0-bearish to 100-bullish) which puts Healthcare sector in short term bullish trend. The Smart Investing & Trading Score from previous trading session is 88 and hence a deterioration of trend.
| ||||||||
Here are the Smart Investing & Trading Scores of the most requested Healthcare stocks at 12Stocks.com (click stock name for detailed review):
|


| 12Stocks.com: Investing in Healthcare sector with Stocks | |
|
The following table helps investors and traders sort through current performance and trends (as measured by Smart Investing & Trading Score) of various
stocks in the Healthcare sector. Quick View: Move mouse or cursor over stock symbol (ticker) to view short-term Technical chart and over stock name to view long term chart. Click on  to add stock symbol to your watchlist and to add stock symbol to your watchlist and  to view watchlist. Click on any ticker or stock name for detailed market intelligence report for that stock. to view watchlist. Click on any ticker or stock name for detailed market intelligence report for that stock. |
12Stocks.com Performance of Stocks in Healthcare Sector
| Ticker | Stock Name | Watchlist | Category | Recent Price | Smart Investing & Trading Score | Change % | YTD Change% |
| PRQR | ProQR |   | Biotechnology | 1.92 | 10 | -2.04% | -3.03% |
| RLYB | Rallybio | | Biotechnology | 1.59 | 10 | -10.17% | -32.63% |
| BTMD | biote | | Medical Care Facilities | 5.64 | 10 | -1.91% | 13.71% |
| MLTX | MoonLake Immuno | | Biotechnology | 39.00 | 10 | -1.89% | -37.88% |
| SYBX | Synlogic | | Biotechnology | 1.62 | 10 | -1.82% | -56.74% |
| ANTX | AN2 | | Biotechnology | 2.23 | 10 | -1.76% | -89.11% |
| ZYME | Zymeworks | | Biotechnology | 8.98 | 10 | -1.54% | -13.57% |
| BMY | Bristol-Myers | | Pharmaceutical | 43.36 | 10 | -1.52% | -15.49% |
| MLYS | Mineralys | | Biotechnology | 12.81 | 10 | -1.46% | 46.90% |
| DERM | Dermira | | Biotechnology | 3.40 | 10 | -1.45% | -40.97% |
| MTEM | Molecular Templates | | Biotechnology | 1.43 | 10 | -1.38% | -61.66% |
| OABI | OmniAb | | Biotechnology | 4.39 | 10 | -1.35% | -27.56% |
| EYEN | Eyenovia | | Biotechnology | 0.74 | 10 | -1.32% | -64.59% |
| DCGO | DocGo | | Medical Care Facilities | 3.04 | 10 | -1.30% | -45.62% |
| TMCI | Treace | | Medical Devices | 4.93 | 10 | -1.30% | -61.26% |
| CCCC | C4 | | Biotechnology | 5.62 | 10 | -1.06% | -0.35% |
| PEN | Penumbra | | Instruments | 201.44 | 10 | -1.03% | -19.92% |
| ADAP | Adaptimmune | | Biotechnology | 1.10 | 10 | -0.90% | 38.71% |
| ORIC | ORIC | | Biotechnology | 9.08 | 10 | -0.87% | -1.52% |
| ABT | Abbott | | Equipment | 103.21 | 10 | -0.85% | -6.23% |
| CVM | CEL-SCI | | Biotechnology | 1.26 | 10 | -0.79% | -53.68% |
| SDGR | Schrodinger | | Health Information | 22.60 | 10 | -0.70% | -36.87% |
| CTLT | Catalent | | Pharmaceutical | 55.00 | 10 | -0.67% | 22.41% |
| BMRN | BioMarin | | Biotechnology | 77.05 | 10 | -0.66% | -20.09% |
| BAX | Baxter | | Instruments | 35.02 | 10 | -0.65% | -9.42% |
| For chart view version of above stock list: Chart View ➞ 0 - 25 , 25 - 50 , 50 - 75 , 75 - 100 , 100 - 125 , 125 - 150 , 150 - 175 , 175 - 200 , 200 - 225 , 225 - 250 , 250 - 275 , 275 - 300 , 300 - 325 , 325 - 350 , 350 - 375 , 375 - 400 , 400 - 425 , 425 - 450 , 450 - 475 , 475 - 500 , 500 - 525 , 525 - 550 , 550 - 575 , 575 - 600 , 600 - 625 , 625 - 650 , 650 - 675 , 675 - 700 , 700 - 725 | ||
 | Click To Change The Sort Order: By Market Cap or Company Size Performance: Year-to-date, Week and Day |  |
|
Get the most comprehensive stock market coverage daily at 12Stocks.com ➞ Best Stocks Today ➞ Best Stocks Weekly ➞ Best Stocks Year-to-Date ➞ Best Stocks Trends ➞  Best Stocks Today 12Stocks.com Best Nasdaq Stocks ➞ Best S&P 500 Stocks ➞ Best Tech Stocks ➞ Best Biotech Stocks ➞ |
| Detailed Overview of Healthcare Stocks |
| Healthcare Technical Overview, Leaders & Laggards, Top Healthcare ETF Funds & Detailed Healthcare Stocks List, Charts, Trends & More |
| Healthcare Sector: Technical Analysis, Trends & YTD Performance | |
| Healthcare sector is composed of stocks
from pharmaceutical, biotech, diagnostics labs, insurance providers
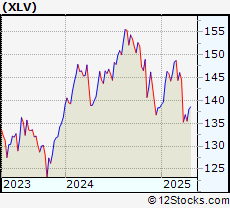
and healthcare services. Healthcare sector, as represented by XLV, an exchange-traded fund [ETF] that holds basket of Healthcare stocks (e.g, Merck, Amgen) is up by 7.05% and is currently underperforming the overall market by -3.64% year-to-date. Below is a quick view of Technical charts and trends: |
|
 XLV Weekly Chart |
|
| Long Term Trend: Very Good | |
| Medium Term Trend: Very Good | |
 XLV Daily Chart |
|
| Short Term Trend: Not Good | |
| Overall Trend Score: 83 | |
| YTD Performance: 7.05% | |
| **Trend Scores & Views Are Only For Educational Purposes And Not For Investing | |
| 12Stocks.com: Top Performing Healthcare Sector Stocks | ||||||||||||||||||||||||||||||||||||||||||||||||
 The top performing Healthcare sector stocks year to date are
Now, more recently, over last week, the top performing Healthcare sector stocks on the move are


|
||||||||||||||||||||||||||||||||||||||||||||||||
| 12Stocks.com: Investing in Healthcare Sector using Exchange Traded Funds | |
|
The following table shows list of key exchange traded funds (ETF) that
help investors track Healthcare Index. For detailed view, check out our ETF Funds section of our website. Quick View: Move mouse or cursor over ETF symbol (ticker) to view short-term Technical chart and over ETF name to view long term chart. Click on ticker or stock name for detailed view. Click on to add stock symbol to your watchlist and to view watchlist. |
12Stocks.com List of ETFs that track Healthcare Index
| Ticker | ETF Name | Watchlist | Recent Price | Smart Investing & Trading Score | Change % | Week % | Year-to-date % |
| XLV | Health Care | | 146.00 | 83 | -0.21 | -0.21 | 7.05% |
| XBI | Biotech | | 92.27 | 38 | 1.20 | 1.2 | 3.34% |
| IBB | Biotechnology | | 137.51 | 70 | 0.60 | 0.6 | 1.22% |
| BBH | Biotech | | 168.59 | 83 | 0.36 | 0.36 | 1.98% |
| VHT | Health Care | | 266.85 | 63 | -0.10 | -0.1 | 6.44% |
| IYH | Healthcare | | 61.24 | 63 | -0.16 | -0.16 | 6.97% |
| IHF | Healthcare Providers | | 53.54 | 76 | -0.69 | -0.69 | 1.96% |
| IHI | Medical Devices | | 56.45 | 38 | -0.42 | -0.42 | 4.6% |
| BIB | Biotechnology | | 57.89 | 82 | 1.63 | 1.63 | 1.47% |
| BIS | Short Biotech | | 17.33 | 18 | -1.48 | -1.48 | -4.1% |
| XHE | Health Care Equipment | | 87.50 | 69 | 0.06 | 0.06 | 3.85% |
| CURE | Healthcare Bull 3X | | 118.25 | 56 | -0.72 | -0.72 | 16.22% |
| LABU | Biotech Bull 3X | | 115.80 | 30 | 3.59 | 3.59 | -5.06% |
| LABD | Biotech Bear 3X | | 7.67 | 61 | -3.52 | -3.52 | -20.85% |
| PSCH | SmallCap Health Care | | 43.45 | 71 | 0.13 | 0.13 | 1.52% |
| XHS | Health Care Services | | 91.88 | 83 | 0.36 | 0.36 | 3.29% |
| PTH | DWA Healthcare Momentum | | 43.11 | 37 | 1.13 | 1.13 | 10.14% |
| BTEC | Principal Healthcare Innovators | | 36.94 | 22 | 1.26 | 1.26 | 1.68% |
| RXL | Health Care | | 102.89 | 70 | 0.13 | 0.13 | 12.57% |
| RXD | Short Health Care | | 10.57 | 25 | 0.07 | 0.07 | -11.36% |
| 12Stocks.com: Charts, Trends, Fundamental Data and Performances of Healthcare Stocks | |
|
We now take in-depth look at all Healthcare stocks including charts, multi-period performances and overall trends (as measured by Smart Investing & Trading Score). One can sort Healthcare stocks (click link to choose) by Daily, Weekly and by Year-to-Date performances. Also, one can sort by size of the company or by market capitalization. |
| Select Your Default Chart Type: | |||||
| |||||
| Click on stock symbol or name for detailed view. Click on to add stock symbol to your watchlist and to view watchlist. Quick View: Move mouse or cursor over "Daily" to quickly view daily Technical stock chart and over "Weekly" to view weekly Technical stock chart. | |||||

 | PRQR ProQR Therapeutics N.V. |
| Sector: Health Care | |
| SubSector: Biotechnology | |
| MarketCap: 324.385 Millions | |
| Recent Price: 1.92 Smart Investing & Trading Score: 10 | |
| Day Percent Change: -2.04% Day Change: -0.04 | |
| Week Change: -2.04% Year-to-date Change: -3.0% | |
| PRQR Links: Profile News Message Board | |
| Charts:- Daily , Weekly | |
| Add PRQR to Watchlist: View: Get Complete PRQR Trend Analysis ➞ | |
 | RLYB Rallybio Corporation |
| Sector: Health Care | |
| SubSector: Biotechnology | |
| MarketCap: 226 Millions | |
| Recent Price: 1.59 Smart Investing & Trading Score: 10 | |
| Day Percent Change: -10.17% Day Change: -0.18 | |
| Week Change: -10.17% Year-to-date Change: -32.6% | |
| RLYB Links: Profile News Message Board | |
| Charts:- Daily , Weekly | |
| Add RLYB to Watchlist: View: Get Complete RLYB Trend Analysis ➞ | |
 | BTMD biote Corp. |
| Sector: Health Care | |
| SubSector: Medical Care Facilities | |
| MarketCap: 468 Millions | |
| Recent Price: 5.64 Smart Investing & Trading Score: 10 | |
| Day Percent Change: -1.91% Day Change: -0.11 | |
| Week Change: -1.91% Year-to-date Change: 13.7% | |
| BTMD Links: Profile News Message Board | |
| Charts:- Daily , Weekly | |
| Add BTMD to Watchlist: View: Get Complete BTMD Trend Analysis ➞ | |
 | MLTX MoonLake Immunotherapeutics |
| Sector: Health Care | |
| SubSector: Biotechnology | |
| MarketCap: 2670 Millions | |
| Recent Price: 39.00 Smart Investing & Trading Score: 10 | |
| Day Percent Change: -1.89% Day Change: -0.75 | |
| Week Change: -1.89% Year-to-date Change: -37.9% | |
| MLTX Links: Profile News Message Board | |
| Charts:- Daily , Weekly | |
| Add MLTX to Watchlist: View: Get Complete MLTX Trend Analysis ➞ | |
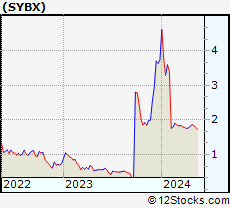 | SYBX Synlogic, Inc. |
| Sector: Health Care | |
| SubSector: Biotechnology | |
| MarketCap: 65.4785 Millions | |
| Recent Price: 1.62 Smart Investing & Trading Score: 10 | |
| Day Percent Change: -1.82% Day Change: -0.03 | |
| Week Change: -1.82% Year-to-date Change: -56.7% | |
| SYBX Links: Profile News Message Board | |
| Charts:- Daily , Weekly | |
| Add SYBX to Watchlist: View: Get Complete SYBX Trend Analysis ➞ | |
 | ANTX AN2 Therapeutics, Inc. |
| Sector: Health Care | |
| SubSector: Biotechnology | |
| MarketCap: 163 Millions | |
| Recent Price: 2.23 Smart Investing & Trading Score: 10 | |
| Day Percent Change: -1.76% Day Change: -0.04 | |
| Week Change: -1.76% Year-to-date Change: -89.1% | |
| ANTX Links: Profile News Message Board | |
| Charts:- Daily , Weekly | |
| Add ANTX to Watchlist: View: Get Complete ANTX Trend Analysis ➞ | |
 | ZYME Zymeworks Inc. |
| Sector: Health Care | |
| SubSector: Biotechnology | |
| MarketCap: 1373.55 Millions | |
| Recent Price: 8.98 Smart Investing & Trading Score: 10 | |
| Day Percent Change: -1.54% Day Change: -0.14 | |
| Week Change: -1.54% Year-to-date Change: -13.6% | |
| ZYME Links: Profile News Message Board | |
| Charts:- Daily , Weekly | |
| Add ZYME to Watchlist: View: Get Complete ZYME Trend Analysis ➞ | |
 | BMY Bristol-Myers Squibb Company |
| Sector: Health Care | |
| SubSector: Drug Manufacturers - Major | |
| MarketCap: 117052 Millions | |
| Recent Price: 43.36 Smart Investing & Trading Score: 10 | |
| Day Percent Change: -1.52% Day Change: -0.67 | |
| Week Change: -1.52% Year-to-date Change: -15.5% | |
| BMY Links: Profile News Message Board | |
| Charts:- Daily , Weekly | |
| Add BMY to Watchlist: View: Get Complete BMY Trend Analysis ➞ | |
 | MLYS Mineralys Therapeutics, Inc. |
| Sector: Health Care | |
| SubSector: Biotechnology | |
| MarketCap: 719 Millions | |
| Recent Price: 12.81 Smart Investing & Trading Score: 10 | |
| Day Percent Change: -1.46% Day Change: -0.19 | |
| Week Change: -1.46% Year-to-date Change: 46.9% | |
| MLYS Links: Profile News Message Board | |
| Charts:- Daily , Weekly | |
| Add MLYS to Watchlist: View: Get Complete MLYS Trend Analysis ➞ | |
 | DERM Dermira, Inc. |
| Sector: Health Care | |
| SubSector: Biotechnology | |
| MarketCap: 1312.25 Millions | |
| Recent Price: 3.40 Smart Investing & Trading Score: 10 | |
| Day Percent Change: -1.45% Day Change: -0.05 | |
| Week Change: -1.45% Year-to-date Change: -41.0% | |
| DERM Links: Profile News Message Board | |
| Charts:- Daily , Weekly | |
| Add DERM to Watchlist: View: Get Complete DERM Trend Analysis ➞ | |
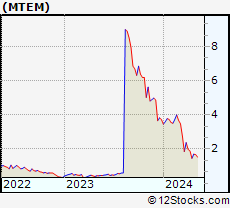 | MTEM Molecular Templates, Inc. |
| Sector: Health Care | |
| SubSector: Biotechnology | |
| MarketCap: 662.785 Millions | |
| Recent Price: 1.43 Smart Investing & Trading Score: 10 | |
| Day Percent Change: -1.38% Day Change: -0.02 | |
| Week Change: -1.38% Year-to-date Change: -61.7% | |
| MTEM Links: Profile News Message Board | |
| Charts:- Daily , Weekly | |
| Add MTEM to Watchlist: View: Get Complete MTEM Trend Analysis ➞ | |
 | OABI OmniAb, Inc. |
| Sector: Health Care | |
| SubSector: Biotechnology | |
| MarketCap: 570 Millions | |
| Recent Price: 4.39 Smart Investing & Trading Score: 10 | |
| Day Percent Change: -1.35% Day Change: -0.06 | |
| Week Change: -1.35% Year-to-date Change: -27.6% | |
| OABI Links: Profile News Message Board | |
| Charts:- Daily , Weekly | |
| Add OABI to Watchlist: View: Get Complete OABI Trend Analysis ➞ | |
 | EYEN Eyenovia, Inc. |
| Sector: Health Care | |
| SubSector: Biotechnology | |
| MarketCap: 52.2785 Millions | |
| Recent Price: 0.74 Smart Investing & Trading Score: 10 | |
| Day Percent Change: -1.32% Day Change: -0.01 | |
| Week Change: -1.32% Year-to-date Change: -64.6% | |
| EYEN Links: Profile News Message Board | |
| Charts:- Daily , Weekly | |
| Add EYEN to Watchlist: View: Get Complete EYEN Trend Analysis ➞ | |
 | DCGO DocGo Inc. |
| Sector: Health Care | |
| SubSector: Medical Care Facilities | |
| MarketCap: 972 Millions | |
| Recent Price: 3.04 Smart Investing & Trading Score: 10 | |
| Day Percent Change: -1.30% Day Change: -0.04 | |
| Week Change: -1.3% Year-to-date Change: -45.6% | |
| DCGO Links: Profile News Message Board | |
| Charts:- Daily , Weekly | |
| Add DCGO to Watchlist: View: Get Complete DCGO Trend Analysis ➞ | |
 | TMCI Treace Medical Concepts, Inc. |
| Sector: Health Care | |
| SubSector: Medical Devices | |
| MarketCap: 1550 Millions | |
| Recent Price: 4.93 Smart Investing & Trading Score: 10 | |
| Day Percent Change: -1.30% Day Change: -0.07 | |
| Week Change: -1.3% Year-to-date Change: -61.3% | |
| TMCI Links: Profile News Message Board | |
| Charts:- Daily , Weekly | |
| Add TMCI to Watchlist: View: Get Complete TMCI Trend Analysis ➞ | |
 | CCCC C4 Therapeutics, Inc. |
| Sector: Health Care | |
| SubSector: Biotechnology | |
| MarketCap: 12587 Millions | |
| Recent Price: 5.62 Smart Investing & Trading Score: 10 | |
| Day Percent Change: -1.06% Day Change: -0.06 | |
| Week Change: -1.06% Year-to-date Change: -0.4% | |
| CCCC Links: Profile News Message Board | |
| Charts:- Daily , Weekly | |
| Add CCCC to Watchlist: View: Get Complete CCCC Trend Analysis ➞ | |
 | PEN Penumbra, Inc. |
| Sector: Health Care | |
| SubSector: Medical Instruments & Supplies | |
| MarketCap: 4854.1 Millions | |
| Recent Price: 201.44 Smart Investing & Trading Score: 10 | |
| Day Percent Change: -1.03% Day Change: -2.09 | |
| Week Change: -1.03% Year-to-date Change: -19.9% | |
| PEN Links: Profile News Message Board | |
| Charts:- Daily , Weekly | |
| Add PEN to Watchlist: View: Get Complete PEN Trend Analysis ➞ | |
 | ADAP Adaptimmune Therapeutics plc |
| Sector: Health Care | |
| SubSector: Biotechnology | |
| MarketCap: 380.985 Millions | |
| Recent Price: 1.10 Smart Investing & Trading Score: 10 | |
| Day Percent Change: -0.90% Day Change: -0.01 | |
| Week Change: -0.9% Year-to-date Change: 38.7% | |
| ADAP Links: Profile News Message Board | |
| Charts:- Daily , Weekly | |
| Add ADAP to Watchlist: View: Get Complete ADAP Trend Analysis ➞ | |
 | ORIC ORIC Pharmaceuticals, Inc. |
| Sector: Health Care | |
| SubSector: Biotechnology | |
| MarketCap: 12787 Millions | |
| Recent Price: 9.08 Smart Investing & Trading Score: 10 | |
| Day Percent Change: -0.87% Day Change: -0.08 | |
| Week Change: -0.87% Year-to-date Change: -1.5% | |
| ORIC Links: Profile News Message Board | |
| Charts:- Daily , Weekly | |
| Add ORIC to Watchlist: View: Get Complete ORIC Trend Analysis ➞ | |
 | ABT Abbott Laboratories |
| Sector: Health Care | |
| SubSector: Medical Appliances & Equipment | |
| MarketCap: 125288 Millions | |
| Recent Price: 103.21 Smart Investing & Trading Score: 10 | |
| Day Percent Change: -0.85% Day Change: -0.88 | |
| Week Change: -0.85% Year-to-date Change: -6.2% | |
| ABT Links: Profile News Message Board | |
| Charts:- Daily , Weekly | |
| Add ABT to Watchlist: View: Get Complete ABT Trend Analysis ➞ | |
 | CVM CEL-SCI Corporation |
| Sector: Health Care | |
| SubSector: Biotechnology | |
| MarketCap: 483.885 Millions | |
| Recent Price: 1.26 Smart Investing & Trading Score: 10 | |
| Day Percent Change: -0.79% Day Change: -0.01 | |
| Week Change: -0.79% Year-to-date Change: -53.7% | |
| CVM Links: Profile News Message Board | |
| Charts:- Daily , Weekly | |
| Add CVM to Watchlist: View: Get Complete CVM Trend Analysis ➞ | |
 | SDGR Schrodinger, Inc. |
| Sector: Health Care | |
| SubSector: Health Information Services | |
| MarketCap: 47287 Millions | |
| Recent Price: 22.60 Smart Investing & Trading Score: 10 | |
| Day Percent Change: -0.70% Day Change: -0.16 | |
| Week Change: -0.7% Year-to-date Change: -36.9% | |
| SDGR Links: Profile News Message Board | |
| Charts:- Daily , Weekly | |
| Add SDGR to Watchlist: View: Get Complete SDGR Trend Analysis ➞ | |
 | CTLT Catalent, Inc. |
| Sector: Health Care | |
| SubSector: Drugs - Generic | |
| MarketCap: 6351.95 Millions | |
| Recent Price: 55.00 Smart Investing & Trading Score: 10 | |
| Day Percent Change: -0.67% Day Change: -0.37 | |
| Week Change: -0.67% Year-to-date Change: 22.4% | |
| CTLT Links: Profile News Message Board | |
| Charts:- Daily , Weekly | |
| Add CTLT to Watchlist: View: Get Complete CTLT Trend Analysis ➞ | |
 | BMRN BioMarin Pharmaceutical Inc. |
| Sector: Health Care | |
| SubSector: Biotechnology | |
| MarketCap: 14887.5 Millions | |
| Recent Price: 77.05 Smart Investing & Trading Score: 10 | |
| Day Percent Change: -0.66% Day Change: -0.51 | |
| Week Change: -0.66% Year-to-date Change: -20.1% | |
| BMRN Links: Profile News Message Board | |
| Charts:- Daily , Weekly | |
| Add BMRN to Watchlist: View: Get Complete BMRN Trend Analysis ➞ | |
 | BAX Baxter International Inc. |
| Sector: Health Care | |
| SubSector: Medical Instruments & Supplies | |
| MarketCap: 39955.8 Millions | |
| Recent Price: 35.02 Smart Investing & Trading Score: 10 | |
| Day Percent Change: -0.65% Day Change: -0.23 | |
| Week Change: -0.65% Year-to-date Change: -9.4% | |
| BAX Links: Profile News Message Board | |
| Charts:- Daily , Weekly | |
| Add BAX to Watchlist: View: Get Complete BAX Trend Analysis ➞ | |
| For tabular summary view of above stock list: Summary View ➞ 0 - 25 , 25 - 50 , 50 - 75 , 75 - 100 , 100 - 125 , 125 - 150 , 150 - 175 , 175 - 200 , 200 - 225 , 225 - 250 , 250 - 275 , 275 - 300 , 300 - 325 , 325 - 350 , 350 - 375 , 375 - 400 , 400 - 425 , 425 - 450 , 450 - 475 , 475 - 500 , 500 - 525 , 525 - 550 , 550 - 575 , 575 - 600 , 600 - 625 , 625 - 650 , 650 - 675 , 675 - 700 , 700 - 725 | ||
| Click To Change The Sort Order: By Market Cap or Company Size Performance: Year-to-date, Week and Day | |
| Select Chart Type: | ||
|
Best Stocks Today 12Stocks.com |
© 2024 12Stocks.com Terms & Conditions Privacy Contact Us
All Information Provided Only For Education And Not To Be Used For Investing or Trading. See Terms & Conditions


One More Thing ... Get Best Stocks Delivered Daily!
Never Ever Miss A Move With Our Top Ten Stocks Lists
Find Best Stocks In Any Market - Bull or Bear Market
Take A Peek At Our Top Ten Stocks Lists: Daily, Weekly, Year-to-Date & Top Trends
Find Best Stocks In Any Market - Bull or Bear Market
Take A Peek At Our Top Ten Stocks Lists: Daily, Weekly, Year-to-Date & Top Trends
Healthcare Stocks With Best Up Trends [0-bearish to 100-bullish]: PTC [100], Stoke [100], Humacyte [100], NovoCure [100], Reneo [100], Vericel [100], Corbus [100], Genfit SA[100], Heron [100], Moderna [100], Innate Pharma[100]
Best Healthcare Stocks Year-to-Date:
Pieris [6081.32%], Precision BioSciences[3417.81%], Avenue [2266.46%], Inovio [2078.43%], Assembly Biosciences[1724.17%], Aurora Cannabis[1453.97%], Agenus [1192.43%], NuCana [1117.04%], Adverum Biotechnologies[995.91%], Affimed N.V[725.6%], Burning Rock[706.3%] Best Healthcare Stocks This Week:
Scilex Holding[34.44%], Nobilis Health[29.64%], Dyne [27.82%], BioTelemetry [21.98%], PTC [21.23%], Concord [19.24%], Genelux [17.81%], Sutro Biopharma[16.71%], iBio [16.53%], InnovAge Holding[16.49%], Atara Bio[16.39%] Best Healthcare Stocks Daily:
Scilex Holding[34.44%], Nobilis Health[29.64%], Dyne [27.82%], BioTelemetry [21.98%], PTC [21.23%], Concord [19.24%], Genelux [17.81%], Sutro Biopharma[16.71%], iBio [16.53%], InnovAge Holding[16.49%], Atara Bio[16.39%]