
 Login Sign Up


| |||||
 |  | ||||

| 12Stocks.com Market Intelligence |
Best Healthcare Stocks
 | "Discover best trending healthcare stocks with 12Stocks.com." |
| - Subu Vdaygiri, Founder, 12Stocks.com |
| In a hurry? Healthcare Stocks Lists: Performance Trends Table, Stock Charts
Sort Healthcare stocks: Daily, Weekly, Year-to-Date, Market Cap & Trends. Filter Healthcare stocks list by size:All Healthcare Large Mid-Range Small |
| 12Stocks.com Healthcare Stocks Performances & Trends Daily | |||||||||
|
|  The overall Smart Investing & Trading Score is 57 (0-bearish to 100-bullish) which puts Healthcare sector in short term neutral trend. The Smart Investing & Trading Score from previous trading session is 60 and a deterioration of trend continues.
| ||||||||
Here are the Smart Investing & Trading Scores of the most requested Healthcare stocks at 12Stocks.com (click stock name for detailed review):
|


| 12Stocks.com: Investing in Healthcare sector with Stocks | |
|
The following table helps investors and traders sort through current performance and trends (as measured by Smart Investing & Trading Score) of various
stocks in the Healthcare sector. Quick View: Move mouse or cursor over stock symbol (ticker) to view short-term Technical chart and over stock name to view long term chart. Click on  to add stock symbol to your watchlist and to add stock symbol to your watchlist and  to view watchlist. Click on any ticker or stock name for detailed market intelligence report for that stock. to view watchlist. Click on any ticker or stock name for detailed market intelligence report for that stock. |
12Stocks.com Performance of Stocks in Healthcare Sector
| Ticker | Stock Name | Watchlist | Category | Recent Price | Smart Investing & Trading Score | Change % | YTD Change% |
| QSI | Quantum-Si |   | Biotechnology | 1.94 | 100 | 9.92% | -3.48% |
| JANX | Janux | | Biotechnology | 62.62 | 100 | 7.88% | 482.74% |
| SIGA | SIGA Technologies | | Biotechnology | 10.15 | 100 | 7.52% | 81.25% |
| VRCA | Verrica | | Biotechnology | 7.26 | 100 | 7.40% | -0.82% |
| OGN | Organon | | Drug Manufacturers - General | 19.61 | 100 | 7.33% | 36.79% |
| SILK | Silk Road | | Equipment | 20.28 | 100 | 7.30% | 65.28% |
| GMAB | Genmab A/S | | Biotechnology | 29.72 | 100 | 7.22% | -6.66% |
| CSTL | Castle Biosciences | | Laboratories | 24.33 | 100 | 6.52% | 12.74% |
| BDTX | Black Diamond | | Biotechnology | 6.96 | 100 | 5.61% | 147.69% |
| PMVP | PMV | | Biotechnology | 1.98 | 100 | 5.61% | -36.29% |
| IMMP | Immutep | | Biotechnology | 2.82 | 100 | 4.83% | 17.50% |
| WVE | Wave Life | | Biotechnology | 6.14 | 100 | 4.42% | 21.58% |
| BKD | Brookdale Senior | | Long-Term | 7.49 | 100 | 4.17% | 28.69% |
| ELMD | Electromed | | Equipment | 18.50 | 100 | 3.87% | 69.57% |
| ATEC | Alphatec | | Instruments | 13.65 | 100 | 3.33% | -9.66% |
| VYGR | Voyager | | Biotechnology | 8.81 | 100 | 3.28% | 4.38% |
| KIDS | OrthoPediatrics | | Equipment | 32.83 | 100 | 3.21% | 0.98% |
| RXST | RxSight | | Medical Devices | 60.57 | 100 | 3.10% | 51.01% |
| TWST | Twist Bioscience | | Laboratories | 41.21 | 100 | 28.74% | 11.80% |
| JYNT | Joint | | Hospitals | 16.12 | 100 | 25.35% | 67.74% |
| TNDM | Tandem Diabetes | | Instruments | 44.72 | 100 | 22.32% | 51.18% |
| ALHC | Alignment | | Healthcare Plans | 6.50 | 100 | 21.97% | -26.61% |
| PTN | Palatin Technologies | | Biotechnology | 2.11 | 100 | 2.93% | -46.98% |
| MESO | Mesoblast | | Biotechnology | 7.50 | 100 | 2.88% | 581.82% |
| TMDX | TransMedics | | Equipment | 127.99 | 100 | 2.85% | 62.16% |
| For chart view version of above stock list: Chart View ➞ 0 - 25 , 25 - 50 , 50 - 75 , 75 - 100 , 100 - 125 , 125 - 150 , 150 - 175 , 175 - 200 , 200 - 225 , 225 - 250 , 250 - 275 , 275 - 300 , 300 - 325 , 325 - 350 , 350 - 375 , 375 - 400 , 400 - 425 , 425 - 450 , 450 - 475 , 475 - 500 , 500 - 525 , 525 - 550 , 550 - 575 , 575 - 600 , 600 - 625 , 625 - 650 , 650 - 675 , 675 - 700 , 700 - 725 | ||
 | Click To Change The Sort Order: By Market Cap or Company Size Performance: Year-to-date, Week and Day |  |
|
Get the most comprehensive stock market coverage daily at 12Stocks.com ➞ Best Stocks Today ➞ Best Stocks Weekly ➞ Best Stocks Year-to-Date ➞ Best Stocks Trends ➞  Best Stocks Today 12Stocks.com Best Nasdaq Stocks ➞ Best S&P 500 Stocks ➞ Best Tech Stocks ➞ Best Biotech Stocks ➞ |
| Detailed Overview of Healthcare Stocks |
| Healthcare Technical Overview, Leaders & Laggards, Top Healthcare ETF Funds & Detailed Healthcare Stocks List, Charts, Trends & More |
| Healthcare Sector: Technical Analysis, Trends & YTD Performance | |
| Healthcare sector is composed of stocks
from pharmaceutical, biotech, diagnostics labs, insurance providers
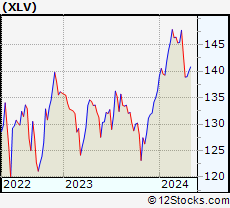
and healthcare services. Healthcare sector, as represented by XLV, an exchange-traded fund [ETF] that holds basket of Healthcare stocks (e.g, Merck, Amgen) is up by 3.26% and is currently underperforming the overall market by -3.62% year-to-date. Below is a quick view of Technical charts and trends: |
|
 XLV Weekly Chart |
|
| Long Term Trend: Not Good | |
| Medium Term Trend: Good | |
 XLV Daily Chart |
|
| Short Term Trend: Very Good | |
| Overall Trend Score: 57 | |
| YTD Performance: 3.26% | |
| **Trend Scores & Views Are Only For Educational Purposes And Not For Investing | |
| 12Stocks.com: Top Performing Healthcare Sector Stocks | ||||||||||||||||||||||||||||||||||||||||||||||||
 The top performing Healthcare sector stocks year to date are
Now, more recently, over last week, the top performing Healthcare sector stocks on the move are


|
||||||||||||||||||||||||||||||||||||||||||||||||
| 12Stocks.com: Investing in Healthcare Sector using Exchange Traded Funds | |
|
The following table shows list of key exchange traded funds (ETF) that
help investors track Healthcare Index. For detailed view, check out our ETF Funds section of our website. Quick View: Move mouse or cursor over ETF symbol (ticker) to view short-term Technical chart and over ETF name to view long term chart. Click on ticker or stock name for detailed view. Click on to add stock symbol to your watchlist and to view watchlist. |
12Stocks.com List of ETFs that track Healthcare Index
| Ticker | ETF Name | Watchlist | Recent Price | Smart Investing & Trading Score | Change % | Week % | Year-to-date % |
| XLV | Health Care | | 140.83 | 57 | 0.25 | 0.62 | 3.26% |
| XBI | Biotech | | 89.98 | 69 | 1.86 | 7.77 | 0.77% |
| IBB | Biotechnology | | 132.96 | 69 | 1.77 | 5.12 | -2.13% |
| BBH | Biotech | | 164.15 | 100 | 2.27 | 5.46 | -0.7% |
| VHT | Health Care | | 258.02 | 57 | 0.34 | 1.06 | 2.92% |
| IYH | Healthcare | | 59.26 | 57 | 0.24 | 1.11 | 3.51% |
| IHF | Healthcare Providers | | 51.69 | 30 | 0.08 | -0.44 | -1.56% |
| IHI | Medical Devices | | 55.49 | 32 | 0.60 | -0.07 | 2.82% |
| BIB | Biotechnology | | 55.63 | 74 | 3.40 | 12.02 | -2.49% |
| BIS | Short Biotech | | 17.99 | 36 | -3.59 | -11.03 | -0.44% |
| XHE | Health Care Equipment | | 85.99 | 87 | 1.30 | 4.32 | 2.05% |
| CURE | Healthcare Bull 3X | | 106.89 | 57 | 1.02 | 1.51 | 5.06% |
| LABU | Biotech Bull 3X | | 108.99 | 64 | 5.83 | 24.55 | -10.64% |
| LABD | Biotech Bear 3X | | 8.28 | 36 | -5.48 | -21.29 | -14.55% |
| PSCH | SmallCap Health Care | | 42.43 | 82 | 0.90 | 4.25 | -0.86% |
| XHS | Health Care Services | | 88.53 | 39 | 0.44 | 0.75 | -0.47% |
| PTH | DWA Healthcare Momentum | | 42.05 | 62 | 0.74 | 5.41 | 7.43% |
| BTEC | Principal Healthcare Innovators | | 36.97 | 69 | 2.74 | 7.94 | 1.76% |
| RXL | Health Care | | 95.65 | 57 | 0.46 | 0.87 | 4.64% |
| RXD | Short Health Care | | 11.29 | 49 | -0.49 | -1.44 | -5.37% |
| 12Stocks.com: Charts, Trends, Fundamental Data and Performances of Healthcare Stocks | |
|
We now take in-depth look at all Healthcare stocks including charts, multi-period performances and overall trends (as measured by Smart Investing & Trading Score). One can sort Healthcare stocks (click link to choose) by Daily, Weekly and by Year-to-Date performances. Also, one can sort by size of the company or by market capitalization. |
| Select Your Default Chart Type: | |||||
| |||||
| Click on stock symbol or name for detailed view. Click on to add stock symbol to your watchlist and to view watchlist. Quick View: Move mouse or cursor over "Daily" to quickly view daily Technical stock chart and over "Weekly" to view weekly Technical stock chart. | |||||

 | QSI Quantum-Si incorporated |
| Sector: Health Care | |
| SubSector: Biotechnology | |
| MarketCap: 256 Millions | |
| Recent Price: 1.94 Smart Investing & Trading Score: 100 | |
| Day Percent Change: 9.92% Day Change: 0.18 | |
| Week Change: 17.58% Year-to-date Change: -3.5% | |
| QSI Links: Profile News Message Board | |
| Charts:- Daily , Weekly | |
| Add QSI to Watchlist: View: Get Complete QSI Trend Analysis ➞ | |
 | JANX Janux Therapeutics, Inc. |
| Sector: Health Care | |
| SubSector: Biotechnology | |
| MarketCap: 496 Millions | |
| Recent Price: 62.62 Smart Investing & Trading Score: 100 | |
| Day Percent Change: 7.88% Day Change: 4.58 | |
| Week Change: 31.95% Year-to-date Change: 482.7% | |
| JANX Links: Profile News Message Board | |
| Charts:- Daily , Weekly | |
| Add JANX to Watchlist: View: Get Complete JANX Trend Analysis ➞ | |
 | SIGA SIGA Technologies, Inc. |
| Sector: Health Care | |
| SubSector: Biotechnology | |
| MarketCap: 424.285 Millions | |
| Recent Price: 10.15 Smart Investing & Trading Score: 100 | |
| Day Percent Change: 7.52% Day Change: 0.71 | |
| Week Change: 15.47% Year-to-date Change: 81.3% | |
| SIGA Links: Profile News Message Board | |
| Charts:- Daily , Weekly | |
| Add SIGA to Watchlist: View: Get Complete SIGA Trend Analysis ➞ | |
 | VRCA Verrica Pharmaceuticals Inc. |
| Sector: Health Care | |
| SubSector: Biotechnology | |
| MarketCap: 289.585 Millions | |
| Recent Price: 7.26 Smart Investing & Trading Score: 100 | |
| Day Percent Change: 7.40% Day Change: 0.50 | |
| Week Change: 5.68% Year-to-date Change: -0.8% | |
| VRCA Links: Profile News Message Board | |
| Charts:- Daily , Weekly | |
| Add VRCA to Watchlist: View: Get Complete VRCA Trend Analysis ➞ | |
 | OGN Organon & Co. |
| Sector: Health Care | |
| SubSector: Drug Manufacturers - General | |
| MarketCap: 5230 Millions | |
| Recent Price: 19.61 Smart Investing & Trading Score: 100 | |
| Day Percent Change: 7.33% Day Change: 1.34 | |
| Week Change: 5.74% Year-to-date Change: 36.8% | |
| OGN Links: Profile News Message Board | |
| Charts:- Daily , Weekly | |
| Add OGN to Watchlist: View: Get Complete OGN Trend Analysis ➞ | |
 | SILK Silk Road Medical, Inc |
| Sector: Health Care | |
| SubSector: Medical Appliances & Equipment | |
| MarketCap: 881.78 Millions | |
| Recent Price: 20.28 Smart Investing & Trading Score: 100 | |
| Day Percent Change: 7.30% Day Change: 1.38 | |
| Week Change: 13.93% Year-to-date Change: 65.3% | |
| SILK Links: Profile News Message Board | |
| Charts:- Daily , Weekly | |
| Add SILK to Watchlist: View: Get Complete SILK Trend Analysis ➞ | |
 | GMAB Genmab A/S |
| Sector: Health Care | |
| SubSector: Biotechnology | |
| MarketCap: 12482.3 Millions | |
| Recent Price: 29.72 Smart Investing & Trading Score: 100 | |
| Day Percent Change: 7.22% Day Change: 2.00 | |
| Week Change: 5.58% Year-to-date Change: -6.7% | |
| GMAB Links: Profile News Message Board | |
| Charts:- Daily , Weekly | |
| Add GMAB to Watchlist: View: Get Complete GMAB Trend Analysis ➞ | |
 | CSTL Castle Biosciences, Inc. |
| Sector: Health Care | |
| SubSector: Medical Laboratories & Research | |
| MarketCap: 545 Millions | |
| Recent Price: 24.33 Smart Investing & Trading Score: 100 | |
| Day Percent Change: 6.52% Day Change: 1.49 | |
| Week Change: 19.62% Year-to-date Change: 12.7% | |
| CSTL Links: Profile News Message Board | |
| Charts:- Daily , Weekly | |
| Add CSTL to Watchlist: View: Get Complete CSTL Trend Analysis ➞ | |
 | BDTX Black Diamond Therapeutics, Inc. |
| Sector: Health Care | |
| SubSector: Biotechnology | |
| MarketCap: 12587 Millions | |
| Recent Price: 6.96 Smart Investing & Trading Score: 100 | |
| Day Percent Change: 5.61% Day Change: 0.37 | |
| Week Change: 18.17% Year-to-date Change: 147.7% | |
| BDTX Links: Profile News Message Board | |
| Charts:- Daily , Weekly | |
| Add BDTX to Watchlist: View: Get Complete BDTX Trend Analysis ➞ | |
 | PMVP PMV Pharmaceuticals, Inc. |
| Sector: Health Care | |
| SubSector: Biotechnology | |
| MarketCap: 20187 Millions | |
| Recent Price: 1.98 Smart Investing & Trading Score: 100 | |
| Day Percent Change: 5.61% Day Change: 0.10 | |
| Week Change: 12.86% Year-to-date Change: -36.3% | |
| PMVP Links: Profile News Message Board | |
| Charts:- Daily , Weekly | |
| Add PMVP to Watchlist: View: Get Complete PMVP Trend Analysis ➞ | |
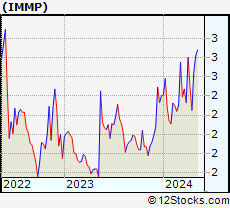 | IMMP Immutep Limited |
| Sector: Health Care | |
| SubSector: Biotechnology | |
| MarketCap: 71.5785 Millions | |
| Recent Price: 2.82 Smart Investing & Trading Score: 100 | |
| Day Percent Change: 4.83% Day Change: 0.13 | |
| Week Change: 6.42% Year-to-date Change: 17.5% | |
| IMMP Links: Profile News Message Board | |
| Charts:- Daily , Weekly | |
| Add IMMP to Watchlist: View: Get Complete IMMP Trend Analysis ➞ | |
 | WVE Wave Life Sciences Ltd. |
| Sector: Health Care | |
| SubSector: Biotechnology | |
| MarketCap: 452.785 Millions | |
| Recent Price: 6.14 Smart Investing & Trading Score: 100 | |
| Day Percent Change: 4.42% Day Change: 0.26 | |
| Week Change: 31.76% Year-to-date Change: 21.6% | |
| WVE Links: Profile News Message Board | |
| Charts:- Daily , Weekly | |
| Add WVE to Watchlist: View: Get Complete WVE Trend Analysis ➞ | |
 | BKD Brookdale Senior Living Inc. |
| Sector: Health Care | |
| SubSector: Long-Term Care Facilities | |
| MarketCap: 420.686 Millions | |
| Recent Price: 7.49 Smart Investing & Trading Score: 100 | |
| Day Percent Change: 4.17% Day Change: 0.30 | |
| Week Change: 7.61% Year-to-date Change: 28.7% | |
| BKD Links: Profile News Message Board | |
| Charts:- Daily , Weekly | |
| Add BKD to Watchlist: View: Get Complete BKD Trend Analysis ➞ | |
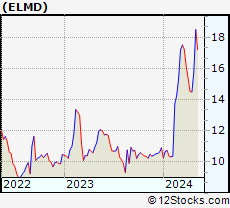 | ELMD Electromed, Inc. |
| Sector: Health Care | |
| SubSector: Medical Appliances & Equipment | |
| MarketCap: 75.708 Millions | |
| Recent Price: 18.50 Smart Investing & Trading Score: 100 | |
| Day Percent Change: 3.87% Day Change: 0.69 | |
| Week Change: 17.31% Year-to-date Change: 69.6% | |
| ELMD Links: Profile News Message Board | |
| Charts:- Daily , Weekly | |
| Add ELMD to Watchlist: View: Get Complete ELMD Trend Analysis ➞ | |
 | ATEC Alphatec Holdings, Inc. |
| Sector: Health Care | |
| SubSector: Medical Instruments & Supplies | |
| MarketCap: 181.16 Millions | |
| Recent Price: 13.65 Smart Investing & Trading Score: 100 | |
| Day Percent Change: 3.33% Day Change: 0.44 | |
| Week Change: 9.73% Year-to-date Change: -9.7% | |
| ATEC Links: Profile News Message Board | |
| Charts:- Daily , Weekly | |
| Add ATEC to Watchlist: View: Get Complete ATEC Trend Analysis ➞ | |
 | VYGR Voyager Therapeutics, Inc. |
| Sector: Health Care | |
| SubSector: Biotechnology | |
| MarketCap: 321.085 Millions | |
| Recent Price: 8.81 Smart Investing & Trading Score: 100 | |
| Day Percent Change: 3.28% Day Change: 0.28 | |
| Week Change: 15.62% Year-to-date Change: 4.4% | |
| VYGR Links: Profile News Message Board | |
| Charts:- Daily , Weekly | |
| Add VYGR to Watchlist: View: Get Complete VYGR Trend Analysis ➞ | |
 | KIDS OrthoPediatrics Corp. |
| Sector: Health Care | |
| SubSector: Medical Appliances & Equipment | |
| MarketCap: 742.28 Millions | |
| Recent Price: 32.83 Smart Investing & Trading Score: 100 | |
| Day Percent Change: 3.21% Day Change: 1.02 | |
| Week Change: 8.49% Year-to-date Change: 1.0% | |
| KIDS Links: Profile News Message Board | |
| Charts:- Daily , Weekly | |
| Add KIDS to Watchlist: View: Get Complete KIDS Trend Analysis ➞ | |
 | RXST RxSight, Inc. |
| Sector: Health Care | |
| SubSector: Medical Devices | |
| MarketCap: 893 Millions | |
| Recent Price: 60.57 Smart Investing & Trading Score: 100 | |
| Day Percent Change: 3.10% Day Change: 1.82 | |
| Week Change: 14.82% Year-to-date Change: 51.0% | |
| RXST Links: Profile News Message Board | |
| Charts:- Daily , Weekly | |
| Add RXST to Watchlist: View: Get Complete RXST Trend Analysis ➞ | |
 | TWST Twist Bioscience Corporation |
| Sector: Health Care | |
| SubSector: Medical Laboratories & Research | |
| MarketCap: 1065 Millions | |
| Recent Price: 41.21 Smart Investing & Trading Score: 100 | |
| Day Percent Change: 28.74% Day Change: 9.20 | |
| Week Change: 30.66% Year-to-date Change: 11.8% | |
| TWST Links: Profile News Message Board | |
| Charts:- Daily , Weekly | |
| Add TWST to Watchlist: View: Get Complete TWST Trend Analysis ➞ | |
 | JYNT The Joint Corp. |
| Sector: Health Care | |
| SubSector: Hospitals | |
| MarketCap: 125.146 Millions | |
| Recent Price: 16.12 Smart Investing & Trading Score: 100 | |
| Day Percent Change: 25.35% Day Change: 3.26 | |
| Week Change: 31.81% Year-to-date Change: 67.7% | |
| JYNT Links: Profile News Message Board | |
| Charts:- Daily , Weekly | |
| Add JYNT to Watchlist: View: Get Complete JYNT Trend Analysis ➞ | |
 | TNDM Tandem Diabetes Care, Inc. |
| Sector: Health Care | |
| SubSector: Medical Instruments & Supplies | |
| MarketCap: 3359.1 Millions | |
| Recent Price: 44.72 Smart Investing & Trading Score: 100 | |
| Day Percent Change: 22.32% Day Change: 8.16 | |
| Week Change: 26.9% Year-to-date Change: 51.2% | |
| TNDM Links: Profile News Message Board | |
| Charts:- Daily , Weekly | |
| Add TNDM to Watchlist: View: Get Complete TNDM Trend Analysis ➞ | |
 | ALHC Alignment Healthcare, Inc. |
| Sector: Health Care | |
| SubSector: Healthcare Plans | |
| MarketCap: 1100 Millions | |
| Recent Price: 6.50 Smart Investing & Trading Score: 100 | |
| Day Percent Change: 21.97% Day Change: 1.17 | |
| Week Change: 24.31% Year-to-date Change: -26.6% | |
| ALHC Links: Profile News Message Board | |
| Charts:- Daily , Weekly | |
| Add ALHC to Watchlist: View: Get Complete ALHC Trend Analysis ➞ | |
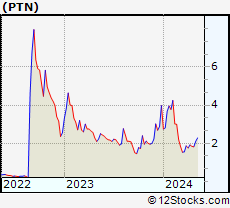 | PTN Palatin Technologies, Inc. |
| Sector: Health Care | |
| SubSector: Biotechnology | |
| MarketCap: 109.285 Millions | |
| Recent Price: 2.11 Smart Investing & Trading Score: 100 | |
| Day Percent Change: 2.93% Day Change: 0.06 | |
| Week Change: 15.93% Year-to-date Change: -47.0% | |
| PTN Links: Profile News Message Board | |
| Charts:- Daily , Weekly | |
| Add PTN to Watchlist: View: Get Complete PTN Trend Analysis ➞ | |
 | MESO Mesoblast Limited |
| Sector: Health Care | |
| SubSector: Biotechnology | |
| MarketCap: 471.385 Millions | |
| Recent Price: 7.50 Smart Investing & Trading Score: 100 | |
| Day Percent Change: 2.88% Day Change: 0.21 | |
| Week Change: 20.19% Year-to-date Change: 581.8% | |
| MESO Links: Profile News Message Board | |
| Charts:- Daily , Weekly | |
| Add MESO to Watchlist: View: Get Complete MESO Trend Analysis ➞ | |
 | TMDX TransMedics Group, Inc. |
| Sector: Health Care | |
| SubSector: Medical Appliances & Equipment | |
| MarketCap: 331.68 Millions | |
| Recent Price: 127.99 Smart Investing & Trading Score: 100 | |
| Day Percent Change: 2.85% Day Change: 3.55 | |
| Week Change: 39% Year-to-date Change: 62.2% | |
| TMDX Links: Profile News Message Board | |
| Charts:- Daily , Weekly | |
| Add TMDX to Watchlist: View: Get Complete TMDX Trend Analysis ➞ | |
| For tabular summary view of above stock list: Summary View ➞ 0 - 25 , 25 - 50 , 50 - 75 , 75 - 100 , 100 - 125 , 125 - 150 , 150 - 175 , 175 - 200 , 200 - 225 , 225 - 250 , 250 - 275 , 275 - 300 , 300 - 325 , 325 - 350 , 350 - 375 , 375 - 400 , 400 - 425 , 425 - 450 , 450 - 475 , 475 - 500 , 500 - 525 , 525 - 550 , 550 - 575 , 575 - 600 , 600 - 625 , 625 - 650 , 650 - 675 , 675 - 700 , 700 - 725 | ||
| Click To Change The Sort Order: By Market Cap or Company Size Performance: Year-to-date, Week and Day | |
| Select Chart Type: | ||
|
Best Stocks Today 12Stocks.com |
© 2024 12Stocks.com Terms & Conditions Privacy Contact Us
All Information Provided Only For Education And Not To Be Used For Investing or Trading. See Terms & Conditions


One More Thing ... Get Best Stocks Delivered Daily!
Never Ever Miss A Move With Our Top Ten Stocks Lists
Find Best Stocks In Any Market - Bull or Bear Market
Take A Peek At Our Top Ten Stocks Lists: Daily, Weekly, Year-to-Date & Top Trends
Find Best Stocks In Any Market - Bull or Bear Market
Take A Peek At Our Top Ten Stocks Lists: Daily, Weekly, Year-to-Date & Top Trends
Healthcare Stocks With Best Up Trends [0-bearish to 100-bullish]: Twist Bioscience[100], Joint [100], Tandem Diabetes[100], Alignment [100], Emergent Bio[100], DURECT [100], Amgen [100], LeMaitre Vascular[100], Select [100], Quantum-Si [100], Janux [100]
Best Healthcare Stocks Year-to-Date:
Pieris [5987.91%], Avenue [2868.94%], Precision BioSciences[2782.19%], Inovio [2272.55%], Assembly Biosciences[1503.46%], Agenus [1478.69%], Aurora Cannabis[1315.37%], Adverum Biotechnologies[1285.49%], NuCana [1252.27%], Affimed N.V[767.2%], GeneDx [625.37%] Best Healthcare Stocks This Week:
CytomX [178.62%], Emergent Bio[102.6%], GeneDx [78.07%], Deciphera [73.24%], Cue Biopharma[56.04%], Codexis [47.37%], Abeona [41.1%], Seres [40.61%], TransMedics [39%], Ardelyx [35.83%], Poseida [35.21%] Best Healthcare Stocks Daily:
Twist Bioscience[28.74%], Ardelyx [28.42%], Joint [25.35%], Tandem Diabetes[22.32%], Alignment [21.97%], Emergent Bio[17.88%], Butterfly Network[17.42%], Codexis [17.37%], Vaxxinity [17.27%], DURECT [17.17%], OptiNose [15.09%]