
 Login Sign Up


| |||||
 |  | ||||

| 12Stocks.com Market Intelligence |
Best Healthcare Stocks
 | "Discover best trending healthcare stocks with 12Stocks.com." |
| - Subu Vdaygiri, Founder, 12Stocks.com |
| In a hurry? Healthcare Stocks Lists: Performance Trends Table, Stock Charts
Sort Healthcare stocks: Daily, Weekly, Year-to-Date, Market Cap & Trends. Filter Healthcare stocks list by size:All Healthcare Large Mid-Range Small |
| 12Stocks.com Healthcare Stocks Performances & Trends Daily | |||||||||
|
|  The overall Smart Investing & Trading Score is 57 (0-bearish to 100-bullish) which puts Healthcare sector in short term neutral trend. The Smart Investing & Trading Score from previous trading session is 60 and a deterioration of trend continues.
| ||||||||
Here are the Smart Investing & Trading Scores of the most requested Healthcare stocks at 12Stocks.com (click stock name for detailed review):
|


| 12Stocks.com: Investing in Healthcare sector with Stocks | |
|
The following table helps investors and traders sort through current performance and trends (as measured by Smart Investing & Trading Score) of various
stocks in the Healthcare sector. Quick View: Move mouse or cursor over stock symbol (ticker) to view short-term Technical chart and over stock name to view long term chart. Click on  to add stock symbol to your watchlist and to add stock symbol to your watchlist and  to view watchlist. Click on any ticker or stock name for detailed market intelligence report for that stock. to view watchlist. Click on any ticker or stock name for detailed market intelligence report for that stock. |
12Stocks.com Performance of Stocks in Healthcare Sector
| Ticker | Stock Name | Watchlist | Category | Recent Price | Smart Investing & Trading Score | Change % | YTD Change% |
| AGTI | Agiliti |   | Health Information | 10.09 | 68 | 0.05% | 28.05% |
| XXII | 22nd Century | | Biotechnology | 1.67 | 68 | -0.60% | 796.89% |
| EHAB | Enhabit | | Medical Care Facilities | 10.14 | 68 | 0.10% | -2.03% |
| TEVA | Teva | | Pharmaceutical | 13.98 | 68 | -0.71% | 33.91% |
| INNV | InnovAge Holding | | Medical Care Facilities | 4.05 | 67 | 7.14% | -28.95% |
| OBIO | Orchestra BioMed | | Biotechnology | 4.95 | 67 | -6.60% | -45.66% |
| USNA | USANA Health | | Pharmaceutical | 45.55 | 67 | -3.29% | -15.02% |
| JNJ | Johnson & Johnson | | Pharmaceutical | 149.27 | 67 | -0.43% | -4.77% |
| HUM | Humana | | Insurance | 320.54 | 67 | -0.14% | -29.98% |
| INCY | yte | | Biotechnology | 53.76 | 67 | 1.26% | -14.38% |
| RLAY | Relay | | Biotechnology | 7.02 | 67 | -0.85% | -36.18% |
| EHC | Encompass Health | | Hospitals | 83.21 | 66 | -0.25% | 24.72% |
| TALK | Talkspace | | Health Information | 3.19 | 65 | 2.25% | 25.39% |
| OCS | Oculis Holding | | Biotechnology | 12.92 | 65 | 0.86% | 16.39% |
| ATRI | Atrion | | Instruments | 414.95 | 65 | 0.00% | 9.55% |
| RXRX | Recursion | | Biotechnology | 9.10 | 64 | 8.59% | -7.05% |
| SMMT | Summit | | Biotechnology | 4.39 | 64 | 8.13% | 68.20% |
| BDSX | Biodesix | | Diagnostics & Research | 1.40 | 64 | 6.87% | -26.32% |
| CASI | CASI | | Biotechnology | 2.85 | 64 | 6.34% | -60.20% |
| LAKE | Lakeland Industries | | Instruments | 17.81 | 64 | 5.45% | -3.94% |
| AURA | Aura Biosciences | | Biotechnology | 7.88 | 64 | 4.93% | -10.96% |
| TERN | Terns | | Biotechnology | 5.39 | 64 | 4.86% | -18.46% |
| MLTX | MoonLake Immuno | | Biotechnology | 45.06 | 64 | 4.23% | -28.23% |
| PSTX | Poseida | | Biotechnology | 2.88 | 64 | 3.23% | -14.41% |
| GPCR | Structure | | Biotechnology | 39.91 | 64 | 2.78% | 4.82% |
| For chart view version of above stock list: Chart View ➞ 0 - 25 , 25 - 50 , 50 - 75 , 75 - 100 , 100 - 125 , 125 - 150 , 150 - 175 , 175 - 200 , 200 - 225 , 225 - 250 , 250 - 275 , 275 - 300 , 300 - 325 , 325 - 350 , 350 - 375 , 375 - 400 , 400 - 425 , 425 - 450 , 450 - 475 , 475 - 500 , 500 - 525 , 525 - 550 , 550 - 575 , 575 - 600 , 600 - 625 , 625 - 650 , 650 - 675 , 675 - 700 , 700 - 725 | ||
 | Click To Change The Sort Order: By Market Cap or Company Size Performance: Year-to-date, Week and Day |  |
|
Get the most comprehensive stock market coverage daily at 12Stocks.com ➞ Best Stocks Today ➞ Best Stocks Weekly ➞ Best Stocks Year-to-Date ➞ Best Stocks Trends ➞  Best Stocks Today 12Stocks.com Best Nasdaq Stocks ➞ Best S&P 500 Stocks ➞ Best Tech Stocks ➞ Best Biotech Stocks ➞ |
| Detailed Overview of Healthcare Stocks |
| Healthcare Technical Overview, Leaders & Laggards, Top Healthcare ETF Funds & Detailed Healthcare Stocks List, Charts, Trends & More |
| Healthcare Sector: Technical Analysis, Trends & YTD Performance | |
| Healthcare sector is composed of stocks
from pharmaceutical, biotech, diagnostics labs, insurance providers
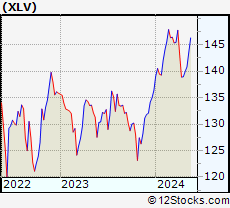
and healthcare services. Healthcare sector, as represented by XLV, an exchange-traded fund [ETF] that holds basket of Healthcare stocks (e.g, Merck, Amgen) is up by 3.26% and is currently underperforming the overall market by -3.62% year-to-date. Below is a quick view of Technical charts and trends: |
|
 XLV Weekly Chart |
|
| Long Term Trend: Not Good | |
| Medium Term Trend: Good | |
 XLV Daily Chart |
|
| Short Term Trend: Very Good | |
| Overall Trend Score: 57 | |
| YTD Performance: 3.26% | |
| **Trend Scores & Views Are Only For Educational Purposes And Not For Investing | |
| 12Stocks.com: Top Performing Healthcare Sector Stocks | ||||||||||||||||||||||||||||||||||||||||||||||||
 The top performing Healthcare sector stocks year to date are
Now, more recently, over last week, the top performing Healthcare sector stocks on the move are


|
||||||||||||||||||||||||||||||||||||||||||||||||
| 12Stocks.com: Investing in Healthcare Sector using Exchange Traded Funds | |
|
The following table shows list of key exchange traded funds (ETF) that
help investors track Healthcare Index. For detailed view, check out our ETF Funds section of our website. Quick View: Move mouse or cursor over ETF symbol (ticker) to view short-term Technical chart and over ETF name to view long term chart. Click on ticker or stock name for detailed view. Click on to add stock symbol to your watchlist and to view watchlist. |
12Stocks.com List of ETFs that track Healthcare Index
| Ticker | ETF Name | Watchlist | Recent Price | Smart Investing & Trading Score | Change % | Week % | Year-to-date % |
| XLV | Health Care | | 140.83 | 57 | 0.25 | 0.62 | 3.26% |
| XBI | Biotech | | 89.98 | 69 | 1.86 | 7.77 | 0.77% |
| IBB | Biotechnology | | 132.96 | 69 | 1.77 | 5.12 | -2.13% |
| BBH | Biotech | | 164.15 | 100 | 2.27 | 5.46 | -0.7% |
| VHT | Health Care | | 258.02 | 57 | 0.34 | 1.06 | 2.92% |
| IYH | Healthcare | | 59.26 | 57 | 0.24 | 1.11 | 3.51% |
| IHF | Healthcare Providers | | 51.69 | 30 | 0.08 | -0.44 | -1.56% |
| IHI | Medical Devices | | 55.49 | 32 | 0.60 | -0.07 | 2.82% |
| BIB | Biotechnology | | 55.63 | 74 | 3.40 | 12.02 | -2.49% |
| BIS | Short Biotech | | 17.99 | 36 | -3.59 | -11.03 | -0.44% |
| XHE | Health Care Equipment | | 85.99 | 87 | 1.30 | 4.32 | 2.05% |
| CURE | Healthcare Bull 3X | | 106.89 | 57 | 1.02 | 1.51 | 5.06% |
| LABU | Biotech Bull 3X | | 108.99 | 64 | 5.83 | 24.55 | -10.64% |
| LABD | Biotech Bear 3X | | 8.28 | 36 | -5.48 | -21.29 | -14.55% |
| PSCH | SmallCap Health Care | | 42.43 | 82 | 0.90 | 4.25 | -0.86% |
| XHS | Health Care Services | | 88.53 | 39 | 0.44 | 0.75 | -0.47% |
| PTH | DWA Healthcare Momentum | | 42.05 | 62 | 0.74 | 5.41 | 7.43% |
| BTEC | Principal Healthcare Innovators | | 36.97 | 69 | 2.74 | 7.94 | 1.76% |
| RXL | Health Care | | 95.65 | 57 | 0.46 | 0.87 | 4.64% |
| RXD | Short Health Care | | 11.29 | 49 | -0.49 | -1.44 | -5.37% |
| 12Stocks.com: Charts, Trends, Fundamental Data and Performances of Healthcare Stocks | |
|
We now take in-depth look at all Healthcare stocks including charts, multi-period performances and overall trends (as measured by Smart Investing & Trading Score). One can sort Healthcare stocks (click link to choose) by Daily, Weekly and by Year-to-Date performances. Also, one can sort by size of the company or by market capitalization. |
| Select Your Default Chart Type: | |||||
| |||||
| Click on stock symbol or name for detailed view. Click on to add stock symbol to your watchlist and to view watchlist. Quick View: Move mouse or cursor over "Daily" to quickly view daily Technical stock chart and over "Weekly" to view weekly Technical stock chart. | |||||

 | AGTI Agiliti, Inc. |
| Sector: Health Care | |
| SubSector: Health Information Services | |
| MarketCap: 2270 Millions | |
| Recent Price: 10.09 Smart Investing & Trading Score: 68 | |
| Day Percent Change: 0.05% Day Change: 0.00 | |
| Week Change: 0.4% Year-to-date Change: 28.1% | |
| AGTI Links: Profile News Message Board | |
| Charts:- Daily , Weekly | |
| Add AGTI to Watchlist: View: Get Complete AGTI Trend Analysis ➞ | |
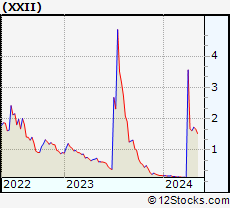 | XXII 22nd Century Group, Inc. |
| Sector: Health Care | |
| SubSector: Biotechnology | |
| MarketCap: 94.7785 Millions | |
| Recent Price: 1.67 Smart Investing & Trading Score: 68 | |
| Day Percent Change: -0.60% Day Change: -0.01 | |
| Week Change: -3.47% Year-to-date Change: 796.9% | |
| XXII Links: Profile News Message Board | |
| Charts:- Daily , Weekly | |
| Add XXII to Watchlist: View: Get Complete XXII Trend Analysis ➞ | |
 | EHAB Enhabit, Inc. |
| Sector: Health Care | |
| SubSector: Medical Care Facilities | |
| MarketCap: 569 Millions | |
| Recent Price: 10.14 Smart Investing & Trading Score: 68 | |
| Day Percent Change: 0.10% Day Change: 0.01 | |
| Week Change: 1.1% Year-to-date Change: -2.0% | |
| EHAB Links: Profile News Message Board | |
| Charts:- Daily , Weekly | |
| Add EHAB to Watchlist: View: Get Complete EHAB Trend Analysis ➞ | |
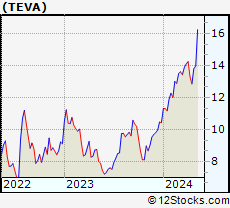 | TEVA Teva Pharmaceutical Industries Limited |
| Sector: Health Care | |
| SubSector: Drug Manufacturers - Other | |
| MarketCap: 9369.93 Millions | |
| Recent Price: 13.98 Smart Investing & Trading Score: 68 | |
| Day Percent Change: -0.71% Day Change: -0.10 | |
| Week Change: 1.23% Year-to-date Change: 33.9% | |
| TEVA Links: Profile News Message Board | |
| Charts:- Daily , Weekly | |
| Add TEVA to Watchlist: View: Get Complete TEVA Trend Analysis ➞ | |
 | INNV InnovAge Holding Corp. |
| Sector: Health Care | |
| SubSector: Medical Care Facilities | |
| MarketCap: 1010 Millions | |
| Recent Price: 4.05 Smart Investing & Trading Score: 67 | |
| Day Percent Change: 7.14% Day Change: 0.27 | |
| Week Change: 6.58% Year-to-date Change: -29.0% | |
| INNV Links: Profile News Message Board | |
| Charts:- Daily , Weekly | |
| Add INNV to Watchlist: View: Get Complete INNV Trend Analysis ➞ | |
 | OBIO Orchestra BioMed Holdings, Inc. |
| Sector: Health Care | |
| SubSector: Biotechnology | |
| MarketCap: 271 Millions | |
| Recent Price: 4.95 Smart Investing & Trading Score: 67 | |
| Day Percent Change: -6.60% Day Change: -0.35 | |
| Week Change: 12.76% Year-to-date Change: -45.7% | |
| OBIO Links: Profile News Message Board | |
| Charts:- Daily , Weekly | |
| Add OBIO to Watchlist: View: Get Complete OBIO Trend Analysis ➞ | |
 | USNA USANA Health Sciences, Inc. |
| Sector: Health Care | |
| SubSector: Drug Related Products | |
| MarketCap: 1185.13 Millions | |
| Recent Price: 45.55 Smart Investing & Trading Score: 67 | |
| Day Percent Change: -3.29% Day Change: -1.55 | |
| Week Change: 4.78% Year-to-date Change: -15.0% | |
| USNA Links: Profile News Message Board | |
| Charts:- Daily , Weekly | |
| Add USNA to Watchlist: View: Get Complete USNA Trend Analysis ➞ | |
 | JNJ Johnson & Johnson |
| Sector: Health Care | |
| SubSector: Drug Manufacturers - Major | |
| MarketCap: 331972 Millions | |
| Recent Price: 149.27 Smart Investing & Trading Score: 67 | |
| Day Percent Change: -0.43% Day Change: -0.65 | |
| Week Change: 2.14% Year-to-date Change: -4.8% | |
| JNJ Links: Profile News Message Board | |
| Charts:- Daily , Weekly | |
| Add JNJ to Watchlist: View: Get Complete JNJ Trend Analysis ➞ | |
 | HUM Humana Inc. |
| Sector: Health Care | |
| SubSector: Health Care Plans | |
| MarketCap: 34125.6 Millions | |
| Recent Price: 320.54 Smart Investing & Trading Score: 67 | |
| Day Percent Change: -0.14% Day Change: -0.44 | |
| Week Change: 4.79% Year-to-date Change: -30.0% | |
| HUM Links: Profile News Message Board | |
| Charts:- Daily , Weekly | |
| Add HUM to Watchlist: View: Get Complete HUM Trend Analysis ➞ | |
 | INCY Incyte Corporation |
| Sector: Health Care | |
| SubSector: Biotechnology | |
| MarketCap: 15343.2 Millions | |
| Recent Price: 53.76 Smart Investing & Trading Score: 67 | |
| Day Percent Change: 1.26% Day Change: 0.67 | |
| Week Change: 4.02% Year-to-date Change: -14.4% | |
| INCY Links: Profile News Message Board | |
| Charts:- Daily , Weekly | |
| Add INCY to Watchlist: View: Get Complete INCY Trend Analysis ➞ | |
 | RLAY Relay Therapeutics, Inc. |
| Sector: Health Care | |
| SubSector: Biotechnology | |
| MarketCap: 45887 Millions | |
| Recent Price: 7.02 Smart Investing & Trading Score: 67 | |
| Day Percent Change: -0.85% Day Change: -0.06 | |
| Week Change: 10.2% Year-to-date Change: -36.2% | |
| RLAY Links: Profile News Message Board | |
| Charts:- Daily , Weekly | |
| Add RLAY to Watchlist: View: Get Complete RLAY Trend Analysis ➞ | |
 | EHC Encompass Health Corporation |
| Sector: Health Care | |
| SubSector: Hospitals | |
| MarketCap: 5384.06 Millions | |
| Recent Price: 83.21 Smart Investing & Trading Score: 66 | |
| Day Percent Change: -0.25% Day Change: -0.21 | |
| Week Change: 0.9% Year-to-date Change: 24.7% | |
| EHC Links: Profile News Message Board | |
| Charts:- Daily , Weekly | |
| Add EHC to Watchlist: View: Get Complete EHC Trend Analysis ➞ | |
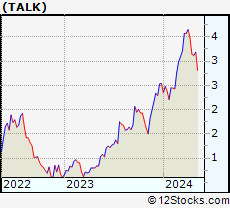 | TALK Talkspace, Inc. |
| Sector: Health Care | |
| SubSector: Health Information Services | |
| MarketCap: 209 Millions | |
| Recent Price: 3.19 Smart Investing & Trading Score: 65 | |
| Day Percent Change: 2.25% Day Change: 0.07 | |
| Week Change: 2.08% Year-to-date Change: 25.4% | |
| TALK Links: Profile News Message Board | |
| Charts:- Daily , Weekly | |
| Add TALK to Watchlist: View: Get Complete TALK Trend Analysis ➞ | |
 | OCS Oculis Holding AG |
| Sector: Health Care | |
| SubSector: Biotechnology | |
| MarketCap: 460 Millions | |
| Recent Price: 12.92 Smart Investing & Trading Score: 65 | |
| Day Percent Change: 0.86% Day Change: 0.11 | |
| Week Change: 7.49% Year-to-date Change: 16.4% | |
| OCS Links: Profile News Message Board | |
| Charts:- Daily , Weekly | |
| Add OCS to Watchlist: View: Get Complete OCS Trend Analysis ➞ | |
 | ATRI Atrion Corporation |
| Sector: Health Care | |
| SubSector: Medical Instruments & Supplies | |
| MarketCap: 1234.6 Millions | |
| Recent Price: 414.95 Smart Investing & Trading Score: 65 | |
| Day Percent Change: 0.00% Day Change: 0.00 | |
| Week Change: 5.05% Year-to-date Change: 9.6% | |
| ATRI Links: Profile News Message Board | |
| Charts:- Daily , Weekly | |
| Add ATRI to Watchlist: View: Get Complete ATRI Trend Analysis ➞ | |
 | RXRX Recursion Pharmaceuticals, Inc. |
| Sector: Health Care | |
| SubSector: Biotechnology | |
| MarketCap: 1470 Millions | |
| Recent Price: 9.10 Smart Investing & Trading Score: 64 | |
| Day Percent Change: 8.59% Day Change: 0.72 | |
| Week Change: 12.14% Year-to-date Change: -7.1% | |
| RXRX Links: Profile News Message Board | |
| Charts:- Daily , Weekly | |
| Add RXRX to Watchlist: View: Get Complete RXRX Trend Analysis ➞ | |
 | SMMT Summit Therapeutics plc |
| Sector: Health Care | |
| SubSector: Biotechnology | |
| MarketCap: 156.985 Millions | |
| Recent Price: 4.39 Smart Investing & Trading Score: 64 | |
| Day Percent Change: 8.13% Day Change: 0.33 | |
| Week Change: 13.73% Year-to-date Change: 68.2% | |
| SMMT Links: Profile News Message Board | |
| Charts:- Daily , Weekly | |
| Add SMMT to Watchlist: View: Get Complete SMMT Trend Analysis ➞ | |
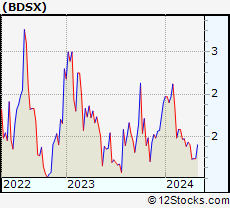 | BDSX Biodesix, Inc. |
| Sector: Health Care | |
| SubSector: Diagnostics & Research | |
| MarketCap: 41487 Millions | |
| Recent Price: 1.40 Smart Investing & Trading Score: 64 | |
| Day Percent Change: 6.87% Day Change: 0.09 | |
| Week Change: 13.36% Year-to-date Change: -26.3% | |
| BDSX Links: Profile News Message Board | |
| Charts:- Daily , Weekly | |
| Add BDSX to Watchlist: View: Get Complete BDSX Trend Analysis ➞ | |
 | CASI CASI Pharmaceuticals, Inc. |
| Sector: Health Care | |
| SubSector: Biotechnology | |
| MarketCap: 210.085 Millions | |
| Recent Price: 2.85 Smart Investing & Trading Score: 64 | |
| Day Percent Change: 6.34% Day Change: 0.17 | |
| Week Change: 17.77% Year-to-date Change: -60.2% | |
| CASI Links: Profile News Message Board | |
| Charts:- Daily , Weekly | |
| Add CASI to Watchlist: View: Get Complete CASI Trend Analysis ➞ | |
 | LAKE Lakeland Industries, Inc. |
| Sector: Health Care | |
| SubSector: Medical Instruments & Supplies | |
| MarketCap: 138.16 Millions | |
| Recent Price: 17.81 Smart Investing & Trading Score: 64 | |
| Day Percent Change: 5.45% Day Change: 0.92 | |
| Week Change: 3.85% Year-to-date Change: -3.9% | |
| LAKE Links: Profile News Message Board | |
| Charts:- Daily , Weekly | |
| Add LAKE to Watchlist: View: Get Complete LAKE Trend Analysis ➞ | |
 | AURA Aura Biosciences, Inc. |
| Sector: Health Care | |
| SubSector: Biotechnology | |
| MarketCap: 469 Millions | |
| Recent Price: 7.88 Smart Investing & Trading Score: 64 | |
| Day Percent Change: 4.93% Day Change: 0.37 | |
| Week Change: 9.14% Year-to-date Change: -11.0% | |
| AURA Links: Profile News Message Board | |
| Charts:- Daily , Weekly | |
| Add AURA to Watchlist: View: Get Complete AURA Trend Analysis ➞ | |
 | TERN Terns Pharmaceuticals, Inc. |
| Sector: Health Care | |
| SubSector: Biotechnology | |
| MarketCap: 611 Millions | |
| Recent Price: 5.39 Smart Investing & Trading Score: 64 | |
| Day Percent Change: 4.86% Day Change: 0.25 | |
| Week Change: 9.78% Year-to-date Change: -18.5% | |
| TERN Links: Profile News Message Board | |
| Charts:- Daily , Weekly | |
| Add TERN to Watchlist: View: Get Complete TERN Trend Analysis ➞ | |
 | MLTX MoonLake Immunotherapeutics |
| Sector: Health Care | |
| SubSector: Biotechnology | |
| MarketCap: 2670 Millions | |
| Recent Price: 45.06 Smart Investing & Trading Score: 64 | |
| Day Percent Change: 4.23% Day Change: 1.83 | |
| Week Change: 6.1% Year-to-date Change: -28.2% | |
| MLTX Links: Profile News Message Board | |
| Charts:- Daily , Weekly | |
| Add MLTX to Watchlist: View: Get Complete MLTX Trend Analysis ➞ | |
 | PSTX Poseida Therapeutics, Inc. |
| Sector: Health Care | |
| SubSector: Biotechnology | |
| MarketCap: 64487 Millions | |
| Recent Price: 2.88 Smart Investing & Trading Score: 64 | |
| Day Percent Change: 3.23% Day Change: 0.09 | |
| Week Change: 35.21% Year-to-date Change: -14.4% | |
| PSTX Links: Profile News Message Board | |
| Charts:- Daily , Weekly | |
| Add PSTX to Watchlist: View: Get Complete PSTX Trend Analysis ➞ | |
 | GPCR Structure Therapeutics Inc. |
| Sector: Health Care | |
| SubSector: Biotechnology | |
| MarketCap: 1530 Millions | |
| Recent Price: 39.91 Smart Investing & Trading Score: 64 | |
| Day Percent Change: 2.78% Day Change: 1.08 | |
| Week Change: 2.58% Year-to-date Change: 4.8% | |
| GPCR Links: Profile News Message Board | |
| Charts:- Daily , Weekly | |
| Add GPCR to Watchlist: View: Get Complete GPCR Trend Analysis ➞ | |
| For tabular summary view of above stock list: Summary View ➞ 0 - 25 , 25 - 50 , 50 - 75 , 75 - 100 , 100 - 125 , 125 - 150 , 150 - 175 , 175 - 200 , 200 - 225 , 225 - 250 , 250 - 275 , 275 - 300 , 300 - 325 , 325 - 350 , 350 - 375 , 375 - 400 , 400 - 425 , 425 - 450 , 450 - 475 , 475 - 500 , 500 - 525 , 525 - 550 , 550 - 575 , 575 - 600 , 600 - 625 , 625 - 650 , 650 - 675 , 675 - 700 , 700 - 725 | ||
| Click To Change The Sort Order: By Market Cap or Company Size Performance: Year-to-date, Week and Day | |
| Select Chart Type: | ||
|
Best Stocks Today 12Stocks.com |
© 2024 12Stocks.com Terms & Conditions Privacy Contact Us
All Information Provided Only For Education And Not To Be Used For Investing or Trading. See Terms & Conditions


One More Thing ... Get Best Stocks Delivered Daily!
Never Ever Miss A Move With Our Top Ten Stocks Lists
Find Best Stocks In Any Market - Bull or Bear Market
Take A Peek At Our Top Ten Stocks Lists: Daily, Weekly, Year-to-Date & Top Trends
Find Best Stocks In Any Market - Bull or Bear Market
Take A Peek At Our Top Ten Stocks Lists: Daily, Weekly, Year-to-Date & Top Trends
Healthcare Stocks With Best Up Trends [0-bearish to 100-bullish]: Twist Bioscience[100], Joint [100], Tandem Diabetes[100], Alignment [100], Emergent Bio[100], DURECT [100], Amgen [100], LeMaitre Vascular[100], Select [100], Quantum-Si [100], Janux [100]
Best Healthcare Stocks Year-to-Date:
Pieris [5987.91%], Avenue [2868.94%], Precision BioSciences[2782.19%], Inovio [2272.55%], Assembly Biosciences[1503.46%], Agenus [1478.69%], Aurora Cannabis[1315.37%], Adverum Biotechnologies[1285.49%], NuCana [1252.27%], Affimed N.V[767.2%], GeneDx [625.37%] Best Healthcare Stocks This Week:
CytomX [178.62%], Emergent Bio[102.6%], GeneDx [78.07%], Deciphera [73.24%], Cue Biopharma[56.04%], Codexis [47.37%], Abeona [41.1%], Seres [40.61%], TransMedics [39%], Ardelyx [35.83%], Poseida [35.21%] Best Healthcare Stocks Daily:
Twist Bioscience[28.74%], Ardelyx [28.42%], Joint [25.35%], Tandem Diabetes[22.32%], Alignment [21.97%], Emergent Bio[17.88%], Butterfly Network[17.42%], Codexis [17.37%], Vaxxinity [17.27%], DURECT [17.17%], OptiNose [15.09%]