
 Login Sign Up


| |||||
 |  | ||||

| 12Stocks.com Market Intelligence |
Best Healthcare Stocks
 | "Discover best trending healthcare stocks with 12Stocks.com." |
| - Subu Vdaygiri, Founder, 12Stocks.com |
| In a hurry? Healthcare Stocks Lists: Performance Trends Table, Stock Charts
Sort Healthcare stocks: Daily, Weekly, Year-to-Date, Market Cap & Trends. Filter Healthcare stocks list by size:All Healthcare Large Mid-Range Small |
| 12Stocks.com Healthcare Stocks Performances & Trends Daily | |||||||||
|
|  The overall Smart Investing & Trading Score is 38 (0-bearish to 100-bullish) which puts Healthcare sector in short term bearish to neutral trend. The Smart Investing & Trading Score from previous trading session is 52 and hence a deterioration of trend.
| ||||||||
Here are the Smart Investing & Trading Scores of the most requested Healthcare stocks at 12Stocks.com (click stock name for detailed review):
|


| 12Stocks.com: Investing in Healthcare sector with Stocks | |
|
The following table helps investors and traders sort through current performance and trends (as measured by Smart Investing & Trading Score) of various
stocks in the Healthcare sector. Quick View: Move mouse or cursor over stock symbol (ticker) to view short-term Technical chart and over stock name to view long term chart. Click on  to add stock symbol to your watchlist and to add stock symbol to your watchlist and  to view watchlist. Click on any ticker or stock name for detailed market intelligence report for that stock. to view watchlist. Click on any ticker or stock name for detailed market intelligence report for that stock. |
12Stocks.com Performance of Stocks in Healthcare Sector
| Ticker | Stock Name | Watchlist | Category | Recent Price | Smart Investing & Trading Score | Change % | YTD Change% |
| EPIX | ESSA Pharma |   | Biotechnology | 6.10 | 10 | -4.39% | -6.73% |
| MRSN | Mersana | | Biotechnology | 2.75 | 10 | -4.34% | 18.75% |
| BCRX | BioCryst | | Biotechnology | 4.03 | 10 | -4.28% | -32.72% |
| ORIC | ORIC | | Biotechnology | 7.74 | 10 | -4.21% | -16.05% |
| SIBN | SI-BONE | | Equipment | 14.45 | 10 | -4.18% | -31.16% |
| PRTA | Prothena | | Biotechnology | 19.71 | 10 | -4.13% | -45.76% |
| LXRX | Lexicon | | Biotechnology | 1.53 | 10 | -4.06% | 0.33% |
| KOD | Kodiak Sciences | | Biotechnology | 3.25 | 10 | -3.85% | 6.91% |
| OMGA | Omega | | Biotechnology | 2.25 | 10 | -3.85% | -25.42% |
| TMCI | Treace | | Medical Devices | 10.30 | 10 | -3.70% | -19.19% |
| CYTK | Cytokinetics | | Biotechnology | 64.39 | 10 | -3.64% | -22.88% |
| BLUE | bluebird bio | | Biotechnology | 0.89 | 10 | -3.54% | -35.49% |
| APLS | Apellis | | Biotechnology | 48.17 | 10 | -3.52% | -19.53% |
| RAPT | RAPT | | Biotechnology | 7.63 | 10 | -3.48% | -69.32% |
| ZYME | Zymeworks | | Biotechnology | 8.27 | 10 | -3.27% | -20.40% |
| EDIT | Editas Medicine | | Biotechnology | 5.18 | 10 | -3.08% | -48.82% |
| TSVT | 2seventy bio | | Biotechnology | 3.50 | 10 | -20.18% | -19.08% |
| INMD | InMode | | Equipment | 16.90 | 10 | -2.65% | -24.01% |
| QTRX | Quanterix | | Biotechnology | 15.64 | 10 | -2.49% | -42.79% |
| CRBU | Caribou Biosciences | | Biotechnology | 3.77 | 10 | -2.46% | -34.06% |
| AMWL | American Well | | Health Information | 0.52 | 10 | -2.40% | -65.03% |
| HUM | Humana | | Insurance | 309.26 | 10 | -2.13% | -32.45% |
| BVS | Bioventus | | Medical Devices | 4.09 | 10 | -1.92% | -22.59% |
| ELAN | Elanco Animal | | Pharmaceutical | 13.06 | 10 | -1.88% | -12.35% |
| ZYXI | Zynex | | Equipment | 11.02 | 10 | -1.87% | 1.19% |
| For chart view version of above stock list: Chart View ➞ 0 - 25 , 25 - 50 , 50 - 75 , 75 - 100 , 100 - 125 , 125 - 150 , 150 - 175 , 175 - 200 , 200 - 225 , 225 - 250 , 250 - 275 , 275 - 300 , 300 - 325 , 325 - 350 , 350 - 375 , 375 - 400 , 400 - 425 , 425 - 450 , 450 - 475 , 475 - 500 , 500 - 525 , 525 - 550 , 550 - 575 , 575 - 600 , 600 - 625 , 625 - 650 | ||
 | Click To Change The Sort Order: By Market Cap or Company Size Performance: Year-to-date, Week and Day |  |
|
Get the most comprehensive stock market coverage daily at 12Stocks.com ➞ Best Stocks Today ➞ Best Stocks Weekly ➞ Best Stocks Year-to-Date ➞ Best Stocks Trends ➞  Best Stocks Today 12Stocks.com Best Nasdaq Stocks ➞ Best S&P 500 Stocks ➞ Best Tech Stocks ➞ Best Biotech Stocks ➞ |
| Detailed Overview of Healthcare Stocks |
| Healthcare Technical Overview, Leaders & Laggards, Top Healthcare ETF Funds & Detailed Healthcare Stocks List, Charts, Trends & More |
| Healthcare Sector: Technical Analysis, Trends & YTD Performance | |
| Healthcare sector is composed of stocks
from pharmaceutical, biotech, diagnostics labs, insurance providers
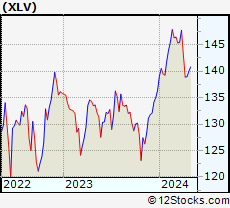
and healthcare services. Healthcare sector, as represented by XLV, an exchange-traded fund [ETF] that holds basket of Healthcare stocks (e.g, Merck, Amgen) is up by 2.63% and is currently underperforming the overall market by -1.29% year-to-date. Below is a quick view of Technical charts and trends: |
|
 XLV Weekly Chart |
|
| Long Term Trend: Not Good | |
| Medium Term Trend: Not Good | |
 XLV Daily Chart |
|
| Short Term Trend: Very Good | |
| Overall Trend Score: 38 | |
| YTD Performance: 2.63% | |
| **Trend Scores & Views Are Only For Educational Purposes And Not For Investing | |
| 12Stocks.com: Top Performing Healthcare Sector Stocks | ||||||||||||||||||||||||||||||||||||||||||||||||
 The top performing Healthcare sector stocks year to date are
Now, more recently, over last week, the top performing Healthcare sector stocks on the move are


|
||||||||||||||||||||||||||||||||||||||||||||||||
| 12Stocks.com: Investing in Healthcare Sector using Exchange Traded Funds | |
|
The following table shows list of key exchange traded funds (ETF) that
help investors track Healthcare Index. For detailed view, check out our ETF Funds section of our website. Quick View: Move mouse or cursor over ETF symbol (ticker) to view short-term Technical chart and over ETF name to view long term chart. Click on ticker or stock name for detailed view. Click on to add stock symbol to your watchlist and to view watchlist. |
12Stocks.com List of ETFs that track Healthcare Index
| Ticker | ETF Name | Watchlist | Recent Price | Smart Investing & Trading Score | Change % | Week % | Year-to-date % |
| XLV | Health Care | | 139.97 | 38 | -0.63 | 0.73 | 2.63% |
| IBB | Biotechnology | | 125.12 | 10 | -2.07 | 0.32 | -7.9% |
| BBH | Biotech | | 157.33 | 49 | 0.00 | 3.26 | -4.83% |
| IHF | Healthcare Providers | | 52.08 | 43 | -0.34 | -0.25 | -0.82% |
| PSCH | SmallCap Health Care | | 41.08 | 35 | -0.10 | 2.24 | -4.02% |
| XHS | Health Care Services | | 87.93 | 68 | -0.87 | 0.97 | -1.15% |
| PTH | DWA Healthcare Momentum | | 39.60 | 46 | -0.08 | 0.18 | 1.18% |
| BTEC | Principal Healthcare Innovators | | 34.21 | 32 | 0.02 | 1.04 | -5.83% |
| RXL | Health Care | | 95.94 | 38 | -0.07 | 2.91 | 4.96% |
| RXD | Short Health Care | | 11.37 | 45 | 0.19 | -2.36 | -4.7% |
| 12Stocks.com: Charts, Trends, Fundamental Data and Performances of Healthcare Stocks | |
|
We now take in-depth look at all Healthcare stocks including charts, multi-period performances and overall trends (as measured by Smart Investing & Trading Score). One can sort Healthcare stocks (click link to choose) by Daily, Weekly and by Year-to-Date performances. Also, one can sort by size of the company or by market capitalization. |
| Select Your Default Chart Type: | |||||
| |||||
| Click on stock symbol or name for detailed view. Click on to add stock symbol to your watchlist and to view watchlist. Quick View: Move mouse or cursor over "Daily" to quickly view daily Technical stock chart and over "Weekly" to view weekly Technical stock chart. | |||||

 | EPIX ESSA Pharma Inc. |
| Sector: Health Care | |
| SubSector: Biotechnology | |
| MarketCap: 70.5785 Millions | |
| Recent Price: 6.10 Smart Investing & Trading Score: 10 | |
| Day Percent Change: -4.39% Day Change: -0.28 | |
| Week Change: -7.15% Year-to-date Change: -6.7% | |
| EPIX Links: Profile News Message Board | |
| Charts:- Daily , Weekly | |
| Add EPIX to Watchlist: View: Get Complete EPIX Trend Analysis ➞ | |
 | MRSN Mersana Therapeutics, Inc. |
| Sector: Health Care | |
| SubSector: Biotechnology | |
| MarketCap: 224.385 Millions | |
| Recent Price: 2.75 Smart Investing & Trading Score: 10 | |
| Day Percent Change: -4.34% Day Change: -0.13 | |
| Week Change: -15.36% Year-to-date Change: 18.8% | |
| MRSN Links: Profile News Message Board | |
| Charts:- Daily , Weekly | |
| Add MRSN to Watchlist: View: Get Complete MRSN Trend Analysis ➞ | |
 | BCRX BioCryst Pharmaceuticals, Inc. |
| Sector: Health Care | |
| SubSector: Biotechnology | |
| MarketCap: 369.385 Millions | |
| Recent Price: 4.03 Smart Investing & Trading Score: 10 | |
| Day Percent Change: -4.28% Day Change: -0.18 | |
| Week Change: -9.03% Year-to-date Change: -32.7% | |
| BCRX Links: Profile News Message Board | |
| Charts:- Daily , Weekly | |
| Add BCRX to Watchlist: View: Get Complete BCRX Trend Analysis ➞ | |
 | ORIC ORIC Pharmaceuticals, Inc. |
| Sector: Health Care | |
| SubSector: Biotechnology | |
| MarketCap: 12787 Millions | |
| Recent Price: 7.74 Smart Investing & Trading Score: 10 | |
| Day Percent Change: -4.21% Day Change: -0.34 | |
| Week Change: -15.32% Year-to-date Change: -16.1% | |
| ORIC Links: Profile News Message Board | |
| Charts:- Daily , Weekly | |
| Add ORIC to Watchlist: View: Get Complete ORIC Trend Analysis ➞ | |
 | SIBN SI-BONE, Inc. |
| Sector: Health Care | |
| SubSector: Medical Appliances & Equipment | |
| MarketCap: 234.78 Millions | |
| Recent Price: 14.45 Smart Investing & Trading Score: 10 | |
| Day Percent Change: -4.18% Day Change: -0.63 | |
| Week Change: -6.41% Year-to-date Change: -31.2% | |
| SIBN Links: Profile News Message Board | |
| Charts:- Daily , Weekly | |
| Add SIBN to Watchlist: View: Get Complete SIBN Trend Analysis ➞ | |
 | PRTA Prothena Corporation plc |
| Sector: Health Care | |
| SubSector: Biotechnology | |
| MarketCap: 357.985 Millions | |
| Recent Price: 19.71 Smart Investing & Trading Score: 10 | |
| Day Percent Change: -4.13% Day Change: -0.85 | |
| Week Change: -6.85% Year-to-date Change: -45.8% | |
| PRTA Links: Profile News Message Board | |
| Charts:- Daily , Weekly | |
| Add PRTA to Watchlist: View: Get Complete PRTA Trend Analysis ➞ | |
 | LXRX Lexicon Pharmaceuticals, Inc. |
| Sector: Health Care | |
| SubSector: Biotechnology | |
| MarketCap: 251.185 Millions | |
| Recent Price: 1.53 Smart Investing & Trading Score: 10 | |
| Day Percent Change: -4.06% Day Change: -0.07 | |
| Week Change: -6.97% Year-to-date Change: 0.3% | |
| LXRX Links: Profile News Message Board | |
| Charts:- Daily , Weekly | |
| Add LXRX to Watchlist: View: Get Complete LXRX Trend Analysis ➞ | |
 | KOD Kodiak Sciences Inc. |
| Sector: Health Care | |
| SubSector: Biotechnology | |
| MarketCap: 2132.15 Millions | |
| Recent Price: 3.25 Smart Investing & Trading Score: 10 | |
| Day Percent Change: -3.85% Day Change: -0.13 | |
| Week Change: -3.27% Year-to-date Change: 6.9% | |
| KOD Links: Profile News Message Board | |
| Charts:- Daily , Weekly | |
| Add KOD to Watchlist: View: Get Complete KOD Trend Analysis ➞ | |
 | OMGA Omega Therapeutics, Inc. |
| Sector: Health Care | |
| SubSector: Biotechnology | |
| MarketCap: 304 Millions | |
| Recent Price: 2.25 Smart Investing & Trading Score: 10 | |
| Day Percent Change: -3.85% Day Change: -0.09 | |
| Week Change: -6.46% Year-to-date Change: -25.4% | |
| OMGA Links: Profile News Message Board | |
| Charts:- Daily , Weekly | |
| Add OMGA to Watchlist: View: Get Complete OMGA Trend Analysis ➞ | |
 | TMCI Treace Medical Concepts, Inc. |
| Sector: Health Care | |
| SubSector: Medical Devices | |
| MarketCap: 1550 Millions | |
| Recent Price: 10.30 Smart Investing & Trading Score: 10 | |
| Day Percent Change: -3.70% Day Change: -0.39 | |
| Week Change: -6.15% Year-to-date Change: -19.2% | |
| TMCI Links: Profile News Message Board | |
| Charts:- Daily , Weekly | |
| Add TMCI to Watchlist: View: Get Complete TMCI Trend Analysis ➞ | |
 | CYTK Cytokinetics, Incorporated |
| Sector: Health Care | |
| SubSector: Biotechnology | |
| MarketCap: 654.285 Millions | |
| Recent Price: 64.39 Smart Investing & Trading Score: 10 | |
| Day Percent Change: -3.64% Day Change: -2.43 | |
| Week Change: -4.68% Year-to-date Change: -22.9% | |
| CYTK Links: Profile News Message Board | |
| Charts:- Daily , Weekly | |
| Add CYTK to Watchlist: View: Get Complete CYTK Trend Analysis ➞ | |
 | BLUE bluebird bio, Inc. |
| Sector: Health Care | |
| SubSector: Biotechnology | |
| MarketCap: 3365.05 Millions | |
| Recent Price: 0.89 Smart Investing & Trading Score: 10 | |
| Day Percent Change: -3.54% Day Change: -0.03 | |
| Week Change: -12.73% Year-to-date Change: -35.5% | |
| BLUE Links: Profile News Message Board | |
| Charts:- Daily , Weekly | |
| Add BLUE to Watchlist: View: Get Complete BLUE Trend Analysis ➞ | |
 | APLS Apellis Pharmaceuticals, Inc. |
| Sector: Health Care | |
| SubSector: Biotechnology | |
| MarketCap: 2030.95 Millions | |
| Recent Price: 48.17 Smart Investing & Trading Score: 10 | |
| Day Percent Change: -3.52% Day Change: -1.76 | |
| Week Change: 1.35% Year-to-date Change: -19.5% | |
| APLS Links: Profile News Message Board | |
| Charts:- Daily , Weekly | |
| Add APLS to Watchlist: View: Get Complete APLS Trend Analysis ➞ | |
 | RAPT RAPT Therapeutics, Inc. |
| Sector: Health Care | |
| SubSector: Biotechnology | |
| MarketCap: 368.785 Millions | |
| Recent Price: 7.63 Smart Investing & Trading Score: 10 | |
| Day Percent Change: -3.48% Day Change: -0.28 | |
| Week Change: -4.21% Year-to-date Change: -69.3% | |
| RAPT Links: Profile News Message Board | |
| Charts:- Daily , Weekly | |
| Add RAPT to Watchlist: View: Get Complete RAPT Trend Analysis ➞ | |
 | ZYME Zymeworks Inc. |
| Sector: Health Care | |
| SubSector: Biotechnology | |
| MarketCap: 1373.55 Millions | |
| Recent Price: 8.27 Smart Investing & Trading Score: 10 | |
| Day Percent Change: -3.27% Day Change: -0.28 | |
| Week Change: -6.55% Year-to-date Change: -20.4% | |
| ZYME Links: Profile News Message Board | |
| Charts:- Daily , Weekly | |
| Add ZYME to Watchlist: View: Get Complete ZYME Trend Analysis ➞ | |
 | EDIT Editas Medicine, Inc. |
| Sector: Health Care | |
| SubSector: Biotechnology | |
| MarketCap: 1194.95 Millions | |
| Recent Price: 5.18 Smart Investing & Trading Score: 10 | |
| Day Percent Change: -3.08% Day Change: -0.17 | |
| Week Change: -5.56% Year-to-date Change: -48.8% | |
| EDIT Links: Profile News Message Board | |
| Charts:- Daily , Weekly | |
| Add EDIT to Watchlist: View: Get Complete EDIT Trend Analysis ➞ | |
 | TSVT 2seventy bio, Inc. |
| Sector: Health Care | |
| SubSector: Biotechnology | |
| MarketCap: 504 Millions | |
| Recent Price: 3.50 Smart Investing & Trading Score: 10 | |
| Day Percent Change: -20.18% Day Change: -0.88 | |
| Week Change: -22.57% Year-to-date Change: -19.1% | |
| TSVT Links: Profile News Message Board | |
| Charts:- Daily , Weekly | |
| Add TSVT to Watchlist: View: Get Complete TSVT Trend Analysis ➞ | |
 | INMD InMode Ltd. |
| Sector: Health Care | |
| SubSector: Medical Appliances & Equipment | |
| MarketCap: 689.08 Millions | |
| Recent Price: 16.90 Smart Investing & Trading Score: 10 | |
| Day Percent Change: -2.65% Day Change: -0.46 | |
| Week Change: -2.99% Year-to-date Change: -24.0% | |
| INMD Links: Profile News Message Board | |
| Charts:- Daily , Weekly | |
| Add INMD to Watchlist: View: Get Complete INMD Trend Analysis ➞ | |
 | QTRX Quanterix Corporation |
| Sector: Health Care | |
| SubSector: Biotechnology | |
| MarketCap: 448.685 Millions | |
| Recent Price: 15.64 Smart Investing & Trading Score: 10 | |
| Day Percent Change: -2.49% Day Change: -0.40 | |
| Week Change: -1.26% Year-to-date Change: -42.8% | |
| QTRX Links: Profile News Message Board | |
| Charts:- Daily , Weekly | |
| Add QTRX to Watchlist: View: Get Complete QTRX Trend Analysis ➞ | |
 | CRBU Caribou Biosciences, Inc. |
| Sector: Health Care | |
| SubSector: Biotechnology | |
| MarketCap: 258 Millions | |
| Recent Price: 3.77 Smart Investing & Trading Score: 10 | |
| Day Percent Change: -2.46% Day Change: -0.09 | |
| Week Change: -2.21% Year-to-date Change: -34.1% | |
| CRBU Links: Profile News Message Board | |
| Charts:- Daily , Weekly | |
| Add CRBU to Watchlist: View: Get Complete CRBU Trend Analysis ➞ | |
 | AMWL American Well Corporation |
| Sector: Health Care | |
| SubSector: Health Information Services | |
| MarketCap: 71987 Millions | |
| Recent Price: 0.52 Smart Investing & Trading Score: 10 | |
| Day Percent Change: -2.40% Day Change: -0.01 | |
| Week Change: -4.87% Year-to-date Change: -65.0% | |
| AMWL Links: Profile News Message Board | |
| Charts:- Daily , Weekly | |
| Add AMWL to Watchlist: View: Get Complete AMWL Trend Analysis ➞ | |
 | HUM Humana Inc. |
| Sector: Health Care | |
| SubSector: Health Care Plans | |
| MarketCap: 34125.6 Millions | |
| Recent Price: 309.26 Smart Investing & Trading Score: 10 | |
| Day Percent Change: -2.13% Day Change: -6.72 | |
| Week Change: -5.81% Year-to-date Change: -32.5% | |
| HUM Links: Profile News Message Board | |
| Charts:- Daily , Weekly | |
| Add HUM to Watchlist: View: Get Complete HUM Trend Analysis ➞ | |
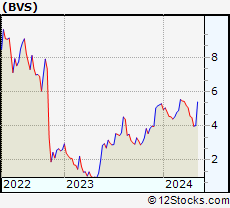 | BVS Bioventus Inc. |
| Sector: Health Care | |
| SubSector: Medical Devices | |
| MarketCap: 234 Millions | |
| Recent Price: 4.09 Smart Investing & Trading Score: 10 | |
| Day Percent Change: -1.92% Day Change: -0.08 | |
| Week Change: -8.59% Year-to-date Change: -22.6% | |
| BVS Links: Profile News Message Board | |
| Charts:- Daily , Weekly | |
| Add BVS to Watchlist: View: Get Complete BVS Trend Analysis ➞ | |
 | ELAN Elanco Animal Health Incorporated |
| Sector: Health Care | |
| SubSector: Drugs - Generic | |
| MarketCap: 7752.15 Millions | |
| Recent Price: 13.06 Smart Investing & Trading Score: 10 | |
| Day Percent Change: -1.88% Day Change: -0.25 | |
| Week Change: 0.85% Year-to-date Change: -12.4% | |
| ELAN Links: Profile News Message Board | |
| Charts:- Daily , Weekly | |
| Add ELAN to Watchlist: View: Get Complete ELAN Trend Analysis ➞ | |
 | ZYXI Zynex, Inc. |
| Sector: Health Care | |
| SubSector: Medical Appliances & Equipment | |
| MarketCap: 388.58 Millions | |
| Recent Price: 11.02 Smart Investing & Trading Score: 10 | |
| Day Percent Change: -1.87% Day Change: -0.21 | |
| Week Change: -3.04% Year-to-date Change: 1.2% | |
| ZYXI Links: Profile News Message Board | |
| Charts:- Daily , Weekly | |
| Add ZYXI to Watchlist: View: Get Complete ZYXI Trend Analysis ➞ | |
| For tabular summary view of above stock list: Summary View ➞ 0 - 25 , 25 - 50 , 50 - 75 , 75 - 100 , 100 - 125 , 125 - 150 , 150 - 175 , 175 - 200 , 200 - 225 , 225 - 250 , 250 - 275 , 275 - 300 , 300 - 325 , 325 - 350 , 350 - 375 , 375 - 400 , 400 - 425 , 425 - 450 , 450 - 475 , 475 - 500 , 500 - 525 , 525 - 550 , 550 - 575 , 575 - 600 , 600 - 625 , 625 - 650 | ||
| Click To Change The Sort Order: By Market Cap or Company Size Performance: Year-to-date, Week and Day | |
| Select Chart Type: | ||
|
Best Stocks Today 12Stocks.com |
© 2024 12Stocks.com Terms & Conditions Privacy Contact Us
All Information Provided Only For Education And Not To Be Used For Investing or Trading. See Terms & Conditions


One More Thing ... Get Best Stocks Delivered Daily!
Never Ever Miss A Move With Our Top Ten Stocks Lists
Find Best Stocks In Any Market - Bull or Bear Market
Take A Peek At Our Top Ten Stocks Lists: Daily, Weekly, Year-to-Date & Top Trends
Find Best Stocks In Any Market - Bull or Bear Market
Take A Peek At Our Top Ten Stocks Lists: Daily, Weekly, Year-to-Date & Top Trends
Healthcare Stocks With Best Up Trends [0-bearish to 100-bullish]: AstraZeneca [100], Merck [100], Boston Scientific[100], Annovis Bio[100], Agios [100], Quest Diagnostics[100], Haemonetics [100], Mesoblast [95], Agenus [95], NewAmsterdam Pharma[93], Centene [93]
Best Healthcare Stocks Year-to-Date:
Precision BioSciences[2590.41%], Inovio [1819.61%], Assembly Biosciences[1543.7%], Aurora Cannabis[1356.32%], NuCana [1198.17%], Agenus [773.9%], CareMax [572.16%], Corbus [480.63%], Mesoblast [454.55%], Janux [332.95%], GeneDx [318.57%] Best Healthcare Stocks This Week:
OptiNose [36.3%], Agenus [36.25%], BeyondSpring [35%], Seres [34.31%], Annovis Bio[28.35%], CareMax [26.85%], ProKidney [24.02%], Aesthetic [21.49%], MSP Recovery[19.2%], GeneDx [18.1%], Mesoblast [17.08%] Best Healthcare Stocks Daily:
OptiNose [31.85%], Zura Bio[8.59%], Community Health[7.10%], LENSAR [6.92%], AstraZeneca [5.88%], Sanofi [5.47%], ADiTx [4.41%], Monopar [4.29%], Centessa [3.82%], Dr. Reddy[3.74%], Theratechnologies [3.68%]