
 Login Sign Up


| |||||
 |  | ||||

| 12Stocks.com Market Intelligence |
Best Healthcare Stocks
 | "Discover best trending healthcare stocks with 12Stocks.com." |
| - Subu Vdaygiri, Founder, 12Stocks.com |
| In a hurry? Healthcare Stocks Lists: Performance Trends Table, Stock Charts
Sort Healthcare stocks: Daily, Weekly, Year-to-Date, Market Cap & Trends. Filter Healthcare stocks list by size:All Healthcare Large Mid-Range Small |
| 12Stocks.com Healthcare Stocks Performances & Trends Daily | |||||||||
|
|  The overall Smart Investing & Trading Score is 25 (0-bearish to 100-bullish) which puts Healthcare sector in short term bearish to neutral trend. The Smart Investing & Trading Score from previous trading session is 18 and hence an improvement of trend.
| ||||||||
Here are the Smart Investing & Trading Scores of the most requested Healthcare stocks at 12Stocks.com (click stock name for detailed review):
|


| 12Stocks.com: Investing in Healthcare sector with Stocks | |
|
The following table helps investors and traders sort through current performance and trends (as measured by Smart Investing & Trading Score) of various
stocks in the Healthcare sector. Quick View: Move mouse or cursor over stock symbol (ticker) to view short-term Technical chart and over stock name to view long term chart. Click on  to add stock symbol to your watchlist and to add stock symbol to your watchlist and  to view watchlist. Click on any ticker or stock name for detailed market intelligence report for that stock. to view watchlist. Click on any ticker or stock name for detailed market intelligence report for that stock. |
12Stocks.com Performance of Stocks in Healthcare Sector
| Ticker | Stock Name | Watchlist | Category | Recent Price | Smart Investing & Trading Score | Change % | YTD Change% |
| MEDP | Medpace |   | Laboratories | 371.87 | 26 | -0.65% | 21.32% |
| VCEL | Vericel | | Biotechnology | 43.74 | 26 | -0.27% | 22.83% |
| TNXP | Tonix | | Biotechnology | 0.16 | 25 | 1.91% | -60.30% |
| CSTL | Castle Biosciences | | Laboratories | 19.28 | 25 | 0.42% | -10.66% |
| PETS | PetMed Express | | Delivery | 4.11 | 25 | 0.00% | -45.63% |
| TMDX | TransMedics | | Equipment | 84.18 | 25 | -3.51% | 6.65% |
| CPIX | Cumberland | | Pharmaceutical | 1.60 | 25 | -3.03% | -10.70% |
| LFST | LifeStance Health | | Medical Care Facilities | 5.71 | 25 | -0.78% | -27.86% |
| CUE | Cue Biopharma | | Biotechnology | 1.57 | 25 | -0.63% | -40.53% |
| SHLT | SHL Telemedicine | | Health Information | 5.15 | 25 | -0.58% | -39.15% |
| BIIB | Biogen | | Biotechnology | 194.38 | 25 | 2.03% | -24.88% |
| LH | Laboratory | | Laboratories | 201.48 | 25 | 1.02% | -11.36% |
| SLNO | Soleno | | Laboratories | 37.53 | 25 | 1.02% | -6.76% |
| MDT | Medtronic | | Equipment | 79.48 | 25 | 0.37% | -3.52% |
| REGN | Regeneron | | Biotechnology | 896.82 | 25 | 0.32% | 2.11% |
| VRTX | Vertex | | Biotechnology | 394.28 | 25 | 0.20% | -3.10% |
| COO | Cooper | | Instruments | 90.42 | 25 | 0.01% | -4.43% |
| STE | STERIS | | Instruments | 199.51 | 25 | -0.65% | -9.25% |
| RGC | Regencell Bioscience | | Drug Manufacturers - Specialty & Generic | 5.55 | 24 | 6.32% | -47.14% |
| IMNM | Immunome | | Biotechnology | 16.69 | 23 | -2.82% | 56.13% |
| MRNA | Moderna | | Biotechnology | 101.44 | 23 | -0.55% | 2.00% |
| ALLK | Allakos | | Biotechnology | 1.06 | 23 | 0.47% | -60.99% |
| AXNX | Axonics Modulation | | Equipment | 66.96 | 23 | -0.13% | 7.60% |
| QSI | Quantum-Si | | Biotechnology | 1.57 | 22 | 3.29% | -21.89% |
| ANTX | AN2 | | Biotechnology | 2.47 | 22 | 2.92% | -87.94% |
| For chart view version of above stock list: Chart View ➞ 0 - 25 , 25 - 50 , 50 - 75 , 75 - 100 , 100 - 125 , 125 - 150 , 150 - 175 , 175 - 200 , 200 - 225 , 225 - 250 , 250 - 275 , 275 - 300 , 300 - 325 , 325 - 350 , 350 - 375 , 375 - 400 , 400 - 425 , 425 - 450 , 450 - 475 , 475 - 500 , 500 - 525 , 525 - 550 , 550 - 575 , 575 - 600 , 600 - 625 , 625 - 650 , 650 - 675 , 675 - 700 , 700 - 725 | ||
 | Click To Change The Sort Order: By Market Cap or Company Size Performance: Year-to-date, Week and Day |  |
|
Get the most comprehensive stock market coverage daily at 12Stocks.com ➞ Best Stocks Today ➞ Best Stocks Weekly ➞ Best Stocks Year-to-Date ➞ Best Stocks Trends ➞  Best Stocks Today 12Stocks.com Best Nasdaq Stocks ➞ Best S&P 500 Stocks ➞ Best Tech Stocks ➞ Best Biotech Stocks ➞ |
| Detailed Overview of Healthcare Stocks |
| Healthcare Technical Overview, Leaders & Laggards, Top Healthcare ETF Funds & Detailed Healthcare Stocks List, Charts, Trends & More |
| Healthcare Sector: Technical Analysis, Trends & YTD Performance | |
| Healthcare sector is composed of stocks
from pharmaceutical, biotech, diagnostics labs, insurance providers
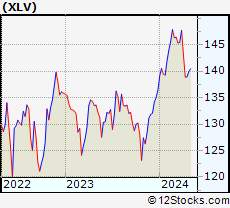
and healthcare services. Healthcare sector, as represented by XLV, an exchange-traded fund [ETF] that holds basket of Healthcare stocks (e.g, Merck, Amgen) is up by 1.88% and is currently underperforming the overall market by -1.5% year-to-date. Below is a quick view of Technical charts and trends: |
|
 XLV Weekly Chart |
|
| Long Term Trend: Not Good | |
| Medium Term Trend: Not Good | |
 XLV Daily Chart |
|
| Short Term Trend: Very Good | |
| Overall Trend Score: 25 | |
| YTD Performance: 1.88% | |
| **Trend Scores & Views Are Only For Educational Purposes And Not For Investing | |
| 12Stocks.com: Top Performing Healthcare Sector Stocks | ||||||||||||||||||||||||||||||||||||||||||||||||
 The top performing Healthcare sector stocks year to date are
Now, more recently, over last week, the top performing Healthcare sector stocks on the move are


|
||||||||||||||||||||||||||||||||||||||||||||||||
| 12Stocks.com: Investing in Healthcare Sector using Exchange Traded Funds | |
|
The following table shows list of key exchange traded funds (ETF) that
help investors track Healthcare Index. For detailed view, check out our ETF Funds section of our website. Quick View: Move mouse or cursor over ETF symbol (ticker) to view short-term Technical chart and over ETF name to view long term chart. Click on ticker or stock name for detailed view. Click on to add stock symbol to your watchlist and to view watchlist. |
12Stocks.com List of ETFs that track Healthcare Index
| Ticker | ETF Name | Watchlist | Recent Price | Smart Investing & Trading Score | Change % | Week % | Year-to-date % |
| XLV | Health Care | | 138.95 | 25 | 0.38 | 0.03 | 1.88% |
| XBI | Biotech | | 82.83 | 10 | -0.78 | -6.04 | -7.23% |
| IBB | Biotechnology | | 124.72 | 10 | 0.06 | -3.75 | -8.19% |
| BBH | Biotech | | 152.36 | 10 | 0.01 | -3.32 | -7.83% |
| VHT | Health Care | | 253.33 | 18 | 0.20 | -0.57 | 1.05% |
| IYH | Healthcare | | 58.16 | 18 | 0.19 | -0.41 | 1.59% |
| IHF | Healthcare Providers | | 52.21 | 62 | 1.29 | 3.3 | -0.57% |
| IHI | Medical Devices | | 54.36 | 10 | -0.31 | -3.1 | 0.72% |
| BIB | Biotechnology | | 48.20 | 10 | 0.54 | -6.21 | -15.51% |
| BIS | Short Biotech | | 20.90 | 95 | 0.14 | 6.61 | 15.63% |
| XHE | Health Care Equipment | | 81.27 | 10 | -0.20 | -3.13 | -3.55% |
| CURE | Healthcare Bull 3X | | 103.33 | 25 | 1.09 | -0.06 | 1.56% |
| LABU | Biotech Bull 3X | | 86.05 | 10 | -2.26 | -17.54 | -29.45% |
| LABD | Biotech Bear 3X | | 10.80 | 100 | 2.66 | 20.27 | 11.46% |
| PSCH | SmallCap Health Care | | 40.18 | 20 | 0.25 | -3.02 | -6.12% |
| XHS | Health Care Services | | 87.08 | 38 | 1.04 | -1.05 | -2.1% |
| PTH | DWA Healthcare Momentum | | 39.53 | 23 | -0.10 | -5.5 | 1% |
| BTEC | Principal Healthcare Innovators | | 33.86 | 0 | -0.67 | -5.92 | -6.8% |
| RXL | Health Care | | 93.22 | 25 | 0.85 | -0.03 | 1.99% |
| RXD | Short Health Care | | 11.64 | 76 | -0.29 | 0.34 | -2.39% |
| 12Stocks.com: Charts, Trends, Fundamental Data and Performances of Healthcare Stocks | |
|
We now take in-depth look at all Healthcare stocks including charts, multi-period performances and overall trends (as measured by Smart Investing & Trading Score). One can sort Healthcare stocks (click link to choose) by Daily, Weekly and by Year-to-Date performances. Also, one can sort by size of the company or by market capitalization. |
| Select Your Default Chart Type: | |||||
| |||||
| Click on stock symbol or name for detailed view. Click on to add stock symbol to your watchlist and to view watchlist. Quick View: Move mouse or cursor over "Daily" to quickly view daily Technical stock chart and over "Weekly" to view weekly Technical stock chart. | |||||

 | MEDP Medpace Holdings, Inc. |
| Sector: Health Care | |
| SubSector: Medical Laboratories & Research | |
| MarketCap: 2888.7 Millions | |
| Recent Price: 371.87 Smart Investing & Trading Score: 26 | |
| Day Percent Change: -0.65% Day Change: -2.45 | |
| Week Change: -5.86% Year-to-date Change: 21.3% | |
| MEDP Links: Profile News Message Board | |
| Charts:- Daily , Weekly | |
| Add MEDP to Watchlist: View: Get Complete MEDP Trend Analysis ➞ | |
 | VCEL Vericel Corporation |
| Sector: Health Care | |
| SubSector: Biotechnology | |
| MarketCap: 391.885 Millions | |
| Recent Price: 43.74 Smart Investing & Trading Score: 26 | |
| Day Percent Change: -0.27% Day Change: -0.12 | |
| Week Change: -8.68% Year-to-date Change: 22.8% | |
| VCEL Links: Profile News Message Board | |
| Charts:- Daily , Weekly | |
| Add VCEL to Watchlist: View: Get Complete VCEL Trend Analysis ➞ | |
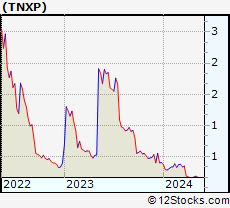 | TNXP Tonix Pharmaceuticals Holding Corp. |
| Sector: Health Care | |
| SubSector: Biotechnology | |
| MarketCap: 52.4785 Millions | |
| Recent Price: 0.16 Smart Investing & Trading Score: 25 | |
| Day Percent Change: 1.91% Day Change: 0.00 | |
| Week Change: -1.54% Year-to-date Change: -60.3% | |
| TNXP Links: Profile News Message Board | |
| Charts:- Daily , Weekly | |
| Add TNXP to Watchlist: View: Get Complete TNXP Trend Analysis ➞ | |
 | CSTL Castle Biosciences, Inc. |
| Sector: Health Care | |
| SubSector: Medical Laboratories & Research | |
| MarketCap: 545 Millions | |
| Recent Price: 19.28 Smart Investing & Trading Score: 25 | |
| Day Percent Change: 0.42% Day Change: 0.08 | |
| Week Change: -3.89% Year-to-date Change: -10.7% | |
| CSTL Links: Profile News Message Board | |
| Charts:- Daily , Weekly | |
| Add CSTL to Watchlist: View: Get Complete CSTL Trend Analysis ➞ | |
 | PETS PetMed Express, Inc. |
| Sector: Health Care | |
| SubSector: Drug Delivery | |
| MarketCap: 528.23 Millions | |
| Recent Price: 4.11 Smart Investing & Trading Score: 25 | |
| Day Percent Change: 0.00% Day Change: 0.00 | |
| Week Change: -1.2% Year-to-date Change: -45.6% | |
| PETS Links: Profile News Message Board | |
| Charts:- Daily , Weekly | |
| Add PETS to Watchlist: View: Get Complete PETS Trend Analysis ➞ | |
 | TMDX TransMedics Group, Inc. |
| Sector: Health Care | |
| SubSector: Medical Appliances & Equipment | |
| MarketCap: 331.68 Millions | |
| Recent Price: 84.18 Smart Investing & Trading Score: 25 | |
| Day Percent Change: -3.51% Day Change: -3.06 | |
| Week Change: -8.32% Year-to-date Change: 6.7% | |
| TMDX Links: Profile News Message Board | |
| Charts:- Daily , Weekly | |
| Add TMDX to Watchlist: View: Get Complete TMDX Trend Analysis ➞ | |
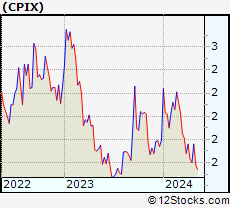 | CPIX Cumberland Pharmaceuticals Inc. |
| Sector: Health Care | |
| SubSector: Drug Manufacturers - Other | |
| MarketCap: 57.4033 Millions | |
| Recent Price: 1.60 Smart Investing & Trading Score: 25 | |
| Day Percent Change: -3.03% Day Change: -0.05 | |
| Week Change: -1.84% Year-to-date Change: -10.7% | |
| CPIX Links: Profile News Message Board | |
| Charts:- Daily , Weekly | |
| Add CPIX to Watchlist: View: Get Complete CPIX Trend Analysis ➞ | |
 | LFST LifeStance Health Group, Inc. |
| Sector: Health Care | |
| SubSector: Medical Care Facilities | |
| MarketCap: 3460 Millions | |
| Recent Price: 5.71 Smart Investing & Trading Score: 25 | |
| Day Percent Change: -0.78% Day Change: -0.04 | |
| Week Change: -5.62% Year-to-date Change: -27.9% | |
| LFST Links: Profile News Message Board | |
| Charts:- Daily , Weekly | |
| Add LFST to Watchlist: View: Get Complete LFST Trend Analysis ➞ | |
 | CUE Cue Biopharma, Inc. |
| Sector: Health Care | |
| SubSector: Biotechnology | |
| MarketCap: 352.785 Millions | |
| Recent Price: 1.57 Smart Investing & Trading Score: 25 | |
| Day Percent Change: -0.63% Day Change: -0.01 | |
| Week Change: -10.29% Year-to-date Change: -40.5% | |
| CUE Links: Profile News Message Board | |
| Charts:- Daily , Weekly | |
| Add CUE to Watchlist: View: Get Complete CUE Trend Analysis ➞ | |
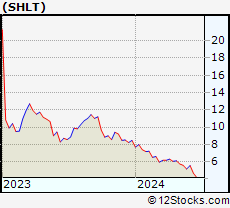 | SHLT SHL Telemedicine Ltd. |
| Sector: Health Care | |
| SubSector: Health Information Services | |
| MarketCap: 174 Millions | |
| Recent Price: 5.15 Smart Investing & Trading Score: 25 | |
| Day Percent Change: -0.58% Day Change: -0.03 | |
| Week Change: -7.62% Year-to-date Change: -39.2% | |
| SHLT Links: Profile News Message Board | |
| Charts:- Daily , Weekly | |
| Add SHLT to Watchlist: View: Get Complete SHLT Trend Analysis ➞ | |
 | BIIB Biogen Inc. |
| Sector: Health Care | |
| SubSector: Biotechnology | |
| MarketCap: 53102.6 Millions | |
| Recent Price: 194.38 Smart Investing & Trading Score: 25 | |
| Day Percent Change: 2.03% Day Change: 3.86 | |
| Week Change: -1.92% Year-to-date Change: -24.9% | |
| BIIB Links: Profile News Message Board | |
| Charts:- Daily , Weekly | |
| Add BIIB to Watchlist: View: Get Complete BIIB Trend Analysis ➞ | |
 | LH Laboratory Corporation of America Holdings |
| Sector: Health Care | |
| SubSector: Medical Laboratories & Research | |
| MarketCap: 12119.2 Millions | |
| Recent Price: 201.48 Smart Investing & Trading Score: 25 | |
| Day Percent Change: 1.02% Day Change: 2.03 | |
| Week Change: -2.07% Year-to-date Change: -11.4% | |
| LH Links: Profile News Message Board | |
| Charts:- Daily , Weekly | |
| Add LH to Watchlist: View: Get Complete LH Trend Analysis ➞ | |
 | SLNO Soleno Therapeutics, Inc. |
| Sector: Health Care | |
| SubSector: Medical Laboratories & Research | |
| MarketCap: 94 Millions | |
| Recent Price: 37.53 Smart Investing & Trading Score: 25 | |
| Day Percent Change: 1.02% Day Change: 0.38 | |
| Week Change: 1.05% Year-to-date Change: -6.8% | |
| SLNO Links: Profile News Message Board | |
| Charts:- Daily , Weekly | |
| Add SLNO to Watchlist: View: Get Complete SLNO Trend Analysis ➞ | |
 | MDT Medtronic plc |
| Sector: Health Care | |
| SubSector: Medical Appliances & Equipment | |
| MarketCap: 113698 Millions | |
| Recent Price: 79.48 Smart Investing & Trading Score: 25 | |
| Day Percent Change: 0.37% Day Change: 0.29 | |
| Week Change: -0.81% Year-to-date Change: -3.5% | |
| MDT Links: Profile News Message Board | |
| Charts:- Daily , Weekly | |
| Add MDT to Watchlist: View: Get Complete MDT Trend Analysis ➞ | |
 | REGN Regeneron Pharmaceuticals, Inc. |
| Sector: Health Care | |
| SubSector: Biotechnology | |
| MarketCap: 51903.7 Millions | |
| Recent Price: 896.82 Smart Investing & Trading Score: 25 | |
| Day Percent Change: 0.32% Day Change: 2.83 | |
| Week Change: -0.87% Year-to-date Change: 2.1% | |
| REGN Links: Profile News Message Board | |
| Charts:- Daily , Weekly | |
| Add REGN to Watchlist: View: Get Complete REGN Trend Analysis ➞ | |
 | VRTX Vertex Pharmaceuticals Incorporated |
| Sector: Health Care | |
| SubSector: Biotechnology | |
| MarketCap: 57669.6 Millions | |
| Recent Price: 394.28 Smart Investing & Trading Score: 25 | |
| Day Percent Change: 0.20% Day Change: 0.80 | |
| Week Change: -0.57% Year-to-date Change: -3.1% | |
| VRTX Links: Profile News Message Board | |
| Charts:- Daily , Weekly | |
| Add VRTX to Watchlist: View: Get Complete VRTX Trend Analysis ➞ | |
 | COO The Cooper Companies, Inc. |
| Sector: Health Care | |
| SubSector: Medical Instruments & Supplies | |
| MarketCap: 15460 Millions | |
| Recent Price: 90.42 Smart Investing & Trading Score: 25 | |
| Day Percent Change: 0.01% Day Change: 0.01 | |
| Week Change: -3.31% Year-to-date Change: -4.4% | |
| COO Links: Profile News Message Board | |
| Charts:- Daily , Weekly | |
| Add COO to Watchlist: View: Get Complete COO Trend Analysis ➞ | |
 | STE STERIS plc |
| Sector: Health Care | |
| SubSector: Medical Instruments & Supplies | |
| MarketCap: 10875 Millions | |
| Recent Price: 199.51 Smart Investing & Trading Score: 25 | |
| Day Percent Change: -0.65% Day Change: -1.30 | |
| Week Change: -2.2% Year-to-date Change: -9.3% | |
| STE Links: Profile News Message Board | |
| Charts:- Daily , Weekly | |
| Add STE to Watchlist: View: Get Complete STE Trend Analysis ➞ | |
 | RGC Regencell Bioscience Holdings Limited |
| Sector: Health Care | |
| SubSector: Drug Manufacturers - Specialty & Generic | |
| MarketCap: 284 Millions | |
| Recent Price: 5.55 Smart Investing & Trading Score: 24 | |
| Day Percent Change: 6.32% Day Change: 0.33 | |
| Week Change: 45.67% Year-to-date Change: -47.1% | |
| RGC Links: Profile News Message Board | |
| Charts:- Daily , Weekly | |
| Add RGC to Watchlist: View: Get Complete RGC Trend Analysis ➞ | |
 | IMNM Immunome, Inc. |
| Sector: Health Care | |
| SubSector: Biotechnology | |
| MarketCap: 12487 Millions | |
| Recent Price: 16.69 Smart Investing & Trading Score: 23 | |
| Day Percent Change: -2.82% Day Change: -0.48 | |
| Week Change: -18.9% Year-to-date Change: 56.1% | |
| IMNM Links: Profile News Message Board | |
| Charts:- Daily , Weekly | |
| Add IMNM to Watchlist: View: Get Complete IMNM Trend Analysis ➞ | |
 | MRNA Moderna, Inc. |
| Sector: Health Care | |
| SubSector: Biotechnology | |
| MarketCap: 11006.4 Millions | |
| Recent Price: 101.44 Smart Investing & Trading Score: 23 | |
| Day Percent Change: -0.55% Day Change: -0.56 | |
| Week Change: -3.52% Year-to-date Change: 2.0% | |
| MRNA Links: Profile News Message Board | |
| Charts:- Daily , Weekly | |
| Add MRNA to Watchlist: View: Get Complete MRNA Trend Analysis ➞ | |
 | ALLK Allakos Inc. |
| Sector: Health Care | |
| SubSector: Biotechnology | |
| MarketCap: 3233.55 Millions | |
| Recent Price: 1.06 Smart Investing & Trading Score: 23 | |
| Day Percent Change: 0.47% Day Change: 0.00 | |
| Week Change: -4.05% Year-to-date Change: -61.0% | |
| ALLK Links: Profile News Message Board | |
| Charts:- Daily , Weekly | |
| Add ALLK to Watchlist: View: Get Complete ALLK Trend Analysis ➞ | |
 | AXNX Axonics Modulation Technologies, Inc. |
| Sector: Health Care | |
| SubSector: Medical Appliances & Equipment | |
| MarketCap: 692.48 Millions | |
| Recent Price: 66.96 Smart Investing & Trading Score: 23 | |
| Day Percent Change: -0.13% Day Change: -0.09 | |
| Week Change: -0.95% Year-to-date Change: 7.6% | |
| AXNX Links: Profile News Message Board | |
| Charts:- Daily , Weekly | |
| Add AXNX to Watchlist: View: Get Complete AXNX Trend Analysis ➞ | |
 | QSI Quantum-Si incorporated |
| Sector: Health Care | |
| SubSector: Biotechnology | |
| MarketCap: 256 Millions | |
| Recent Price: 1.57 Smart Investing & Trading Score: 22 | |
| Day Percent Change: 3.29% Day Change: 0.05 | |
| Week Change: -7.1% Year-to-date Change: -21.9% | |
| QSI Links: Profile News Message Board | |
| Charts:- Daily , Weekly | |
| Add QSI to Watchlist: View: Get Complete QSI Trend Analysis ➞ | |
 | ANTX AN2 Therapeutics, Inc. |
| Sector: Health Care | |
| SubSector: Biotechnology | |
| MarketCap: 163 Millions | |
| Recent Price: 2.47 Smart Investing & Trading Score: 22 | |
| Day Percent Change: 2.92% Day Change: 0.07 | |
| Week Change: -9.85% Year-to-date Change: -87.9% | |
| ANTX Links: Profile News Message Board | |
| Charts:- Daily , Weekly | |
| Add ANTX to Watchlist: View: Get Complete ANTX Trend Analysis ➞ | |
| For tabular summary view of above stock list: Summary View ➞ 0 - 25 , 25 - 50 , 50 - 75 , 75 - 100 , 100 - 125 , 125 - 150 , 150 - 175 , 175 - 200 , 200 - 225 , 225 - 250 , 250 - 275 , 275 - 300 , 300 - 325 , 325 - 350 , 350 - 375 , 375 - 400 , 400 - 425 , 425 - 450 , 450 - 475 , 475 - 500 , 500 - 525 , 525 - 550 , 550 - 575 , 575 - 600 , 600 - 625 , 625 - 650 , 650 - 675 , 675 - 700 , 700 - 725 | ||
| Click To Change The Sort Order: By Market Cap or Company Size Performance: Year-to-date, Week and Day | |
| Select Chart Type: | ||
|
Best Stocks Today 12Stocks.com |
© 2024 12Stocks.com Terms & Conditions Privacy Contact Us
All Information Provided Only For Education And Not To Be Used For Investing or Trading. See Terms & Conditions


One More Thing ... Get Best Stocks Delivered Daily!
Never Ever Miss A Move With Our Top Ten Stocks Lists
Find Best Stocks In Any Market - Bull or Bear Market
Take A Peek At Our Top Ten Stocks Lists: Daily, Weekly, Year-to-Date & Top Trends
Find Best Stocks In Any Market - Bull or Bear Market
Take A Peek At Our Top Ten Stocks Lists: Daily, Weekly, Year-to-Date & Top Trends
Healthcare Stocks With Best Up Trends [0-bearish to 100-bullish]: Vanda [100], Rani [95], Humacyte [95], Phibro Animal[95], ALX Oncology[95], Fresenius [95], Oscar Health[95], Lantheus [93], United [93], Mesoblast [88], OPKO Health[88]
Best Healthcare Stocks Year-to-Date:
Precision BioSciences[2571.23%], Inovio [1798.04%], Assembly Biosciences[1535.17%], Adverum Biotechnologies[1406.38%], Aurora Cannabis[1256.57%], NuCana [1188.03%], Affimed N.V[724%], Corbus [549.67%], Agenus [541.38%], CareMax [429.9%], Zhongchao [412.19%] Best Healthcare Stocks This Week:
NuCana [1601.65%], Regencell Bioscience[45.67%], Rani [30.93%], Humacyte [28.47%], Venus Concept[25.44%], Vanda [24.03%], ALX Oncology[22.49%], ProKidney [16.57%], Nyxoah S.A[16.22%], Galera [15.36%], UnitedHealth [14.1%] Best Healthcare Stocks Daily:
Rani [15.71%], Genelux [14.25%], Humacyte [14.02%], Accelerate Diagnostics[11.56%], Emergent Bio[9.68%], Venus Concept[8.75%], Adaptimmune [8.72%], BioXcel [8.63%], Corbus [7.42%], RedHill Biopharma[7.41%], DermTech [7.05%]