
 Login Sign Up


| |||||
 |  | ||||

| 12Stocks.com Market Intelligence |
Best Healthcare Stocks
 | "Discover best trending healthcare stocks with 12Stocks.com." |
| - Subu Vdaygiri, Founder, 12Stocks.com |
| In a hurry? Healthcare Stocks Lists: Performance Trends Table, Stock Charts
Sort Healthcare stocks: Daily, Weekly, Year-to-Date, Market Cap & Trends. Filter Healthcare stocks list by size:All Healthcare Large Mid-Range Small |
| 12Stocks.com Healthcare Stocks Performances & Trends Daily | |||||||||
|
|  The overall Smart Investing & Trading Score is 60 (0-bearish to 100-bullish) which puts Healthcare sector in short term neutral to bullish trend. The Smart Investing & Trading Score from previous trading session is 30 and hence an improvement of trend.
| ||||||||
Here are the Smart Investing & Trading Scores of the most requested Healthcare stocks at 12Stocks.com (click stock name for detailed review):
|


| 12Stocks.com: Investing in Healthcare sector with Stocks | |
|
The following table helps investors and traders sort through current performance and trends (as measured by Smart Investing & Trading Score) of various
stocks in the Healthcare sector. Quick View: Move mouse or cursor over stock symbol (ticker) to view short-term Technical chart and over stock name to view long term chart. Click on  to add stock symbol to your watchlist and to add stock symbol to your watchlist and  to view watchlist. Click on any ticker or stock name for detailed market intelligence report for that stock. to view watchlist. Click on any ticker or stock name for detailed market intelligence report for that stock. |
12Stocks.com Performance of Stocks in Healthcare Sector
| Ticker | Stock Name | Watchlist | Category | Recent Price | Smart Investing & Trading Score | Change % | YTD Change% |
| ACLX | Arcellx |   | Biotechnology | 51.11 | 10 | -1.47% | -8.41% |
| BDSX | Biodesix | | Diagnostics & Research | 1.22 | 10 | -1.21% | -35.79% |
| NERV | Minerva Neurosciences | | Biotechnology | 2.41 | 10 | -1.11% | -60.81% |
| HUM | Humana | | Insurance | 303.15 | 10 | -0.90% | -33.78% |
| FULC | Fulcrum | | Biotechnology | 7.08 | 10 | -0.84% | 4.89% |
| RCKT | Rocket | | Biotechnology | 21.85 | 10 | -0.59% | -27.09% |
| IVA | Inventiva S.A | | Biotechnology | 3.24 | 10 | -0.31% | -28.16% |
| BMEA | Biomea Fusion | | Biotechnology | 10.75 | 10 | -0.19% | -26.57% |
| OPTN | OptiNose | | Pharmaceutical | 0.86 | 10 | -0.14% | -33.40% |
| ABBV | AbbVie | | Pharmaceutical | 161.52 | 8 | 1.19% | 4.23% |
| BMRN | BioMarin | | Biotechnology | 82.13 | 7 | 1.51% | -14.82% |
| USNA | USANA Health | | Pharmaceutical | 42.98 | 7 | -1.13% | -19.81% |
| SLN | Silence | | Biotechnology | 21.88 | 5 | 1.27% | 24.64% |
| RLMD | Relmada | | Biotechnology | 3.53 | 5 | -7.83% | -14.73% |
| CHE | Chemed | | Home Care | 566.51 | 0 | 1.09% | -3.12% |
| MOH | Molina | | Insurance | 343.89 | 0 | 0.49% | -4.82% |
| LNSR | LENSAR | | Medical Devices | 3.00 | 0 | -7.41% | -14.53% |
| INFU | InfuSystem | | Instruments | 7.62 | 0 | -6.16% | -27.70% |
| ANVS | Annovis Bio | | Biotechnology | 7.28 | 0 | -59.58% | -61.07% |
| ADXN | Addex | | Biotechnology | 7.54 | 0 | -53.17% | 23.81% |
| AUTL | Autolus | | Biotechnology | 3.80 | 0 | -5.00% | -40.99% |
| CABA | Cabaletta Bio | | Biotechnology | 10.48 | 0 | -4.81% | -53.83% |
| CYTK | Cytokinetics | | Biotechnology | 62.53 | 0 | -4.30% | -25.10% |
| MRKR | Marker | | Biotechnology | 4.12 | 0 | -4.08% | -25.18% |
| WRBY | Warby Parker | | Instruments | 12.47 | 0 | -3.48% | -11.59% |
| For chart view version of above stock list: Chart View ➞ 0 - 25 , 25 - 50 , 50 - 75 , 75 - 100 , 100 - 125 , 125 - 150 , 150 - 175 , 175 - 200 , 200 - 225 , 225 - 250 , 250 - 275 , 275 - 300 , 300 - 325 , 325 - 350 , 350 - 375 , 375 - 400 , 400 - 425 , 425 - 450 , 450 - 475 , 475 - 500 , 500 - 525 , 525 - 550 , 550 - 575 , 575 - 600 , 600 - 625 , 625 - 650 , 650 - 675 , 675 - 700 , 700 - 725 | ||
 | Click To Change The Sort Order: By Market Cap or Company Size Performance: Year-to-date, Week and Day |  |
|
Get the most comprehensive stock market coverage daily at 12Stocks.com ➞ Best Stocks Today ➞ Best Stocks Weekly ➞ Best Stocks Year-to-Date ➞ Best Stocks Trends ➞  Best Stocks Today 12Stocks.com Best Nasdaq Stocks ➞ Best S&P 500 Stocks ➞ Best Tech Stocks ➞ Best Biotech Stocks ➞ |
| Detailed Overview of Healthcare Stocks |
| Healthcare Technical Overview, Leaders & Laggards, Top Healthcare ETF Funds & Detailed Healthcare Stocks List, Charts, Trends & More |
| Healthcare Sector: Technical Analysis, Trends & YTD Performance | |
| Healthcare sector is composed of stocks
from pharmaceutical, biotech, diagnostics labs, insurance providers
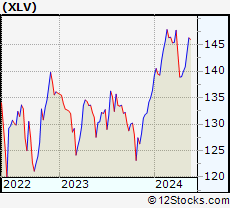
and healthcare services. Healthcare sector, as represented by XLV, an exchange-traded fund [ETF] that holds basket of Healthcare stocks (e.g, Merck, Amgen) is up by 2.97% and is currently underperforming the overall market by -3.59% year-to-date. Below is a quick view of Technical charts and trends: |
|
 XLV Weekly Chart |
|
| Long Term Trend: Good | |
| Medium Term Trend: Good | |
 XLV Daily Chart |
|
| Short Term Trend: Deteriorating | |
| Overall Trend Score: 60 | |
| YTD Performance: 2.97% | |
| **Trend Scores & Views Are Only For Educational Purposes And Not For Investing | |
| 12Stocks.com: Top Performing Healthcare Sector Stocks | ||||||||||||||||||||||||||||||||||||||||||||||||
 The top performing Healthcare sector stocks year to date are
Now, more recently, over last week, the top performing Healthcare sector stocks on the move are


|
||||||||||||||||||||||||||||||||||||||||||||||||
| 12Stocks.com: Investing in Healthcare Sector using Exchange Traded Funds | |
|
The following table shows list of key exchange traded funds (ETF) that
help investors track Healthcare Index. For detailed view, check out our ETF Funds section of our website. Quick View: Move mouse or cursor over ETF symbol (ticker) to view short-term Technical chart and over ETF name to view long term chart. Click on ticker or stock name for detailed view. Click on to add stock symbol to your watchlist and to view watchlist. |
12Stocks.com List of ETFs that track Healthcare Index
| Ticker | ETF Name | Watchlist | Recent Price | Smart Investing & Trading Score | Change % | Week % | Year-to-date % |
| XLV | Health Care | | 140.43 | 60 | 0.34 | 0.34 | 2.97% |
| XBI | Biotech | | 85.52 | 49 | 2.43 | 2.43 | -4.22% |
| IBB | Biotechnology | | 128.37 | 42 | 1.49 | 1.49 | -5.51% |
| BBH | Biotech | | 157.37 | 49 | 1.10 | 1.1 | -4.81% |
| VHT | Health Care | | 256.54 | 52 | 0.48 | 0.48 | 2.33% |
| IYH | Healthcare | | 58.86 | 70 | 0.43 | 0.43 | 2.82% |
| IHF | Healthcare Providers | | 52.06 | 65 | 0.27 | 0.27 | -0.86% |
| IHI | Medical Devices | | 55.83 | 37 | 0.54 | 0.54 | 3.45% |
| BIB | Biotechnology | | 51.77 | 64 | 4.25 | 4.25 | -9.26% |
| BIS | Short Biotech | | 19.55 | 44 | -3.31 | -3.31 | 8.19% |
| XHE | Health Care Equipment | | 83.17 | 35 | 0.90 | 0.9 | -1.29% |
| CURE | Healthcare Bull 3X | | 106.25 | 39 | 0.90 | 0.9 | 4.43% |
| LABU | Biotech Bull 3X | | 94.11 | 42 | 7.54 | 7.54 | -22.84% |
| LABD | Biotech Bear 3X | | 9.69 | 30 | -7.89 | -7.89 | 0% |
| PSCH | SmallCap Health Care | | 41.44 | 75 | 1.82 | 1.82 | -3.18% |
| XHS | Health Care Services | | 88.85 | 83 | 1.12 | 1.12 | -0.11% |
| PTH | DWA Healthcare Momentum | | 39.88 | 48 | -0.03 | -0.03 | 1.89% |
| BTEC | Principal Healthcare Innovators | | 34.84 | 42 | 1.72 | 1.72 | -4.1% |
| RXL | Health Care | | 94.16 | 32 | -0.70 | -0.7 | 3.02% |
| RXD | Short Health Care | | 11.40 | 49 | -0.44 | -0.44 | -4.4% |
| 12Stocks.com: Charts, Trends, Fundamental Data and Performances of Healthcare Stocks | |
|
We now take in-depth look at all Healthcare stocks including charts, multi-period performances and overall trends (as measured by Smart Investing & Trading Score). One can sort Healthcare stocks (click link to choose) by Daily, Weekly and by Year-to-Date performances. Also, one can sort by size of the company or by market capitalization. |
| Select Your Default Chart Type: | |||||
| |||||
| Click on stock symbol or name for detailed view. Click on to add stock symbol to your watchlist and to view watchlist. Quick View: Move mouse or cursor over "Daily" to quickly view daily Technical stock chart and over "Weekly" to view weekly Technical stock chart. | |||||

 | ACLX Arcellx, Inc. |
| Sector: Health Care | |
| SubSector: Biotechnology | |
| MarketCap: 1530 Millions | |
| Recent Price: 51.11 Smart Investing & Trading Score: 10 | |
| Day Percent Change: -1.47% Day Change: -0.76 | |
| Week Change: -1.47% Year-to-date Change: -8.4% | |
| ACLX Links: Profile News Message Board | |
| Charts:- Daily , Weekly | |
| Add ACLX to Watchlist: View: Get Complete ACLX Trend Analysis ➞ | |
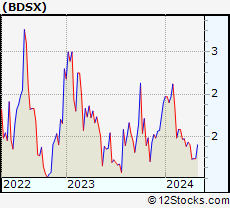 | BDSX Biodesix, Inc. |
| Sector: Health Care | |
| SubSector: Diagnostics & Research | |
| MarketCap: 41487 Millions | |
| Recent Price: 1.22 Smart Investing & Trading Score: 10 | |
| Day Percent Change: -1.21% Day Change: -0.02 | |
| Week Change: -1.21% Year-to-date Change: -35.8% | |
| BDSX Links: Profile News Message Board | |
| Charts:- Daily , Weekly | |
| Add BDSX to Watchlist: View: Get Complete BDSX Trend Analysis ➞ | |
 | NERV Minerva Neurosciences, Inc. |
| Sector: Health Care | |
| SubSector: Biotechnology | |
| MarketCap: 223.385 Millions | |
| Recent Price: 2.41 Smart Investing & Trading Score: 10 | |
| Day Percent Change: -1.11% Day Change: -0.03 | |
| Week Change: -1.11% Year-to-date Change: -60.8% | |
| NERV Links: Profile News Message Board | |
| Charts:- Daily , Weekly | |
| Add NERV to Watchlist: View: Get Complete NERV Trend Analysis ➞ | |
 | HUM Humana Inc. |
| Sector: Health Care | |
| SubSector: Health Care Plans | |
| MarketCap: 34125.6 Millions | |
| Recent Price: 303.15 Smart Investing & Trading Score: 10 | |
| Day Percent Change: -0.90% Day Change: -2.75 | |
| Week Change: -0.9% Year-to-date Change: -33.8% | |
| HUM Links: Profile News Message Board | |
| Charts:- Daily , Weekly | |
| Add HUM to Watchlist: View: Get Complete HUM Trend Analysis ➞ | |
 | FULC Fulcrum Therapeutics, Inc. |
| Sector: Health Care | |
| SubSector: Biotechnology | |
| MarketCap: 274.785 Millions | |
| Recent Price: 7.08 Smart Investing & Trading Score: 10 | |
| Day Percent Change: -0.84% Day Change: -0.06 | |
| Week Change: -0.84% Year-to-date Change: 4.9% | |
| FULC Links: Profile News Message Board | |
| Charts:- Daily , Weekly | |
| Add FULC to Watchlist: View: Get Complete FULC Trend Analysis ➞ | |
 | RCKT Rocket Pharmaceuticals, Inc. |
| Sector: Health Care | |
| SubSector: Biotechnology | |
| MarketCap: 899.585 Millions | |
| Recent Price: 21.85 Smart Investing & Trading Score: 10 | |
| Day Percent Change: -0.59% Day Change: -0.13 | |
| Week Change: -0.59% Year-to-date Change: -27.1% | |
| RCKT Links: Profile News Message Board | |
| Charts:- Daily , Weekly | |
| Add RCKT to Watchlist: View: Get Complete RCKT Trend Analysis ➞ | |
 | IVA Inventiva S.A. |
| Sector: Health Care | |
| SubSector: Biotechnology | |
| MarketCap: 46487 Millions | |
| Recent Price: 3.24 Smart Investing & Trading Score: 10 | |
| Day Percent Change: -0.31% Day Change: -0.01 | |
| Week Change: -0.31% Year-to-date Change: -28.2% | |
| IVA Links: Profile News Message Board | |
| Charts:- Daily , Weekly | |
| Add IVA to Watchlist: View: Get Complete IVA Trend Analysis ➞ | |
 | BMEA Biomea Fusion, Inc. |
| Sector: Health Care | |
| SubSector: Biotechnology | |
| MarketCap: 818 Millions | |
| Recent Price: 10.75 Smart Investing & Trading Score: 10 | |
| Day Percent Change: -0.19% Day Change: -0.02 | |
| Week Change: -0.19% Year-to-date Change: -26.6% | |
| BMEA Links: Profile News Message Board | |
| Charts:- Daily , Weekly | |
| Add BMEA to Watchlist: View: Get Complete BMEA Trend Analysis ➞ | |
 | OPTN OptiNose, Inc. |
| Sector: Health Care | |
| SubSector: Drugs - Generic | |
| MarketCap: 183.385 Millions | |
| Recent Price: 0.86 Smart Investing & Trading Score: 10 | |
| Day Percent Change: -0.14% Day Change: 0.00 | |
| Week Change: -0.14% Year-to-date Change: -33.4% | |
| OPTN Links: Profile News Message Board | |
| Charts:- Daily , Weekly | |
| Add OPTN to Watchlist: View: Get Complete OPTN Trend Analysis ➞ | |
 | ABBV AbbVie Inc. |
| Sector: Health Care | |
| SubSector: Drug Manufacturers - Major | |
| MarketCap: 110080 Millions | |
| Recent Price: 161.52 Smart Investing & Trading Score: 8 | |
| Day Percent Change: 1.19% Day Change: 1.90 | |
| Week Change: 1.19% Year-to-date Change: 4.2% | |
| ABBV Links: Profile News Message Board | |
| Charts:- Daily , Weekly | |
| Add ABBV to Watchlist: View: Get Complete ABBV Trend Analysis ➞ | |
 | BMRN BioMarin Pharmaceutical Inc. |
| Sector: Health Care | |
| SubSector: Biotechnology | |
| MarketCap: 14887.5 Millions | |
| Recent Price: 82.13 Smart Investing & Trading Score: 7 | |
| Day Percent Change: 1.51% Day Change: 1.22 | |
| Week Change: 1.51% Year-to-date Change: -14.8% | |
| BMRN Links: Profile News Message Board | |
| Charts:- Daily , Weekly | |
| Add BMRN to Watchlist: View: Get Complete BMRN Trend Analysis ➞ | |
 | USNA USANA Health Sciences, Inc. |
| Sector: Health Care | |
| SubSector: Drug Related Products | |
| MarketCap: 1185.13 Millions | |
| Recent Price: 42.98 Smart Investing & Trading Score: 7 | |
| Day Percent Change: -1.13% Day Change: -0.49 | |
| Week Change: -1.13% Year-to-date Change: -19.8% | |
| USNA Links: Profile News Message Board | |
| Charts:- Daily , Weekly | |
| Add USNA to Watchlist: View: Get Complete USNA Trend Analysis ➞ | |
 | SLN Silence Therapeutics plc |
| Sector: Health Care | |
| SubSector: Biotechnology | |
| MarketCap: 198 Millions | |
| Recent Price: 21.88 Smart Investing & Trading Score: 5 | |
| Day Percent Change: 1.27% Day Change: 0.27 | |
| Week Change: 1.27% Year-to-date Change: 24.6% | |
| SLN Links: Profile News Message Board | |
| Charts:- Daily , Weekly | |
| Add SLN to Watchlist: View: Get Complete SLN Trend Analysis ➞ | |
 | RLMD Relmada Therapeutics, Inc. |
| Sector: Health Care | |
| SubSector: Biotechnology | |
| MarketCap: 499.685 Millions | |
| Recent Price: 3.53 Smart Investing & Trading Score: 5 | |
| Day Percent Change: -7.83% Day Change: -0.30 | |
| Week Change: -7.83% Year-to-date Change: -14.7% | |
| RLMD Links: Profile News Message Board | |
| Charts:- Daily , Weekly | |
| Add RLMD to Watchlist: View: Get Complete RLMD Trend Analysis ➞ | |
 | CHE Chemed Corporation |
| Sector: Health Care | |
| SubSector: Home Health Care | |
| MarketCap: 6148.95 Millions | |
| Recent Price: 566.51 Smart Investing & Trading Score: 0 | |
| Day Percent Change: 1.09% Day Change: 6.09 | |
| Week Change: 1.09% Year-to-date Change: -3.1% | |
| CHE Links: Profile News Message Board | |
| Charts:- Daily , Weekly | |
| Add CHE to Watchlist: View: Get Complete CHE Trend Analysis ➞ | |
 | MOH Molina Healthcare, Inc. |
| Sector: Health Care | |
| SubSector: Health Care Plans | |
| MarketCap: 7235.6 Millions | |
| Recent Price: 343.89 Smart Investing & Trading Score: 0 | |
| Day Percent Change: 0.49% Day Change: 1.66 | |
| Week Change: 0.49% Year-to-date Change: -4.8% | |
| MOH Links: Profile News Message Board | |
| Charts:- Daily , Weekly | |
| Add MOH to Watchlist: View: Get Complete MOH Trend Analysis ➞ | |
 | LNSR LENSAR, Inc. |
| Sector: Health Care | |
| SubSector: Medical Devices | |
| MarketCap: 91487 Millions | |
| Recent Price: 3.00 Smart Investing & Trading Score: 0 | |
| Day Percent Change: -7.41% Day Change: -0.24 | |
| Week Change: -7.41% Year-to-date Change: -14.5% | |
| LNSR Links: Profile News Message Board | |
| Charts:- Daily , Weekly | |
| Add LNSR to Watchlist: View: Get Complete LNSR Trend Analysis ➞ | |
 | INFU InfuSystem Holdings Inc. |
| Sector: Health Care | |
| SubSector: Medical Instruments & Supplies | |
| MarketCap: 136.76 Millions | |
| Recent Price: 7.62 Smart Investing & Trading Score: 0 | |
| Day Percent Change: -6.16% Day Change: -0.50 | |
| Week Change: -6.16% Year-to-date Change: -27.7% | |
| INFU Links: Profile News Message Board | |
| Charts:- Daily , Weekly | |
| Add INFU to Watchlist: View: Get Complete INFU Trend Analysis ➞ | |
 | ANVS Annovis Bio, Inc. |
| Sector: Health Care | |
| SubSector: Biotechnology | |
| MarketCap: 41487 Millions | |
| Recent Price: 7.28 Smart Investing & Trading Score: 0 | |
| Day Percent Change: -59.58% Day Change: -10.73 | |
| Week Change: -59.58% Year-to-date Change: -61.1% | |
| ANVS Links: Profile News Message Board | |
| Charts:- Daily , Weekly | |
| Add ANVS to Watchlist: View: Get Complete ANVS Trend Analysis ➞ | |
 | ADXN Addex Therapeutics Ltd |
| Sector: Health Care | |
| SubSector: Biotechnology | |
| MarketCap: 51487 Millions | |
| Recent Price: 7.54 Smart Investing & Trading Score: 0 | |
| Day Percent Change: -53.17% Day Change: -8.56 | |
| Week Change: -53.17% Year-to-date Change: 23.8% | |
| ADXN Links: Profile News Message Board | |
| Charts:- Daily , Weekly | |
| Add ADXN to Watchlist: View: Get Complete ADXN Trend Analysis ➞ | |
 | AUTL Autolus Therapeutics plc |
| Sector: Health Care | |
| SubSector: Biotechnology | |
| MarketCap: 296.285 Millions | |
| Recent Price: 3.80 Smart Investing & Trading Score: 0 | |
| Day Percent Change: -5.00% Day Change: -0.20 | |
| Week Change: -5% Year-to-date Change: -41.0% | |
| AUTL Links: Profile News Message Board | |
| Charts:- Daily , Weekly | |
| Add AUTL to Watchlist: View: Get Complete AUTL Trend Analysis ➞ | |
 | CABA Cabaletta Bio, Inc. |
| Sector: Health Care | |
| SubSector: Biotechnology | |
| MarketCap: 222.085 Millions | |
| Recent Price: 10.48 Smart Investing & Trading Score: 0 | |
| Day Percent Change: -4.81% Day Change: -0.53 | |
| Week Change: -4.81% Year-to-date Change: -53.8% | |
| CABA Links: Profile News Message Board | |
| Charts:- Daily , Weekly | |
| Add CABA to Watchlist: View: Get Complete CABA Trend Analysis ➞ | |
 | CYTK Cytokinetics, Incorporated |
| Sector: Health Care | |
| SubSector: Biotechnology | |
| MarketCap: 654.285 Millions | |
| Recent Price: 62.53 Smart Investing & Trading Score: 0 | |
| Day Percent Change: -4.30% Day Change: -2.81 | |
| Week Change: -4.3% Year-to-date Change: -25.1% | |
| CYTK Links: Profile News Message Board | |
| Charts:- Daily , Weekly | |
| Add CYTK to Watchlist: View: Get Complete CYTK Trend Analysis ➞ | |
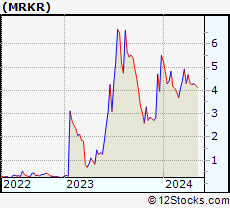 | MRKR Marker Therapeutics, Inc. |
| Sector: Health Care | |
| SubSector: Biotechnology | |
| MarketCap: 93.3785 Millions | |
| Recent Price: 4.12 Smart Investing & Trading Score: 0 | |
| Day Percent Change: -4.08% Day Change: -0.17 | |
| Week Change: -4.08% Year-to-date Change: -25.2% | |
| MRKR Links: Profile News Message Board | |
| Charts:- Daily , Weekly | |
| Add MRKR to Watchlist: View: Get Complete MRKR Trend Analysis ➞ | |
 | WRBY Warby Parker Inc. |
| Sector: Health Care | |
| SubSector: Medical Instruments & Supplies | |
| MarketCap: 1380 Millions | |
| Recent Price: 12.47 Smart Investing & Trading Score: 0 | |
| Day Percent Change: -3.48% Day Change: -0.45 | |
| Week Change: -3.48% Year-to-date Change: -11.6% | |
| WRBY Links: Profile News Message Board | |
| Charts:- Daily , Weekly | |
| Add WRBY to Watchlist: View: Get Complete WRBY Trend Analysis ➞ | |
| For tabular summary view of above stock list: Summary View ➞ 0 - 25 , 25 - 50 , 50 - 75 , 75 - 100 , 100 - 125 , 125 - 150 , 150 - 175 , 175 - 200 , 200 - 225 , 225 - 250 , 250 - 275 , 275 - 300 , 300 - 325 , 325 - 350 , 350 - 375 , 375 - 400 , 400 - 425 , 425 - 450 , 450 - 475 , 475 - 500 , 500 - 525 , 525 - 550 , 550 - 575 , 575 - 600 , 600 - 625 , 625 - 650 , 650 - 675 , 675 - 700 , 700 - 725 | ||
| Click To Change The Sort Order: By Market Cap or Company Size Performance: Year-to-date, Week and Day | |
| Select Chart Type: | ||
|
Best Stocks Today 12Stocks.com |
© 2024 12Stocks.com Terms & Conditions Privacy Contact Us
All Information Provided Only For Education And Not To Be Used For Investing or Trading. See Terms & Conditions


One More Thing ... Get Best Stocks Delivered Daily!
Never Ever Miss A Move With Our Top Ten Stocks Lists
Find Best Stocks In Any Market - Bull or Bear Market
Take A Peek At Our Top Ten Stocks Lists: Daily, Weekly, Year-to-Date & Top Trends
Find Best Stocks In Any Market - Bull or Bear Market
Take A Peek At Our Top Ten Stocks Lists: Daily, Weekly, Year-to-Date & Top Trends
Healthcare Stocks With Best Up Trends [0-bearish to 100-bullish]: Deciphera [100], Phibro Animal[100], Mesoblast [100], PTC [100], Day One[100], Agenus [100], Cullinan Oncology[100], TransMedics [100], Xencor [100], Zura Bio[100], Tandem Diabetes[100]
Best Healthcare Stocks Year-to-Date:
Pieris [6334.07%], Avenue [2707.45%], Precision BioSciences[2595.89%], Inovio [2154.9%], Assembly Biosciences[1472.98%], Agenus [1441.25%], NuCana [1252.27%], Aurora Cannabis[1227.17%], Adverum Biotechnologies[1165.94%], Affimed N.V[778.4%], CareMax [580.41%] Best Healthcare Stocks This Week:
Deciphera [72.56%], Phibro Animal[31.81%], Vaxxinity [31.65%], Acrivon [18.2%], Janux [18.18%], Ocean Bio[17.16%], MultiPlan [15.53%], Concord [15.22%], Ginkgo Bioworks[15.08%], Codexis [14.66%], Exscientia [14.5%] Best Healthcare Stocks Daily:
Deciphera [72.56%], Phibro Animal[31.81%], Vaxxinity [31.65%], Acrivon [18.20%], Janux [18.18%], Ocean Bio[17.16%], MultiPlan [15.53%], Concord [15.22%], Ginkgo Bioworks[15.08%], Codexis [14.66%], Exscientia [14.50%]