
 Login Sign Up


| |||||
 |  | ||||

| 12Stocks.com Market Intelligence |
Best Healthcare Stocks
 | "Discover best trending healthcare stocks with 12Stocks.com." |
| - Subu Vdaygiri, Founder, 12Stocks.com |
| In a hurry? Healthcare Stocks Lists: Performance Trends Table, Stock Charts
Sort Healthcare stocks: Daily, Weekly, Year-to-Date, Market Cap & Trends. Filter Healthcare stocks list by size:All Healthcare Large Mid-Range Small |
| 12Stocks.com Healthcare Stocks Performances & Trends Daily | |||||||||
|
|  The overall Smart Investing & Trading Score is 60 (0-bearish to 100-bullish) which puts Healthcare sector in short term neutral to bullish trend. The Smart Investing & Trading Score from previous trading session is 30 and an improvement of trend continues.
| ||||||||
Here are the Smart Investing & Trading Scores of the most requested Healthcare stocks at 12Stocks.com (click stock name for detailed review):
|


| 12Stocks.com: Investing in Healthcare sector with Stocks | |
|
The following table helps investors and traders sort through current performance and trends (as measured by Smart Investing & Trading Score) of various
stocks in the Healthcare sector. Quick View: Move mouse or cursor over stock symbol (ticker) to view short-term Technical chart and over stock name to view long term chart. Click on  to add stock symbol to your watchlist and to add stock symbol to your watchlist and  to view watchlist. Click on any ticker or stock name for detailed market intelligence report for that stock. to view watchlist. Click on any ticker or stock name for detailed market intelligence report for that stock. |
12Stocks.com Performance of Stocks in Healthcare Sector
| Ticker | Stock Name | Watchlist | Category | Recent Price | Smart Investing & Trading Score | Change % | YTD Change% |
| DCGO | DocGo |   | Medical Care Facilities | 3.38 | 32 | -6.63 | -39.53% |
| ACCD | Accolade | | Health Information | 7.63 | 0 | -6.84 | -36.52% |
| STOK | Stoke | | Biotechnology | 11.03 | 43 | -7.00 | 109.70% |
| MESO | Mesoblast | | Biotechnology | 6.60 | 78 | -7.04 | 500.00% |
| HRTX | Heron | | Biotechnology | 2.32 | 5 | -7.20 | 36.47% |
| ALGN | Align Technology | | Equipment | 282.38 | 31 | -7.36 | 3.06% |
| NVRO | Nevro | | Equipment | 10.58 | 5 | -7.36 | -50.84% |
| RFL | Rafael | | Biotechnology | 1.59 | 5 | -7.56 | -13.11% |
| AFIB | Acutus | | Medical Devices | 0.15 | 5 | -7.58 | -27.50% |
| APLS | Apellis | | Biotechnology | 44.19 | 0 | -7.63 | -26.18% |
| SCYX | SCYNEXIS | | Pharmaceutical | 1.69 | 62 | -7.65 | -24.22% |
| SCLX | Scilex Holding | | Drug Manufacturers - General | 0.85 | 28 | -7.84 | -56.64% |
| ZURA | Zura Bio | | Biotechnology | 4.27 | 88 | -7.97 | -8.86% |
| CYCN | Cyclerion | | Biotechnology | 2.83 | 15 | -8.12 | -15.52% |
| NEO | NeoGenomics | | Laboratories | 13.92 | 25 | -8.54 | -13.97% |
| EQ | Equillium | | Biotechnology | 1.49 | 31 | -8.59 | 104.11% |
| OVID | Ovid | | Biotechnology | 3.05 | 17 | -8.68 | -5.28% |
| CNTG | Centogene N.V | | Laboratories | 0.42 | 10 | -8.68 | -65.00% |
| ACRV | Acrivon | | Biotechnology | 9.09 | 65 | -9.10 | 82.90% |
| BYSI | BeyondSpring | | Biotechnology | 2.01 | 31 | -9.46 | 123.33% |
| GLMD | Galmed | | Biotechnology | 0.35 | 17 | -9.67 | -22.64% |
| BNR | Burning Rock | | Diagnostics & Research | 0.76 | 13 | -9.73 | -21.74% |
| DNA | Ginkgo Bioworks | | Biotechnology | 0.89 | 54 | -9.97 | -46.96% |
| AQST | Aquestive | | Biotechnology | 3.36 | 26 | -10.04 | 66.34% |
| PROK | ProKidney | | Biotechnology | 2.06 | 56 | -10.43 | 18.05% |
| For chart view version of above stock list: Chart View ➞ 0 - 25 , 25 - 50 , 50 - 75 , 75 - 100 , 100 - 125 , 125 - 150 , 150 - 175 , 175 - 200 , 200 - 225 , 225 - 250 , 250 - 275 , 275 - 300 , 300 - 325 , 325 - 350 , 350 - 375 , 375 - 400 , 400 - 425 , 425 - 450 , 450 - 475 , 475 - 500 , 500 - 525 , 525 - 550 , 550 - 575 , 575 - 600 , 600 - 625 , 625 - 650 , 650 - 675 , 675 - 700 , 700 - 725 | ||
 | Click To Change The Sort Order: By Market Cap or Company Size Performance: Year-to-date, Week and Day |  |
|
Get the most comprehensive stock market coverage daily at 12Stocks.com ➞ Best Stocks Today ➞ Best Stocks Weekly ➞ Best Stocks Year-to-Date ➞ Best Stocks Trends ➞  Best Stocks Today 12Stocks.com Best Nasdaq Stocks ➞ Best S&P 500 Stocks ➞ Best Tech Stocks ➞ Best Biotech Stocks ➞ |
| Detailed Overview of Healthcare Stocks |
| Healthcare Technical Overview, Leaders & Laggards, Top Healthcare ETF Funds & Detailed Healthcare Stocks List, Charts, Trends & More |
| Healthcare Sector: Technical Analysis, Trends & YTD Performance | |
| Healthcare sector is composed of stocks
from pharmaceutical, biotech, diagnostics labs, insurance providers
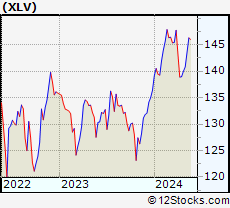
and healthcare services. Healthcare sector, as represented by XLV, an exchange-traded fund [ETF] that holds basket of Healthcare stocks (e.g, Merck, Amgen) is up by 2.9% and is currently underperforming the overall market by -1.9% year-to-date. Below is a quick view of Technical charts and trends: |
|
 XLV Weekly Chart |
|
| Long Term Trend: Not Good | |
| Medium Term Trend: Good | |
 XLV Daily Chart |
|
| Short Term Trend: Very Good | |
| Overall Trend Score: 60 | |
| YTD Performance: 2.9% | |
| **Trend Scores & Views Are Only For Educational Purposes And Not For Investing | |
| 12Stocks.com: Top Performing Healthcare Sector Stocks | ||||||||||||||||||||||||||||||||||||||||||||||||
 The top performing Healthcare sector stocks year to date are
Now, more recently, over last week, the top performing Healthcare sector stocks on the move are


|
||||||||||||||||||||||||||||||||||||||||||||||||
| 12Stocks.com: Investing in Healthcare Sector using Exchange Traded Funds | |
|
The following table shows list of key exchange traded funds (ETF) that
help investors track Healthcare Index. For detailed view, check out our ETF Funds section of our website. Quick View: Move mouse or cursor over ETF symbol (ticker) to view short-term Technical chart and over ETF name to view long term chart. Click on ticker or stock name for detailed view. Click on to add stock symbol to your watchlist and to view watchlist. |
12Stocks.com List of ETFs that track Healthcare Index
| Ticker | ETF Name | Watchlist | Recent Price | Smart Investing & Trading Score | Change % | Week % | Year-to-date % |
| XLV | Health Care | | 140.33 | 60 | -0.07 | 0.26 | 2.9% |
| XBI | Biotech | | 84.62 | 32 | -1.05 | 1.35 | -5.23% |
| IBB | Biotechnology | | 126.92 | 49 | -1.13 | 0.34 | -6.57% |
| BBH | Biotech | | 156.43 | 49 | -0.59 | 0.5 | -5.37% |
| VHT | Health Care | | 256.04 | 52 | -0.19 | 0.28 | 2.13% |
| IYH | Healthcare | | 58.83 | 52 | -0.05 | 0.38 | 2.76% |
| IHF | Healthcare Providers | | 51.84 | 53 | -0.42 | -0.15 | -1.28% |
| IHI | Medical Devices | | 55.01 | 13 | -1.47 | -0.94 | 1.93% |
| BIB | Biotechnology | | 50.35 | 42 | -2.74 | 1.39 | -11.74% |
| BIS | Short Biotech | | 19.84 | 63 | 1.48 | -1.88 | 9.8% |
| XHE | Health Care Equipment | | 82.11 | 28 | -1.27 | -0.39 | -2.55% |
| CURE | Healthcare Bull 3X | | 105.91 | 47 | -0.32 | 0.57 | 4.1% |
| LABU | Biotech Bull 3X | | 90.87 | 35 | -3.44 | 3.84 | -25.5% |
| LABD | Biotech Bear 3X | | 10.06 | 55 | 3.82 | -4.37 | 3.82% |
| PSCH | SmallCap Health Care | | 40.95 | 55 | -1.18 | 0.61 | -4.32% |
| XHS | Health Care Services | | 88.68 | 90 | -0.19 | 0.92 | -0.3% |
| PTH | DWA Healthcare Momentum | | 40.49 | 75 | 1.53 | 1.5 | 3.45% |
| BTEC | Principal Healthcare Innovators | | 34.65 | 32 | -0.55 | 1.17 | -4.62% |
| RXL | Health Care | | 95.00 | 47 | 0.89 | 0.18 | 3.93% |
| RXD | Short Health Care | | 11.36 | 30 | -0.35 | -0.79 | -4.74% |
| 12Stocks.com: Charts, Trends, Fundamental Data and Performances of Healthcare Stocks | |
|
We now take in-depth look at all Healthcare stocks including charts, multi-period performances and overall trends (as measured by Smart Investing & Trading Score). One can sort Healthcare stocks (click link to choose) by Daily, Weekly and by Year-to-Date performances. Also, one can sort by size of the company or by market capitalization. |
| Select Your Default Chart Type: | |||||
| |||||
| Click on stock symbol or name for detailed view. Click on to add stock symbol to your watchlist and to view watchlist. Quick View: Move mouse or cursor over "Daily" to quickly view daily Technical stock chart and over "Weekly" to view weekly Technical stock chart. | |||||

 | DCGO DocGo Inc. |
| Sector: Health Care | |
| SubSector: Medical Care Facilities | |
| MarketCap: 972 Millions | |
| Recent Price: 3.38 Smart Investing & Trading Score: 32 | |
| Day Percent Change: -6.63% Day Change: -0.24 | |
| Week Change: -6.37% Year-to-date Change: -39.5% | |
| DCGO Links: Profile News Message Board | |
| Charts:- Daily , Weekly | |
| Add DCGO to Watchlist: View: Get Complete DCGO Trend Analysis ➞ | |
 | ACCD Accolade, Inc. |
| Sector: Health Care | |
| SubSector: Health Information Services | |
| MarketCap: 32987 Millions | |
| Recent Price: 7.63 Smart Investing & Trading Score: 0 | |
| Day Percent Change: -6.84% Day Change: -0.56 | |
| Week Change: -3.3% Year-to-date Change: -36.5% | |
| ACCD Links: Profile News Message Board | |
| Charts:- Daily , Weekly | |
| Add ACCD to Watchlist: View: Get Complete ACCD Trend Analysis ➞ | |
 | STOK Stoke Therapeutics, Inc. |
| Sector: Health Care | |
| SubSector: Biotechnology | |
| MarketCap: 772.485 Millions | |
| Recent Price: 11.03 Smart Investing & Trading Score: 43 | |
| Day Percent Change: -7.00% Day Change: -0.83 | |
| Week Change: -11.12% Year-to-date Change: 109.7% | |
| STOK Links: Profile News Message Board | |
| Charts:- Daily , Weekly | |
| Add STOK to Watchlist: View: Get Complete STOK Trend Analysis ➞ | |
 | MESO Mesoblast Limited |
| Sector: Health Care | |
| SubSector: Biotechnology | |
| MarketCap: 471.385 Millions | |
| Recent Price: 6.60 Smart Investing & Trading Score: 78 | |
| Day Percent Change: -7.04% Day Change: -0.50 | |
| Week Change: 5.77% Year-to-date Change: 500.0% | |
| MESO Links: Profile News Message Board | |
| Charts:- Daily , Weekly | |
| Add MESO to Watchlist: View: Get Complete MESO Trend Analysis ➞ | |
 | HRTX Heron Therapeutics, Inc. |
| Sector: Health Care | |
| SubSector: Biotechnology | |
| MarketCap: 1172.75 Millions | |
| Recent Price: 2.32 Smart Investing & Trading Score: 5 | |
| Day Percent Change: -7.20% Day Change: -0.18 | |
| Week Change: -5.31% Year-to-date Change: 36.5% | |
| HRTX Links: Profile News Message Board | |
| Charts:- Daily , Weekly | |
| Add HRTX to Watchlist: View: Get Complete HRTX Trend Analysis ➞ | |
 | ALGN Align Technology, Inc. |
| Sector: Health Care | |
| SubSector: Medical Appliances & Equipment | |
| MarketCap: 12802 Millions | |
| Recent Price: 282.38 Smart Investing & Trading Score: 31 | |
| Day Percent Change: -7.36% Day Change: -22.44 | |
| Week Change: -8.62% Year-to-date Change: 3.1% | |
| ALGN Links: Profile News Message Board | |
| Charts:- Daily , Weekly | |
| Add ALGN to Watchlist: View: Get Complete ALGN Trend Analysis ➞ | |
 | NVRO Nevro Corp. |
| Sector: Health Care | |
| SubSector: Medical Appliances & Equipment | |
| MarketCap: 2489.3 Millions | |
| Recent Price: 10.58 Smart Investing & Trading Score: 5 | |
| Day Percent Change: -7.36% Day Change: -0.84 | |
| Week Change: -6.54% Year-to-date Change: -50.8% | |
| NVRO Links: Profile News Message Board | |
| Charts:- Daily , Weekly | |
| Add NVRO to Watchlist: View: Get Complete NVRO Trend Analysis ➞ | |
 | RFL Rafael Holdings, Inc. |
| Sector: Health Care | |
| SubSector: Biotechnology | |
| MarketCap: 203.685 Millions | |
| Recent Price: 1.59 Smart Investing & Trading Score: 5 | |
| Day Percent Change: -7.56% Day Change: -0.13 | |
| Week Change: -6.74% Year-to-date Change: -13.1% | |
| RFL Links: Profile News Message Board | |
| Charts:- Daily , Weekly | |
| Add RFL to Watchlist: View: Get Complete RFL Trend Analysis ➞ | |
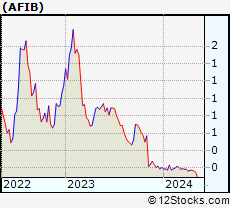 | AFIB Acutus Medical, Inc. |
| Sector: Health Care | |
| SubSector: Medical Devices | |
| MarketCap: 83487 Millions | |
| Recent Price: 0.15 Smart Investing & Trading Score: 5 | |
| Day Percent Change: -7.58% Day Change: -0.01 | |
| Week Change: -9.91% Year-to-date Change: -27.5% | |
| AFIB Links: Profile News Message Board | |
| Charts:- Daily , Weekly | |
| Add AFIB to Watchlist: View: Get Complete AFIB Trend Analysis ➞ | |
 | APLS Apellis Pharmaceuticals, Inc. |
| Sector: Health Care | |
| SubSector: Biotechnology | |
| MarketCap: 2030.95 Millions | |
| Recent Price: 44.19 Smart Investing & Trading Score: 0 | |
| Day Percent Change: -7.63% Day Change: -3.65 | |
| Week Change: -11.37% Year-to-date Change: -26.2% | |
| APLS Links: Profile News Message Board | |
| Charts:- Daily , Weekly | |
| Add APLS to Watchlist: View: Get Complete APLS Trend Analysis ➞ | |
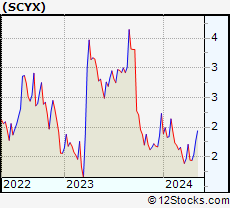 | SCYX SCYNEXIS, Inc. |
| Sector: Health Care | |
| SubSector: Drugs - Generic | |
| MarketCap: 77.4185 Millions | |
| Recent Price: 1.69 Smart Investing & Trading Score: 62 | |
| Day Percent Change: -7.65% Day Change: -0.14 | |
| Week Change: 9.74% Year-to-date Change: -24.2% | |
| SCYX Links: Profile News Message Board | |
| Charts:- Daily , Weekly | |
| Add SCYX to Watchlist: View: Get Complete SCYX Trend Analysis ➞ | |
 | SCLX Scilex Holding Company |
| Sector: Health Care | |
| SubSector: Drug Manufacturers - General | |
| MarketCap: 927 Millions | |
| Recent Price: 0.85 Smart Investing & Trading Score: 28 | |
| Day Percent Change: -7.84% Day Change: -0.07 | |
| Week Change: -4.84% Year-to-date Change: -56.6% | |
| SCLX Links: Profile News Message Board | |
| Charts:- Daily , Weekly | |
| Add SCLX to Watchlist: View: Get Complete SCLX Trend Analysis ➞ | |
 | ZURA Zura Bio Limited |
| Sector: Health Care | |
| SubSector: Biotechnology | |
| MarketCap: 242 Millions | |
| Recent Price: 4.27 Smart Investing & Trading Score: 88 | |
| Day Percent Change: -7.97% Day Change: -0.37 | |
| Week Change: -3.17% Year-to-date Change: -8.9% | |
| ZURA Links: Profile News Message Board | |
| Charts:- Daily , Weekly | |
| Add ZURA to Watchlist: View: Get Complete ZURA Trend Analysis ➞ | |
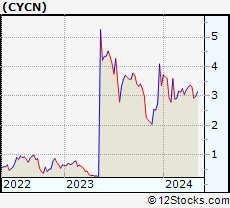 | CYCN Cyclerion Therapeutics, Inc. |
| Sector: Health Care | |
| SubSector: Biotechnology | |
| MarketCap: 83.8785 Millions | |
| Recent Price: 2.83 Smart Investing & Trading Score: 15 | |
| Day Percent Change: -8.12% Day Change: -0.25 | |
| Week Change: -3.41% Year-to-date Change: -15.5% | |
| CYCN Links: Profile News Message Board | |
| Charts:- Daily , Weekly | |
| Add CYCN to Watchlist: View: Get Complete CYCN Trend Analysis ➞ | |
 | NEO NeoGenomics, Inc. |
| Sector: Health Care | |
| SubSector: Medical Laboratories & Research | |
| MarketCap: 2763.8 Millions | |
| Recent Price: 13.92 Smart Investing & Trading Score: 25 | |
| Day Percent Change: -8.54% Day Change: -1.30 | |
| Week Change: -1.56% Year-to-date Change: -14.0% | |
| NEO Links: Profile News Message Board | |
| Charts:- Daily , Weekly | |
| Add NEO to Watchlist: View: Get Complete NEO Trend Analysis ➞ | |
 | EQ Equillium, Inc. |
| Sector: Health Care | |
| SubSector: Biotechnology | |
| MarketCap: 56.4785 Millions | |
| Recent Price: 1.49 Smart Investing & Trading Score: 31 | |
| Day Percent Change: -8.59% Day Change: -0.14 | |
| Week Change: -12.87% Year-to-date Change: 104.1% | |
| EQ Links: Profile News Message Board | |
| Charts:- Daily , Weekly | |
| Add EQ to Watchlist: View: Get Complete EQ Trend Analysis ➞ | |
 | OVID Ovid Therapeutics Inc. |
| Sector: Health Care | |
| SubSector: Biotechnology | |
| MarketCap: 130.385 Millions | |
| Recent Price: 3.05 Smart Investing & Trading Score: 17 | |
| Day Percent Change: -8.68% Day Change: -0.29 | |
| Week Change: -1.61% Year-to-date Change: -5.3% | |
| OVID Links: Profile News Message Board | |
| Charts:- Daily , Weekly | |
| Add OVID to Watchlist: View: Get Complete OVID Trend Analysis ➞ | |
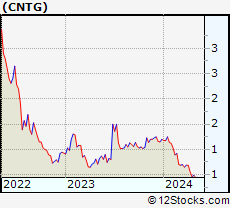 | CNTG Centogene N.V. |
| Sector: Health Care | |
| SubSector: Medical Laboratories & Research | |
| MarketCap: 455.8 Millions | |
| Recent Price: 0.42 Smart Investing & Trading Score: 10 | |
| Day Percent Change: -8.68% Day Change: -0.04 | |
| Week Change: -14.09% Year-to-date Change: -65.0% | |
| CNTG Links: Profile News Message Board | |
| Charts:- Daily , Weekly | |
| Add CNTG to Watchlist: View: Get Complete CNTG Trend Analysis ➞ | |
 | ACRV Acrivon Therapeutics, Inc. |
| Sector: Health Care | |
| SubSector: Biotechnology | |
| MarketCap: 286 Millions | |
| Recent Price: 9.09 Smart Investing & Trading Score: 65 | |
| Day Percent Change: -9.10% Day Change: -0.91 | |
| Week Change: 7.45% Year-to-date Change: 82.9% | |
| ACRV Links: Profile News Message Board | |
| Charts:- Daily , Weekly | |
| Add ACRV to Watchlist: View: Get Complete ACRV Trend Analysis ➞ | |
 | BYSI BeyondSpring Inc. |
| Sector: Health Care | |
| SubSector: Biotechnology | |
| MarketCap: 432.785 Millions | |
| Recent Price: 2.01 Smart Investing & Trading Score: 31 | |
| Day Percent Change: -9.46% Day Change: -0.21 | |
| Week Change: -5.63% Year-to-date Change: 123.3% | |
| BYSI Links: Profile News Message Board | |
| Charts:- Daily , Weekly | |
| Add BYSI to Watchlist: View: Get Complete BYSI Trend Analysis ➞ | |
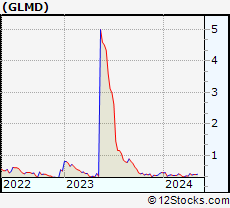 | GLMD Galmed Pharmaceuticals Ltd. |
| Sector: Health Care | |
| SubSector: Biotechnology | |
| MarketCap: 93.8785 Millions | |
| Recent Price: 0.35 Smart Investing & Trading Score: 17 | |
| Day Percent Change: -9.67% Day Change: -0.04 | |
| Week Change: -10.11% Year-to-date Change: -22.6% | |
| GLMD Links: Profile News Message Board | |
| Charts:- Daily , Weekly | |
| Add GLMD to Watchlist: View: Get Complete GLMD Trend Analysis ➞ | |
 | BNR Burning Rock Biotech Limited |
| Sector: Health Care | |
| SubSector: Diagnostics & Research | |
| MarketCap: 27887 Millions | |
| Recent Price: 0.76 Smart Investing & Trading Score: 13 | |
| Day Percent Change: -9.73% Day Change: -0.08 | |
| Week Change: -11.16% Year-to-date Change: -21.7% | |
| BNR Links: Profile News Message Board | |
| Charts:- Daily , Weekly | |
| Add BNR to Watchlist: View: Get Complete BNR Trend Analysis ➞ | |
 | DNA Ginkgo Bioworks Holdings, Inc. |
| Sector: Health Care | |
| SubSector: Biotechnology | |
| MarketCap: 3680 Millions | |
| Recent Price: 0.89 Smart Investing & Trading Score: 54 | |
| Day Percent Change: -9.97% Day Change: -0.10 | |
| Week Change: 3.6% Year-to-date Change: -47.0% | |
| DNA Links: Profile News Message Board | |
| Charts:- Daily , Weekly | |
| Add DNA to Watchlist: View: Get Complete DNA Trend Analysis ➞ | |
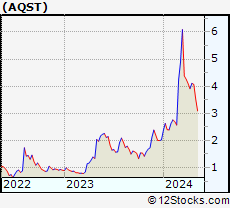 | AQST Aquestive Therapeutics, Inc. |
| Sector: Health Care | |
| SubSector: Biotechnology | |
| MarketCap: 94.2785 Millions | |
| Recent Price: 3.36 Smart Investing & Trading Score: 26 | |
| Day Percent Change: -10.04% Day Change: -0.38 | |
| Week Change: -17.44% Year-to-date Change: 66.3% | |
| AQST Links: Profile News Message Board | |
| Charts:- Daily , Weekly | |
| Add AQST to Watchlist: View: Get Complete AQST Trend Analysis ➞ | |
 | PROK ProKidney Corp. |
| Sector: Health Care | |
| SubSector: Biotechnology | |
| MarketCap: 2470 Millions | |
| Recent Price: 2.06 Smart Investing & Trading Score: 56 | |
| Day Percent Change: -10.43% Day Change: -0.24 | |
| Week Change: -2.6% Year-to-date Change: 18.1% | |
| PROK Links: Profile News Message Board | |
| Charts:- Daily , Weekly | |
| Add PROK to Watchlist: View: Get Complete PROK Trend Analysis ➞ | |
| For tabular summary view of above stock list: Summary View ➞ 0 - 25 , 25 - 50 , 50 - 75 , 75 - 100 , 100 - 125 , 125 - 150 , 150 - 175 , 175 - 200 , 200 - 225 , 225 - 250 , 250 - 275 , 275 - 300 , 300 - 325 , 325 - 350 , 350 - 375 , 375 - 400 , 400 - 425 , 425 - 450 , 450 - 475 , 475 - 500 , 500 - 525 , 525 - 550 , 550 - 575 , 575 - 600 , 600 - 625 , 625 - 650 , 650 - 675 , 675 - 700 , 700 - 725 | ||
| Click To Change The Sort Order: By Market Cap or Company Size Performance: Year-to-date, Week and Day | |
| Select Chart Type: | ||
|
Best Stocks Today 12Stocks.com |
© 2024 12Stocks.com Terms & Conditions Privacy Contact Us
All Information Provided Only For Education And Not To Be Used For Investing or Trading. See Terms & Conditions


One More Thing ... Get Best Stocks Delivered Daily!
Never Ever Miss A Move With Our Top Ten Stocks Lists
Find Best Stocks In Any Market - Bull or Bear Market
Take A Peek At Our Top Ten Stocks Lists: Daily, Weekly, Year-to-Date & Top Trends
Find Best Stocks In Any Market - Bull or Bear Market
Take A Peek At Our Top Ten Stocks Lists: Daily, Weekly, Year-to-Date & Top Trends
Healthcare Stocks With Best Up Trends [0-bearish to 100-bullish]: Canopy Growth[100], GeneDx [100], Aurora Cannabis[100], Bright Green[100], Concord [100], Cronos [100], AnaptysBio [100], Tenet [100], CareMax [100], Day One[100], Janux [100]
Best Healthcare Stocks Year-to-Date:
Pieris [6405.49%], Avenue [3011.8%], Precision BioSciences[2752.05%], Inovio [2145.1%], Aurora Cannabis[1838.26%], Assembly Biosciences[1420.55%], Agenus [1363.94%], Adverum Biotechnologies[1245.64%], NuCana [1238.74%], Affimed N.V[758.4%], CareMax [636.08%] Best Healthcare Stocks This Week:
Deciphera [72.49%], Canopy Growth[67%], GeneDx [54.06%], Concord [44.02%], Cue Biopharma[39.19%], Tilray [38.76%], Aurora Cannabis[37.76%], Phibro Animal[31.19%], Abeona [26.99%], Bright Green[25.7%], Exscientia [22.06%] Best Healthcare Stocks Daily:
Canopy Growth[78.85%], GeneDx [55.18%], Aurora Cannabis[46.04%], Tilray [38.76%], Cue Biopharma[33.80%], Bright Green[26.27%], Concord [25.00%], Abeona [20.35%], Cronos [15.29%], AnaptysBio [14.27%], OrganiGram [13.37%]