
 Login Sign Up


| |||||
 |  | ||||

| 12Stocks.com Market Intelligence |
Best Healthcare Stocks
 | "Discover best trending healthcare stocks with 12Stocks.com." |
| - Subu Vdaygiri, Founder, 12Stocks.com |
| In a hurry? Healthcare Stocks Lists: Performance Trends Table, Stock Charts
Sort Healthcare stocks: Daily, Weekly, Year-to-Date, Market Cap & Trends. Filter Healthcare stocks list by size:All Healthcare Large Mid-Range Small |
| 12Stocks.com Healthcare Stocks Performances & Trends Daily | |||||||||
|
|  The overall Smart Investing & Trading Score is 60 (0-bearish to 100-bullish) which puts Healthcare sector in short term neutral to bullish trend. The Smart Investing & Trading Score from previous trading session is 30 and an improvement of trend continues.
| ||||||||
Here are the Smart Investing & Trading Scores of the most requested Healthcare stocks at 12Stocks.com (click stock name for detailed review):
|


| 12Stocks.com: Investing in Healthcare sector with Stocks | |
|
The following table helps investors and traders sort through current performance and trends (as measured by Smart Investing & Trading Score) of various
stocks in the Healthcare sector. Quick View: Move mouse or cursor over stock symbol (ticker) to view short-term Technical chart and over stock name to view long term chart. Click on  to add stock symbol to your watchlist and to add stock symbol to your watchlist and  to view watchlist. Click on any ticker or stock name for detailed market intelligence report for that stock. to view watchlist. Click on any ticker or stock name for detailed market intelligence report for that stock. |
12Stocks.com Performance of Stocks in Healthcare Sector
| Ticker | Stock Name | Watchlist | Category | Recent Price | Smart Investing & Trading Score | Change % | YTD Change% |
| JAZZ | Jazz |   | Biotechnology | 110.76 | 57 | -0.41 | -9.95% |
| ADTX | ADiTx | | Biotechnology | 2.40 | 35 | -0.41 | -63.41% |
| TSHA | Taysha Gene | | Biotechnology | 2.44 | 58 | -0.41 | 37.08% |
| STE | STERIS | | Instruments | 204.56 | 50 | -0.42 | -6.95% |
| CGEM | Cullinan Oncology | | Biotechnology | 27.00 | 100 | -0.42 | 164.88% |
| PRGO | Perrigo | | Pharmaceutical | 32.66 | 100 | -0.46 | 1.49% |
| USPH | U.S. Physical | | Specialized | 101.51 | 61 | -0.46 | 8.99% |
| ALVR | AlloVir | | Biotechnology | 0.81 | 81 | -0.47 | 19.27% |
| AXNX | Axonics Modulation | | Equipment | 66.60 | 30 | -0.49 | 7.02% |
| SAVA | Cassava Sciences | | Biotechnology | 22.19 | 52 | -0.49 | -1.42% |
| HCA | HCA | | Hospitals | 309.82 | 43 | -0.51 | 14.46% |
| PAHC | Phibro Animal | | Specialized | 16.70 | 100 | -0.51 | 44.17% |
| CRNX | Crinetics | | Biotechnology | 43.77 | 56 | -0.51 | 23.03% |
| MOH | Molina | | Insurance | 342.10 | 0 | -0.52 | -5.32% |
| ANGO | AngioDynamics | | Instruments | 5.79 | 20 | -0.52 | -26.15% |
| PRLD | Prelude | | Biotechnology | 3.82 | 41 | -0.52 | -12.18% |
| EBS | Emergent Bio | | Biotechnology | 1.88 | 36 | -0.53 | -21.67% |
| TXMD | MD | | Pharmaceutical | 1.88 | 20 | -0.53 | -16.44% |
| TAK | Takeda | | Pharmaceutical | 13.08 | 28 | -0.53 | -8.34% |
| GBIO | Generation Bio | | Biotechnology | 2.84 | 46 | -0.53 | 71.82% |
| ABUS | Arbutus Biopharma | | Biotechnology | 2.77 | 75 | -0.54 | 10.60% |
| PETQ | PetIQ | | Pharmaceutical | 16.33 | 42 | -0.55 | -17.32% |
| XNCR | Xencor | | Biotechnology | 20.95 | 100 | -0.57 | -1.32% |
| XERS | Xeris | | Biotechnology | 1.74 | 20 | -0.57 | -26.11% |
| SOPH | SOPHiA GENETICS | | Health Information | 5.03 | 83 | -0.59 | 3.71% |
| For chart view version of above stock list: Chart View ➞ 0 - 25 , 25 - 50 , 50 - 75 , 75 - 100 , 100 - 125 , 125 - 150 , 150 - 175 , 175 - 200 , 200 - 225 , 225 - 250 , 250 - 275 , 275 - 300 , 300 - 325 , 325 - 350 , 350 - 375 , 375 - 400 , 400 - 425 , 425 - 450 , 450 - 475 , 475 - 500 , 500 - 525 , 525 - 550 , 550 - 575 , 575 - 600 , 600 - 625 , 625 - 650 , 650 - 675 , 675 - 700 , 700 - 725 | ||
 | Click To Change The Sort Order: By Market Cap or Company Size Performance: Year-to-date, Week and Day |  |
|
Get the most comprehensive stock market coverage daily at 12Stocks.com ➞ Best Stocks Today ➞ Best Stocks Weekly ➞ Best Stocks Year-to-Date ➞ Best Stocks Trends ➞  Best Stocks Today 12Stocks.com Best Nasdaq Stocks ➞ Best S&P 500 Stocks ➞ Best Tech Stocks ➞ Best Biotech Stocks ➞ |
| Detailed Overview of Healthcare Stocks |
| Healthcare Technical Overview, Leaders & Laggards, Top Healthcare ETF Funds & Detailed Healthcare Stocks List, Charts, Trends & More |
| Healthcare Sector: Technical Analysis, Trends & YTD Performance | |
| Healthcare sector is composed of stocks
from pharmaceutical, biotech, diagnostics labs, insurance providers
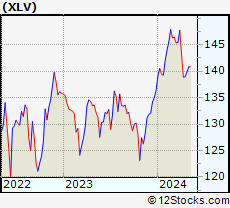
and healthcare services. Healthcare sector, as represented by XLV, an exchange-traded fund [ETF] that holds basket of Healthcare stocks (e.g, Merck, Amgen) is up by 2.9% and is currently underperforming the overall market by -1.9% year-to-date. Below is a quick view of Technical charts and trends: |
|
 XLV Weekly Chart |
|
| Long Term Trend: Good | |
| Medium Term Trend: Good | |
 XLV Daily Chart |
|
| Short Term Trend: Very Good | |
| Overall Trend Score: 60 | |
| YTD Performance: 2.9% | |
| **Trend Scores & Views Are Only For Educational Purposes And Not For Investing | |
| 12Stocks.com: Top Performing Healthcare Sector Stocks | ||||||||||||||||||||||||||||||||||||||||||||||||
 The top performing Healthcare sector stocks year to date are
Now, more recently, over last week, the top performing Healthcare sector stocks on the move are


|
||||||||||||||||||||||||||||||||||||||||||||||||
| 12Stocks.com: Investing in Healthcare Sector using Exchange Traded Funds | |
|
The following table shows list of key exchange traded funds (ETF) that
help investors track Healthcare Index. For detailed view, check out our ETF Funds section of our website. Quick View: Move mouse or cursor over ETF symbol (ticker) to view short-term Technical chart and over ETF name to view long term chart. Click on ticker or stock name for detailed view. Click on to add stock symbol to your watchlist and to view watchlist. |
12Stocks.com List of ETFs that track Healthcare Index
| Ticker | ETF Name | Watchlist | Recent Price | Smart Investing & Trading Score | Change % | Week % | Year-to-date % |
| XLV | Health Care | | 140.33 | 60 | -0.07 | 0.26 | 2.9% |
| XBI | Biotech | | 84.53 | 42 | -1.16 | 1.25 | -5.33% |
| IBB | Biotechnology | | 126.89 | 49 | -1.15 | 0.32 | -6.6% |
| BBH | Biotech | | 156.43 | 57 | -0.59 | 0.5 | -5.37% |
| VHT | Health Care | | 256.48 | 52 | -0.03 | 0.45 | 2.3% |
| IYH | Healthcare | | 58.84 | 70 | -0.04 | 0.38 | 2.77% |
| IHF | Healthcare Providers | | 51.84 | 53 | -0.42 | -0.15 | -1.28% |
| IHI | Medical Devices | | 55.03 | 30 | -1.43 | -0.9 | 1.96% |
| BIB | Biotechnology | | 50.54 | 42 | -2.38 | 1.77 | -11.41% |
| BIS | Short Biotech | | 19.54 | 44 | -0.05 | -3.36 | 8.14% |
| XHE | Health Care Equipment | | 82.11 | 28 | -1.27 | -0.39 | -2.55% |
| CURE | Healthcare Bull 3X | | 105.91 | 64 | -0.32 | 0.57 | 4.1% |
| LABU | Biotech Bull 3X | | 90.77 | 35 | -3.55 | 3.73 | -25.58% |
| LABD | Biotech Bear 3X | | 10.09 | 37 | 4.13 | -4.09 | 4.13% |
| PSCH | SmallCap Health Care | | 40.95 | 68 | -1.18 | 0.61 | -4.32% |
| XHS | Health Care Services | | 88.68 | 83 | -0.19 | 0.92 | -0.3% |
| PTH | DWA Healthcare Momentum | | 40.94 | 55 | 2.66 | 2.63 | 4.6% |
| BTEC | Principal Healthcare Innovators | | 35.10 | 49 | 0.75 | 2.48 | -3.39% |
| RXL | Health Care | | 95.00 | 54 | 0.89 | 0.18 | 3.93% |
| RXD | Short Health Care | | 11.36 | 30 | -0.35 | -0.79 | -4.74% |
| 12Stocks.com: Charts, Trends, Fundamental Data and Performances of Healthcare Stocks | |
|
We now take in-depth look at all Healthcare stocks including charts, multi-period performances and overall trends (as measured by Smart Investing & Trading Score). One can sort Healthcare stocks (click link to choose) by Daily, Weekly and by Year-to-Date performances. Also, one can sort by size of the company or by market capitalization. |
| Select Your Default Chart Type: | |||||
| |||||
| Click on stock symbol or name for detailed view. Click on to add stock symbol to your watchlist and to view watchlist. Quick View: Move mouse or cursor over "Daily" to quickly view daily Technical stock chart and over "Weekly" to view weekly Technical stock chart. | |||||

 | JAZZ Jazz Pharmaceuticals plc |
| Sector: Health Care | |
| SubSector: Biotechnology | |
| MarketCap: 5576.05 Millions | |
| Recent Price: 110.76 Smart Investing & Trading Score: 57 | |
| Day Percent Change: -0.41% Day Change: -0.46 | |
| Week Change: 1.19% Year-to-date Change: -10.0% | |
| JAZZ Links: Profile News Message Board | |
| Charts:- Daily , Weekly | |
| Add JAZZ to Watchlist: View: Get Complete JAZZ Trend Analysis ➞ | |
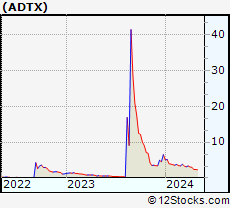 | ADTX ADiTx Therapeutics, Inc. |
| Sector: Health Care | |
| SubSector: Biotechnology | |
| MarketCap: 21487 Millions | |
| Recent Price: 2.40 Smart Investing & Trading Score: 35 | |
| Day Percent Change: -0.41% Day Change: -0.01 | |
| Week Change: 0.42% Year-to-date Change: -63.4% | |
| ADTX Links: Profile News Message Board | |
| Charts:- Daily , Weekly | |
| Add ADTX to Watchlist: View: Get Complete ADTX Trend Analysis ➞ | |
 | TSHA Taysha Gene Therapies, Inc. |
| Sector: Health Care | |
| SubSector: Biotechnology | |
| MarketCap: 76487 Millions | |
| Recent Price: 2.44 Smart Investing & Trading Score: 58 | |
| Day Percent Change: -0.41% Day Change: -0.01 | |
| Week Change: 2.09% Year-to-date Change: 37.1% | |
| TSHA Links: Profile News Message Board | |
| Charts:- Daily , Weekly | |
| Add TSHA to Watchlist: View: Get Complete TSHA Trend Analysis ➞ | |
 | STE STERIS plc |
| Sector: Health Care | |
| SubSector: Medical Instruments & Supplies | |
| MarketCap: 10875 Millions | |
| Recent Price: 204.56 Smart Investing & Trading Score: 50 | |
| Day Percent Change: -0.42% Day Change: -0.86 | |
| Week Change: 0.32% Year-to-date Change: -7.0% | |
| STE Links: Profile News Message Board | |
| Charts:- Daily , Weekly | |
| Add STE to Watchlist: View: Get Complete STE Trend Analysis ➞ | |
 | CGEM Cullinan Oncology, Inc. |
| Sector: Health Care | |
| SubSector: Biotechnology | |
| MarketCap: 433 Millions | |
| Recent Price: 27.00 Smart Investing & Trading Score: 100 | |
| Day Percent Change: -0.42% Day Change: -0.12 | |
| Week Change: 6.74% Year-to-date Change: 164.9% | |
| CGEM Links: Profile News Message Board | |
| Charts:- Daily , Weekly | |
| Add CGEM to Watchlist: View: Get Complete CGEM Trend Analysis ➞ | |
 | PRGO Perrigo Company plc |
| Sector: Health Care | |
| SubSector: Drug Related Products | |
| MarketCap: 6493.93 Millions | |
| Recent Price: 32.66 Smart Investing & Trading Score: 100 | |
| Day Percent Change: -0.46% Day Change: -0.15 | |
| Week Change: 2.25% Year-to-date Change: 1.5% | |
| PRGO Links: Profile News Message Board | |
| Charts:- Daily , Weekly | |
| Add PRGO to Watchlist: View: Get Complete PRGO Trend Analysis ➞ | |
 | USPH U.S. Physical Therapy, Inc. |
| Sector: Health Care | |
| SubSector: Specialized Health Services | |
| MarketCap: 793.556 Millions | |
| Recent Price: 101.51 Smart Investing & Trading Score: 61 | |
| Day Percent Change: -0.46% Day Change: -0.47 | |
| Week Change: 0.89% Year-to-date Change: 9.0% | |
| USPH Links: Profile News Message Board | |
| Charts:- Daily , Weekly | |
| Add USPH to Watchlist: View: Get Complete USPH Trend Analysis ➞ | |
 | ALVR AlloVir, Inc. |
| Sector: Health Care | |
| SubSector: Biotechnology | |
| MarketCap: 25787 Millions | |
| Recent Price: 0.81 Smart Investing & Trading Score: 81 | |
| Day Percent Change: -0.47% Day Change: 0.00 | |
| Week Change: 1.71% Year-to-date Change: 19.3% | |
| ALVR Links: Profile News Message Board | |
| Charts:- Daily , Weekly | |
| Add ALVR to Watchlist: View: Get Complete ALVR Trend Analysis ➞ | |
 | AXNX Axonics Modulation Technologies, Inc. |
| Sector: Health Care | |
| SubSector: Medical Appliances & Equipment | |
| MarketCap: 692.48 Millions | |
| Recent Price: 66.60 Smart Investing & Trading Score: 30 | |
| Day Percent Change: -0.49% Day Change: -0.33 | |
| Week Change: -0.13% Year-to-date Change: 7.0% | |
| AXNX Links: Profile News Message Board | |
| Charts:- Daily , Weekly | |
| Add AXNX to Watchlist: View: Get Complete AXNX Trend Analysis ➞ | |
 | SAVA Cassava Sciences, Inc. |
| Sector: Health Care | |
| SubSector: Biotechnology | |
| MarketCap: 86.6785 Millions | |
| Recent Price: 22.19 Smart Investing & Trading Score: 52 | |
| Day Percent Change: -0.49% Day Change: -0.11 | |
| Week Change: -0.67% Year-to-date Change: -1.4% | |
| SAVA Links: Profile News Message Board | |
| Charts:- Daily , Weekly | |
| Add SAVA to Watchlist: View: Get Complete SAVA Trend Analysis ➞ | |
 | HCA HCA Healthcare, Inc. |
| Sector: Health Care | |
| SubSector: Hospitals | |
| MarketCap: 29466.6 Millions | |
| Recent Price: 309.82 Smart Investing & Trading Score: 43 | |
| Day Percent Change: -0.51% Day Change: -1.60 | |
| Week Change: 1.02% Year-to-date Change: 14.5% | |
| HCA Links: Profile News Message Board | |
| Charts:- Daily , Weekly | |
| Add HCA to Watchlist: View: Get Complete HCA Trend Analysis ➞ | |
 | PAHC Phibro Animal Health Corporation |
| Sector: Health Care | |
| SubSector: Specialized Health Services | |
| MarketCap: 852.956 Millions | |
| Recent Price: 16.70 Smart Investing & Trading Score: 100 | |
| Day Percent Change: -0.51% Day Change: -0.09 | |
| Week Change: 31.15% Year-to-date Change: 44.2% | |
| PAHC Links: Profile News Message Board | |
| Charts:- Daily , Weekly | |
| Add PAHC to Watchlist: View: Get Complete PAHC Trend Analysis ➞ | |
 | CRNX Crinetics Pharmaceuticals, Inc. |
| Sector: Health Care | |
| SubSector: Biotechnology | |
| MarketCap: 381.085 Millions | |
| Recent Price: 43.77 Smart Investing & Trading Score: 56 | |
| Day Percent Change: -0.51% Day Change: -0.23 | |
| Week Change: 3.93% Year-to-date Change: 23.0% | |
| CRNX Links: Profile News Message Board | |
| Charts:- Daily , Weekly | |
| Add CRNX to Watchlist: View: Get Complete CRNX Trend Analysis ➞ | |
 | MOH Molina Healthcare, Inc. |
| Sector: Health Care | |
| SubSector: Health Care Plans | |
| MarketCap: 7235.6 Millions | |
| Recent Price: 342.10 Smart Investing & Trading Score: 0 | |
| Day Percent Change: -0.52% Day Change: -1.79 | |
| Week Change: -0.04% Year-to-date Change: -5.3% | |
| MOH Links: Profile News Message Board | |
| Charts:- Daily , Weekly | |
| Add MOH to Watchlist: View: Get Complete MOH Trend Analysis ➞ | |
 | ANGO AngioDynamics, Inc. |
| Sector: Health Care | |
| SubSector: Medical Instruments & Supplies | |
| MarketCap: 370.86 Millions | |
| Recent Price: 5.79 Smart Investing & Trading Score: 20 | |
| Day Percent Change: -0.52% Day Change: -0.03 | |
| Week Change: -0.34% Year-to-date Change: -26.2% | |
| ANGO Links: Profile News Message Board | |
| Charts:- Daily , Weekly | |
| Add ANGO to Watchlist: View: Get Complete ANGO Trend Analysis ➞ | |
 | PRLD Prelude Therapeutics Incorporated |
| Sector: Health Care | |
| SubSector: Biotechnology | |
| MarketCap: 26087 Millions | |
| Recent Price: 3.82 Smart Investing & Trading Score: 41 | |
| Day Percent Change: -0.52% Day Change: -0.02 | |
| Week Change: -6.14% Year-to-date Change: -12.2% | |
| PRLD Links: Profile News Message Board | |
| Charts:- Daily , Weekly | |
| Add PRLD to Watchlist: View: Get Complete PRLD Trend Analysis ➞ | |
 | EBS Emergent BioSolutions Inc. |
| Sector: Health Care | |
| SubSector: Biotechnology | |
| MarketCap: 2417.65 Millions | |
| Recent Price: 1.88 Smart Investing & Trading Score: 36 | |
| Day Percent Change: -0.53% Day Change: -0.01 | |
| Week Change: -2.08% Year-to-date Change: -21.7% | |
| EBS Links: Profile News Message Board | |
| Charts:- Daily , Weekly | |
| Add EBS to Watchlist: View: Get Complete EBS Trend Analysis ➞ | |
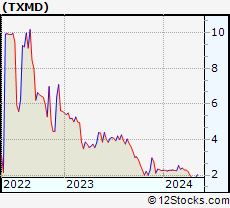 | TXMD TherapeuticsMD, Inc. |
| Sector: Health Care | |
| SubSector: Drug Manufacturers - Major | |
| MarketCap: 306.443 Millions | |
| Recent Price: 1.88 Smart Investing & Trading Score: 20 | |
| Day Percent Change: -0.53% Day Change: -0.01 | |
| Week Change: 1.08% Year-to-date Change: -16.4% | |
| TXMD Links: Profile News Message Board | |
| Charts:- Daily , Weekly | |
| Add TXMD to Watchlist: View: Get Complete TXMD Trend Analysis ➞ | |
 | TAK Takeda Pharmaceutical Company Limited |
| Sector: Health Care | |
| SubSector: Drugs - Generic | |
| MarketCap: 41342.5 Millions | |
| Recent Price: 13.08 Smart Investing & Trading Score: 28 | |
| Day Percent Change: -0.53% Day Change: -0.07 | |
| Week Change: 0.38% Year-to-date Change: -8.3% | |
| TAK Links: Profile News Message Board | |
| Charts:- Daily , Weekly | |
| Add TAK to Watchlist: View: Get Complete TAK Trend Analysis ➞ | |
 | GBIO Generation Bio Co. |
| Sector: Health Care | |
| SubSector: Biotechnology | |
| MarketCap: 17487 Millions | |
| Recent Price: 2.84 Smart Investing & Trading Score: 46 | |
| Day Percent Change: -0.53% Day Change: -0.02 | |
| Week Change: -2.24% Year-to-date Change: 71.8% | |
| GBIO Links: Profile News Message Board | |
| Charts:- Daily , Weekly | |
| Add GBIO to Watchlist: View: Get Complete GBIO Trend Analysis ➞ | |
 | ABUS Arbutus Biopharma Corporation |
| Sector: Health Care | |
| SubSector: Biotechnology | |
| MarketCap: 110.885 Millions | |
| Recent Price: 2.77 Smart Investing & Trading Score: 75 | |
| Day Percent Change: -0.54% Day Change: -0.01 | |
| Week Change: 1.28% Year-to-date Change: 10.6% | |
| ABUS Links: Profile News Message Board | |
| Charts:- Daily , Weekly | |
| Add ABUS to Watchlist: View: Get Complete ABUS Trend Analysis ➞ | |
 | PETQ PetIQ, Inc. |
| Sector: Health Care | |
| SubSector: Drugs - Generic | |
| MarketCap: 587.585 Millions | |
| Recent Price: 16.33 Smart Investing & Trading Score: 42 | |
| Day Percent Change: -0.55% Day Change: -0.09 | |
| Week Change: -1.21% Year-to-date Change: -17.3% | |
| PETQ Links: Profile News Message Board | |
| Charts:- Daily , Weekly | |
| Add PETQ to Watchlist: View: Get Complete PETQ Trend Analysis ➞ | |
 | XNCR Xencor, Inc. |
| Sector: Health Care | |
| SubSector: Biotechnology | |
| MarketCap: 1744.35 Millions | |
| Recent Price: 20.95 Smart Investing & Trading Score: 100 | |
| Day Percent Change: -0.57% Day Change: -0.12 | |
| Week Change: 4.85% Year-to-date Change: -1.3% | |
| XNCR Links: Profile News Message Board | |
| Charts:- Daily , Weekly | |
| Add XNCR to Watchlist: View: Get Complete XNCR Trend Analysis ➞ | |
 | XERS Xeris Pharmaceuticals, Inc. |
| Sector: Health Care | |
| SubSector: Biotechnology | |
| MarketCap: 74.5785 Millions | |
| Recent Price: 1.74 Smart Investing & Trading Score: 20 | |
| Day Percent Change: -0.57% Day Change: -0.01 | |
| Week Change: -0.57% Year-to-date Change: -26.1% | |
| XERS Links: Profile News Message Board | |
| Charts:- Daily , Weekly | |
| Add XERS to Watchlist: View: Get Complete XERS Trend Analysis ➞ | |
 | SOPH SOPHiA GENETICS SA |
| Sector: Health Care | |
| SubSector: Health Information Services | |
| MarketCap: 278 Millions | |
| Recent Price: 5.03 Smart Investing & Trading Score: 83 | |
| Day Percent Change: -0.59% Day Change: -0.03 | |
| Week Change: 0% Year-to-date Change: 3.7% | |
| SOPH Links: Profile News Message Board | |
| Charts:- Daily , Weekly | |
| Add SOPH to Watchlist: View: Get Complete SOPH Trend Analysis ➞ | |
| For tabular summary view of above stock list: Summary View ➞ 0 - 25 , 25 - 50 , 50 - 75 , 75 - 100 , 100 - 125 , 125 - 150 , 150 - 175 , 175 - 200 , 200 - 225 , 225 - 250 , 250 - 275 , 275 - 300 , 300 - 325 , 325 - 350 , 350 - 375 , 375 - 400 , 400 - 425 , 425 - 450 , 450 - 475 , 475 - 500 , 500 - 525 , 525 - 550 , 550 - 575 , 575 - 600 , 600 - 625 , 625 - 650 , 650 - 675 , 675 - 700 , 700 - 725 | ||
| Click To Change The Sort Order: By Market Cap or Company Size Performance: Year-to-date, Week and Day | |
| Select Chart Type: | ||
|
Best Stocks Today 12Stocks.com |
© 2024 12Stocks.com Terms & Conditions Privacy Contact Us
All Information Provided Only For Education And Not To Be Used For Investing or Trading. See Terms & Conditions


One More Thing ... Get Best Stocks Delivered Daily!
Never Ever Miss A Move With Our Top Ten Stocks Lists
Find Best Stocks In Any Market - Bull or Bear Market
Take A Peek At Our Top Ten Stocks Lists: Daily, Weekly, Year-to-Date & Top Trends
Find Best Stocks In Any Market - Bull or Bear Market
Take A Peek At Our Top Ten Stocks Lists: Daily, Weekly, Year-to-Date & Top Trends
Healthcare Stocks With Best Up Trends [0-bearish to 100-bullish]: Tenet [100], Day One[100], Tandem Diabetes[100], Fresenius [100], Haleon [100], DaVita [100], PTC [100], Cullinan Oncology[100], Perrigo [100], Phibro Animal[100], Xencor [100]
Best Healthcare Stocks Year-to-Date:
Pieris [6405.49%], Avenue [3033.54%], Precision BioSciences[2754.79%], Inovio [2147.06%], Aurora Cannabis[1844.56%], Assembly Biosciences[1400.43%], Agenus [1362.13%], Adverum Biotechnologies[1245.64%], NuCana [1201.56%], Affimed N.V[758.4%], CareMax [625.77%] Best Healthcare Stocks This Week:
Deciphera [72.49%], Canopy Growth[67%], GeneDx [54.42%], Cue Biopharma[39.19%], Tilray [39.04%], Aurora Cannabis[38.21%], Concord [37.24%], Phibro Animal[31.15%], Abeona [27.3%], Bright Green[25.75%], Exscientia [22.06%] Best Healthcare Stocks Daily:
Canopy Growth[78.85%], GeneDx [55.55%], Aurora Cannabis[46.52%], Tilray [39.04%], Cue Biopharma[33.80%], Bright Green[26.32%], Abeona [20.64%], Concord [19.12%], Cronos [15.29%], AnaptysBio [14.58%], OrganiGram [13.37%]