
 Login Sign Up


| |||||
 |  | ||||

| 12Stocks.com Market Intelligence |
Best Healthcare Stocks
 | "Discover best trending healthcare stocks with 12Stocks.com." |
| - Subu Vdaygiri, Founder, 12Stocks.com |
| In a hurry? Healthcare Stocks Lists: Performance Trends Table, Stock Charts
Sort Healthcare stocks: Daily, Weekly, Year-to-Date, Market Cap & Trends. Filter Healthcare stocks list by size:All Healthcare Large Mid-Range Small |
| 12Stocks.com Healthcare Stocks Performances & Trends Daily | |||||||||
|
|  The overall Smart Investing & Trading Score is 60 (0-bearish to 100-bullish) which puts Healthcare sector in short term neutral to bullish trend. The Smart Investing & Trading Score from previous trading session is 30 and an improvement of trend continues.
| ||||||||
Here are the Smart Investing & Trading Scores of the most requested Healthcare stocks at 12Stocks.com (click stock name for detailed review):
|


| 12Stocks.com: Investing in Healthcare sector with Stocks | |
|
The following table helps investors and traders sort through current performance and trends (as measured by Smart Investing & Trading Score) of various
stocks in the Healthcare sector. Quick View: Move mouse or cursor over stock symbol (ticker) to view short-term Technical chart and over stock name to view long term chart. Click on  to add stock symbol to your watchlist and to add stock symbol to your watchlist and  to view watchlist. Click on any ticker or stock name for detailed market intelligence report for that stock. to view watchlist. Click on any ticker or stock name for detailed market intelligence report for that stock. |
12Stocks.com Performance of Stocks in Healthcare Sector
| Ticker | Stock Name | Watchlist | Category | Recent Price | Smart Investing & Trading Score | Change % | YTD Change% |
| IMMP | Immutep |   | Biotechnology | 2.69 | 93 | 0.75 | 12.08% |
| TFFP | TFF | | Biotechnology | 2.73 | 17 | 0.74 | -61.11% |
| AIRS | AirSculpt Technologies | | Medical Care Facilities | 5.62 | 45 | 0.72 | -24.97% |
| GPCR | Structure | | Biotechnology | 39.32 | 57 | 0.72 | 3.27% |
| MRNS | Marinus | | Biotechnology | 1.41 | 24 | 0.71 | -87.03% |
| FULC | Fulcrum | | Biotechnology | 7.13 | 10 | 0.71 | 5.63% |
| HLN | Haleon | | Drug Manufacturers - Specialty & Generic | 8.53 | 90 | 0.71 | 3.65% |
| ABBV | AbbVie | | Pharmaceutical | 162.64 | 25 | 0.69 | 4.95% |
| NAMS | NewAmsterdam Pharma | | Biotechnology | 21.81 | 78 | 0.69 | 94.04% |
| OMER | Omeros | | Biotechnology | 3.15 | 32 | 0.64 | -3.67% |
| VYGR | Voyager | | Biotechnology | 7.82 | 58 | 0.64 | -7.35% |
| DVA | DaVita | | Specialized | 139.01 | 100 | 0.63 | 32.69% |
| ENLV | Enlivex | | Biotechnology | 1.67 | 47 | 0.60 | -38.15% |
| COLL | Collegium | | Pharmaceutical | 36.93 | 80 | 0.60 | 19.98% |
| BBIO | BridgeBio Pharma | | Biotechnology | 25.62 | 35 | 0.59 | -36.54% |
| CMRX | Chimerix | | Biotechnology | 0.94 | 49 | 0.58 | -2.34% |
| QURE | uniQure N.V | | Biotechnology | 4.42 | 20 | 0.57 | -34.79% |
| BTMD | biote | | Medical Care Facilities | 5.51 | 43 | 0.55 | 11.09% |
| ICUI | ICU | | Instruments | 97.92 | 69 | 0.53 | -1.82% |
| AZN | AstraZeneca | | Pharmaceutical | 75.88 | 88 | 0.53 | 12.67% |
| ALXO | ALX Oncology | | Biotechnology | 17.02 | 83 | 0.53 | 14.38% |
| SWTX | SpringWorks | | Biotechnology | 46.69 | 95 | 0.52 | 27.92% |
| ATAI | Atai Life | | Biotechnology | 1.98 | 43 | 0.51 | 40.43% |
| EOLS | Evolus | | Pharmaceutical | 11.77 | 25 | 0.51 | 11.78% |
| BDX | Becton Dickinson | | Instruments | 234.60 | 40 | 0.50 | -3.79% |
| For chart view version of above stock list: Chart View ➞ 0 - 25 , 25 - 50 , 50 - 75 , 75 - 100 , 100 - 125 , 125 - 150 , 150 - 175 , 175 - 200 , 200 - 225 , 225 - 250 , 250 - 275 , 275 - 300 , 300 - 325 , 325 - 350 , 350 - 375 , 375 - 400 , 400 - 425 , 425 - 450 , 450 - 475 , 475 - 500 , 500 - 525 , 525 - 550 , 550 - 575 , 575 - 600 , 600 - 625 , 625 - 650 , 650 - 675 , 675 - 700 , 700 - 725 | ||
 | Click To Change The Sort Order: By Market Cap or Company Size Performance: Year-to-date, Week and Day |  |
|
Get the most comprehensive stock market coverage daily at 12Stocks.com ➞ Best Stocks Today ➞ Best Stocks Weekly ➞ Best Stocks Year-to-Date ➞ Best Stocks Trends ➞  Best Stocks Today 12Stocks.com Best Nasdaq Stocks ➞ Best S&P 500 Stocks ➞ Best Tech Stocks ➞ Best Biotech Stocks ➞ |
| Detailed Overview of Healthcare Stocks |
| Healthcare Technical Overview, Leaders & Laggards, Top Healthcare ETF Funds & Detailed Healthcare Stocks List, Charts, Trends & More |
| Healthcare Sector: Technical Analysis, Trends & YTD Performance | |
| Healthcare sector is composed of stocks
from pharmaceutical, biotech, diagnostics labs, insurance providers
and healthcare services. Healthcare sector, as represented by XLV, an exchange-traded fund [ETF] that holds basket of Healthcare stocks (e.g, Merck, Amgen) is up by 2.9% and is currently underperforming the overall market by -1.9% year-to-date. Below is a quick view of Technical charts and trends: |
|
 XLV Weekly Chart |
|
| Long Term Trend: Not Good | |
| Medium Term Trend: Good | |
 XLV Daily Chart |
|
| Short Term Trend: Very Good | |
| Overall Trend Score: 60 | |
| YTD Performance: 2.9% | |
| **Trend Scores & Views Are Only For Educational Purposes And Not For Investing | |
| 12Stocks.com: Top Performing Healthcare Sector Stocks | ||||||||||||||||||||||||||||||||||||||||||||||||
 The top performing Healthcare sector stocks year to date are
Now, more recently, over last week, the top performing Healthcare sector stocks on the move are


|
||||||||||||||||||||||||||||||||||||||||||||||||
| 12Stocks.com: Investing in Healthcare Sector using Exchange Traded Funds | |
|
The following table shows list of key exchange traded funds (ETF) that
help investors track Healthcare Index. For detailed view, check out our ETF Funds section of our website. Quick View: Move mouse or cursor over ETF symbol (ticker) to view short-term Technical chart and over ETF name to view long term chart. Click on ticker or stock name for detailed view. Click on to add stock symbol to your watchlist and to view watchlist. |
12Stocks.com List of ETFs that track Healthcare Index
| Ticker | ETF Name | Watchlist | Recent Price | Smart Investing & Trading Score | Change % | Week % | Year-to-date % |
| XLV | Health Care | | 140.33 | 60 | -0.07 | 0.26 | 2.9% |
| XBI | Biotech | | 84.62 | 32 | -1.05 | 1.35 | -5.23% |
| IBB | Biotechnology | | 126.92 | 49 | -1.13 | 0.34 | -6.57% |
| BBH | Biotech | | 156.43 | 49 | -0.59 | 0.5 | -5.37% |
| VHT | Health Care | | 256.04 | 52 | -0.19 | 0.28 | 2.13% |
| IYH | Healthcare | | 58.83 | 52 | -0.05 | 0.38 | 2.76% |
| IHF | Healthcare Providers | | 51.84 | 53 | -0.42 | -0.15 | -1.28% |
| IHI | Medical Devices | | 55.01 | 13 | -1.47 | -0.94 | 1.93% |
| BIB | Biotechnology | | 50.35 | 42 | -2.74 | 1.39 | -11.74% |
| BIS | Short Biotech | | 19.84 | 63 | 1.48 | -1.88 | 9.8% |
| XHE | Health Care Equipment | | 82.11 | 28 | -1.27 | -0.39 | -2.55% |
| CURE | Healthcare Bull 3X | | 105.91 | 47 | -0.32 | 0.57 | 4.1% |
| LABU | Biotech Bull 3X | | 90.87 | 35 | -3.44 | 3.84 | -25.5% |
| LABD | Biotech Bear 3X | | 10.06 | 55 | 3.82 | -4.37 | 3.82% |
| PSCH | SmallCap Health Care | | 40.95 | 55 | -1.18 | 0.61 | -4.32% |
| XHS | Health Care Services | | 88.68 | 90 | -0.19 | 0.92 | -0.3% |
| PTH | DWA Healthcare Momentum | | 40.49 | 75 | 1.53 | 1.5 | 3.45% |
| BTEC | Principal Healthcare Innovators | | 34.65 | 32 | -0.55 | 1.17 | -4.62% |
| RXL | Health Care | | 95.00 | 47 | 0.89 | 0.18 | 3.93% |
| RXD | Short Health Care | | 11.36 | 30 | -0.35 | -0.79 | -4.74% |
| 12Stocks.com: Charts, Trends, Fundamental Data and Performances of Healthcare Stocks | |
|
We now take in-depth look at all Healthcare stocks including charts, multi-period performances and overall trends (as measured by Smart Investing & Trading Score). One can sort Healthcare stocks (click link to choose) by Daily, Weekly and by Year-to-Date performances. Also, one can sort by size of the company or by market capitalization. |
| Select Your Default Chart Type: | |||||
| |||||
| Click on stock symbol or name for detailed view. Click on to add stock symbol to your watchlist and to view watchlist. Quick View: Move mouse or cursor over "Daily" to quickly view daily Technical stock chart and over "Weekly" to view weekly Technical stock chart. | |||||

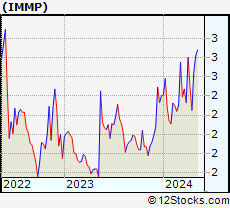 | IMMP Immutep Limited |
| Sector: Health Care | |
| SubSector: Biotechnology | |
| MarketCap: 71.5785 Millions | |
| Recent Price: 2.69 Smart Investing & Trading Score: 93 | |
| Day Percent Change: 0.75% Day Change: 0.02 | |
| Week Change: 1.51% Year-to-date Change: 12.1% | |
| IMMP Links: Profile News Message Board | |
| Charts:- Daily , Weekly | |
| Add IMMP to Watchlist: View: Get Complete IMMP Trend Analysis ➞ | |
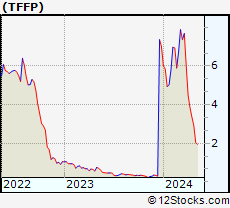 | TFFP TFF Pharmaceuticals, Inc. |
| Sector: Health Care | |
| SubSector: Biotechnology | |
| MarketCap: 80.0785 Millions | |
| Recent Price: 2.73 Smart Investing & Trading Score: 17 | |
| Day Percent Change: 0.74% Day Change: 0.02 | |
| Week Change: -6.54% Year-to-date Change: -61.1% | |
| TFFP Links: Profile News Message Board | |
| Charts:- Daily , Weekly | |
| Add TFFP to Watchlist: View: Get Complete TFFP Trend Analysis ➞ | |
 | AIRS AirSculpt Technologies, Inc. |
| Sector: Health Care | |
| SubSector: Medical Care Facilities | |
| MarketCap: 497 Millions | |
| Recent Price: 5.62 Smart Investing & Trading Score: 45 | |
| Day Percent Change: 0.72% Day Change: 0.04 | |
| Week Change: 0.18% Year-to-date Change: -25.0% | |
| AIRS Links: Profile News Message Board | |
| Charts:- Daily , Weekly | |
| Add AIRS to Watchlist: View: Get Complete AIRS Trend Analysis ➞ | |
 | GPCR Structure Therapeutics Inc. |
| Sector: Health Care | |
| SubSector: Biotechnology | |
| MarketCap: 1530 Millions | |
| Recent Price: 39.32 Smart Investing & Trading Score: 57 | |
| Day Percent Change: 0.72% Day Change: 0.28 | |
| Week Change: 1.07% Year-to-date Change: 3.3% | |
| GPCR Links: Profile News Message Board | |
| Charts:- Daily , Weekly | |
| Add GPCR to Watchlist: View: Get Complete GPCR Trend Analysis ➞ | |
 | MRNS Marinus Pharmaceuticals, Inc. |
| Sector: Health Care | |
| SubSector: Biotechnology | |
| MarketCap: 222.885 Millions | |
| Recent Price: 1.41 Smart Investing & Trading Score: 24 | |
| Day Percent Change: 0.71% Day Change: 0.01 | |
| Week Change: 0.36% Year-to-date Change: -87.0% | |
| MRNS Links: Profile News Message Board | |
| Charts:- Daily , Weekly | |
| Add MRNS to Watchlist: View: Get Complete MRNS Trend Analysis ➞ | |
 | FULC Fulcrum Therapeutics, Inc. |
| Sector: Health Care | |
| SubSector: Biotechnology | |
| MarketCap: 274.785 Millions | |
| Recent Price: 7.13 Smart Investing & Trading Score: 10 | |
| Day Percent Change: 0.71% Day Change: 0.05 | |
| Week Change: -0.14% Year-to-date Change: 5.6% | |
| FULC Links: Profile News Message Board | |
| Charts:- Daily , Weekly | |
| Add FULC to Watchlist: View: Get Complete FULC Trend Analysis ➞ | |
 | HLN Haleon plc |
| Sector: Health Care | |
| SubSector: Drug Manufacturers - Specialty & Generic | |
| MarketCap: 38310 Millions | |
| Recent Price: 8.53 Smart Investing & Trading Score: 90 | |
| Day Percent Change: 0.71% Day Change: 0.06 | |
| Week Change: 0.95% Year-to-date Change: 3.7% | |
| HLN Links: Profile News Message Board | |
| Charts:- Daily , Weekly | |
| Add HLN to Watchlist: View: Get Complete HLN Trend Analysis ➞ | |
 | ABBV AbbVie Inc. |
| Sector: Health Care | |
| SubSector: Drug Manufacturers - Major | |
| MarketCap: 110080 Millions | |
| Recent Price: 162.64 Smart Investing & Trading Score: 25 | |
| Day Percent Change: 0.69% Day Change: 1.12 | |
| Week Change: 1.89% Year-to-date Change: 5.0% | |
| ABBV Links: Profile News Message Board | |
| Charts:- Daily , Weekly | |
| Add ABBV to Watchlist: View: Get Complete ABBV Trend Analysis ➞ | |
 | NAMS NewAmsterdam Pharma Company N.V. |
| Sector: Health Care | |
| SubSector: Biotechnology | |
| MarketCap: 979 Millions | |
| Recent Price: 21.81 Smart Investing & Trading Score: 78 | |
| Day Percent Change: 0.69% Day Change: 0.15 | |
| Week Change: -0.64% Year-to-date Change: 94.0% | |
| NAMS Links: Profile News Message Board | |
| Charts:- Daily , Weekly | |
| Add NAMS to Watchlist: View: Get Complete NAMS Trend Analysis ➞ | |
 | OMER Omeros Corporation |
| Sector: Health Care | |
| SubSector: Biotechnology | |
| MarketCap: 759.585 Millions | |
| Recent Price: 3.15 Smart Investing & Trading Score: 32 | |
| Day Percent Change: 0.64% Day Change: 0.02 | |
| Week Change: 0% Year-to-date Change: -3.7% | |
| OMER Links: Profile News Message Board | |
| Charts:- Daily , Weekly | |
| Add OMER to Watchlist: View: Get Complete OMER Trend Analysis ➞ | |
 | VYGR Voyager Therapeutics, Inc. |
| Sector: Health Care | |
| SubSector: Biotechnology | |
| MarketCap: 321.085 Millions | |
| Recent Price: 7.82 Smart Investing & Trading Score: 58 | |
| Day Percent Change: 0.64% Day Change: 0.05 | |
| Week Change: 2.62% Year-to-date Change: -7.4% | |
| VYGR Links: Profile News Message Board | |
| Charts:- Daily , Weekly | |
| Add VYGR to Watchlist: View: Get Complete VYGR Trend Analysis ➞ | |
 | DVA DaVita Inc. |
| Sector: Health Care | |
| SubSector: Specialized Health Services | |
| MarketCap: 8954.36 Millions | |
| Recent Price: 139.01 Smart Investing & Trading Score: 100 | |
| Day Percent Change: 0.63% Day Change: 0.87 | |
| Week Change: 4.12% Year-to-date Change: 32.7% | |
| DVA Links: Profile News Message Board | |
| Charts:- Daily , Weekly | |
| Add DVA to Watchlist: View: Get Complete DVA Trend Analysis ➞ | |
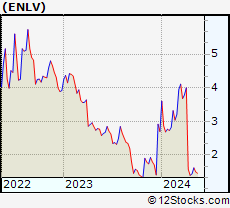 | ENLV Enlivex Therapeutics Ltd. |
| Sector: Health Care | |
| SubSector: Biotechnology | |
| MarketCap: 50.7785 Millions | |
| Recent Price: 1.67 Smart Investing & Trading Score: 47 | |
| Day Percent Change: 0.60% Day Change: 0.01 | |
| Week Change: 15.97% Year-to-date Change: -38.2% | |
| ENLV Links: Profile News Message Board | |
| Charts:- Daily , Weekly | |
| Add ENLV to Watchlist: View: Get Complete ENLV Trend Analysis ➞ | |
 | COLL Collegium Pharmaceutical, Inc. |
| Sector: Health Care | |
| SubSector: Drugs - Generic | |
| MarketCap: 569.185 Millions | |
| Recent Price: 36.93 Smart Investing & Trading Score: 80 | |
| Day Percent Change: 0.60% Day Change: 0.22 | |
| Week Change: 1.4% Year-to-date Change: 20.0% | |
| COLL Links: Profile News Message Board | |
| Charts:- Daily , Weekly | |
| Add COLL to Watchlist: View: Get Complete COLL Trend Analysis ➞ | |
 | BBIO BridgeBio Pharma, Inc. |
| Sector: Health Care | |
| SubSector: Biotechnology | |
| MarketCap: 3879.35 Millions | |
| Recent Price: 25.62 Smart Investing & Trading Score: 35 | |
| Day Percent Change: 0.59% Day Change: 0.15 | |
| Week Change: 2.97% Year-to-date Change: -36.5% | |
| BBIO Links: Profile News Message Board | |
| Charts:- Daily , Weekly | |
| Add BBIO to Watchlist: View: Get Complete BBIO Trend Analysis ➞ | |
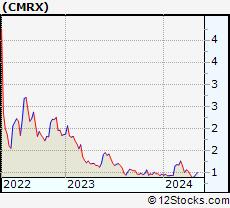 | CMRX Chimerix, Inc. |
| Sector: Health Care | |
| SubSector: Biotechnology | |
| MarketCap: 81.3785 Millions | |
| Recent Price: 0.94 Smart Investing & Trading Score: 49 | |
| Day Percent Change: 0.58% Day Change: 0.01 | |
| Week Change: 4.46% Year-to-date Change: -2.3% | |
| CMRX Links: Profile News Message Board | |
| Charts:- Daily , Weekly | |
| Add CMRX to Watchlist: View: Get Complete CMRX Trend Analysis ➞ | |
 | QURE uniQure N.V. |
| Sector: Health Care | |
| SubSector: Biotechnology | |
| MarketCap: 2267.25 Millions | |
| Recent Price: 4.42 Smart Investing & Trading Score: 20 | |
| Day Percent Change: 0.57% Day Change: 0.03 | |
| Week Change: -2.54% Year-to-date Change: -34.8% | |
| QURE Links: Profile News Message Board | |
| Charts:- Daily , Weekly | |
| Add QURE to Watchlist: View: Get Complete QURE Trend Analysis ➞ | |
 | BTMD biote Corp. |
| Sector: Health Care | |
| SubSector: Medical Care Facilities | |
| MarketCap: 468 Millions | |
| Recent Price: 5.51 Smart Investing & Trading Score: 43 | |
| Day Percent Change: 0.55% Day Change: 0.03 | |
| Week Change: -0.18% Year-to-date Change: 11.1% | |
| BTMD Links: Profile News Message Board | |
| Charts:- Daily , Weekly | |
| Add BTMD to Watchlist: View: Get Complete BTMD Trend Analysis ➞ | |
 | ICUI ICU Medical, Inc. |
| Sector: Health Care | |
| SubSector: Medical Instruments & Supplies | |
| MarketCap: 3640.7 Millions | |
| Recent Price: 97.92 Smart Investing & Trading Score: 69 | |
| Day Percent Change: 0.53% Day Change: 0.52 | |
| Week Change: 3.25% Year-to-date Change: -1.8% | |
| ICUI Links: Profile News Message Board | |
| Charts:- Daily , Weekly | |
| Add ICUI to Watchlist: View: Get Complete ICUI Trend Analysis ➞ | |
 | AZN AstraZeneca PLC |
| Sector: Health Care | |
| SubSector: Drug Manufacturers - Major | |
| MarketCap: 113154 Millions | |
| Recent Price: 75.88 Smart Investing & Trading Score: 88 | |
| Day Percent Change: 0.53% Day Change: 0.40 | |
| Week Change: 0.94% Year-to-date Change: 12.7% | |
| AZN Links: Profile News Message Board | |
| Charts:- Daily , Weekly | |
| Add AZN to Watchlist: View: Get Complete AZN Trend Analysis ➞ | |
 | ALXO ALX Oncology Holdings Inc. |
| Sector: Health Care | |
| SubSector: Biotechnology | |
| MarketCap: 41787 Millions | |
| Recent Price: 17.02 Smart Investing & Trading Score: 83 | |
| Day Percent Change: 0.53% Day Change: 0.09 | |
| Week Change: 0.95% Year-to-date Change: 14.4% | |
| ALXO Links: Profile News Message Board | |
| Charts:- Daily , Weekly | |
| Add ALXO to Watchlist: View: Get Complete ALXO Trend Analysis ➞ | |
 | SWTX SpringWorks Therapeutics, Inc. |
| Sector: Health Care | |
| SubSector: Biotechnology | |
| MarketCap: 1311.85 Millions | |
| Recent Price: 46.69 Smart Investing & Trading Score: 95 | |
| Day Percent Change: 0.52% Day Change: 0.24 | |
| Week Change: 2.55% Year-to-date Change: 27.9% | |
| SWTX Links: Profile News Message Board | |
| Charts:- Daily , Weekly | |
| Add SWTX to Watchlist: View: Get Complete SWTX Trend Analysis ➞ | |
 | ATAI Atai Life Sciences N.V. |
| Sector: Health Care | |
| SubSector: Biotechnology | |
| MarketCap: 287 Millions | |
| Recent Price: 1.98 Smart Investing & Trading Score: 43 | |
| Day Percent Change: 0.51% Day Change: 0.01 | |
| Week Change: 2.59% Year-to-date Change: 40.4% | |
| ATAI Links: Profile News Message Board | |
| Charts:- Daily , Weekly | |
| Add ATAI to Watchlist: View: Get Complete ATAI Trend Analysis ➞ | |
 | EOLS Evolus, Inc. |
| Sector: Health Care | |
| SubSector: Drugs - Generic | |
| MarketCap: 145.885 Millions | |
| Recent Price: 11.77 Smart Investing & Trading Score: 25 | |
| Day Percent Change: 0.51% Day Change: 0.06 | |
| Week Change: 2.97% Year-to-date Change: 11.8% | |
| EOLS Links: Profile News Message Board | |
| Charts:- Daily , Weekly | |
| Add EOLS to Watchlist: View: Get Complete EOLS Trend Analysis ➞ | |
 | BDX Becton, Dickinson and Company |
| Sector: Health Care | |
| SubSector: Medical Instruments & Supplies | |
| MarketCap: 62758.4 Millions | |
| Recent Price: 234.60 Smart Investing & Trading Score: 40 | |
| Day Percent Change: 0.50% Day Change: 1.16 | |
| Week Change: 1.32% Year-to-date Change: -3.8% | |
| BDX Links: Profile News Message Board | |
| Charts:- Daily , Weekly | |
| Add BDX to Watchlist: View: Get Complete BDX Trend Analysis ➞ | |
| For tabular summary view of above stock list: Summary View ➞ 0 - 25 , 25 - 50 , 50 - 75 , 75 - 100 , 100 - 125 , 125 - 150 , 150 - 175 , 175 - 200 , 200 - 225 , 225 - 250 , 250 - 275 , 275 - 300 , 300 - 325 , 325 - 350 , 350 - 375 , 375 - 400 , 400 - 425 , 425 - 450 , 450 - 475 , 475 - 500 , 500 - 525 , 525 - 550 , 550 - 575 , 575 - 600 , 600 - 625 , 625 - 650 , 650 - 675 , 675 - 700 , 700 - 725 | ||
| Click To Change The Sort Order: By Market Cap or Company Size Performance: Year-to-date, Week and Day | |
| Select Chart Type: | ||
|
Best Stocks Today 12Stocks.com |
© 2024 12Stocks.com Terms & Conditions Privacy Contact Us
All Information Provided Only For Education And Not To Be Used For Investing or Trading. See Terms & Conditions


One More Thing ... Get Best Stocks Delivered Daily!
Never Ever Miss A Move With Our Top Ten Stocks Lists
Find Best Stocks In Any Market - Bull or Bear Market
Take A Peek At Our Top Ten Stocks Lists: Daily, Weekly, Year-to-Date & Top Trends
Find Best Stocks In Any Market - Bull or Bear Market
Take A Peek At Our Top Ten Stocks Lists: Daily, Weekly, Year-to-Date & Top Trends
Healthcare Stocks With Best Up Trends [0-bearish to 100-bullish]: Canopy Growth[100], GeneDx [100], Aurora Cannabis[100], Bright Green[100], Concord [100], Cronos [100], AnaptysBio [100], Tenet [100], CareMax [100], Day One[100], Janux [100]
Best Healthcare Stocks Year-to-Date:
Pieris [6405.49%], Avenue [3011.8%], Precision BioSciences[2752.05%], Inovio [2145.1%], Aurora Cannabis[1838.26%], Assembly Biosciences[1420.55%], Agenus [1363.94%], Adverum Biotechnologies[1245.64%], NuCana [1238.74%], Affimed N.V[758.4%], CareMax [636.08%] Best Healthcare Stocks This Week:
Deciphera [72.49%], Canopy Growth[67%], GeneDx [54.06%], Concord [44.02%], Cue Biopharma[39.19%], Tilray [38.76%], Aurora Cannabis[37.76%], Phibro Animal[31.19%], Abeona [26.99%], Bright Green[25.7%], Exscientia [22.06%] Best Healthcare Stocks Daily:
Canopy Growth[78.85%], GeneDx [55.18%], Aurora Cannabis[46.04%], Tilray [38.76%], Cue Biopharma[33.80%], Bright Green[26.27%], Concord [25.00%], Abeona [20.35%], Cronos [15.29%], AnaptysBio [14.27%], OrganiGram [13.37%]