
 Login Sign Up


| |||||
 |  | ||||

| 12Stocks.com Market Intelligence |
Best Healthcare Stocks
 | "Discover best trending healthcare stocks with 12Stocks.com." |
| - Subu Vdaygiri, Founder, 12Stocks.com |
| In a hurry? Healthcare Stocks Lists: Performance Trends Table, Stock Charts
Sort Healthcare stocks: Daily, Weekly, Year-to-Date, Market Cap & Trends. Filter Healthcare stocks list by size:All Healthcare Large Mid-Range Small |
| 12Stocks.com Healthcare Stocks Performances & Trends Daily | |||||||||
|
|  The overall Smart Investing & Trading Score is 60 (0-bearish to 100-bullish) which puts Healthcare sector in short term neutral to bullish trend. The Smart Investing & Trading Score from previous trading session is 30 and an improvement of trend continues.
| ||||||||
Here are the Smart Investing & Trading Scores of the most requested Healthcare stocks at 12Stocks.com (click stock name for detailed review):
|


| 12Stocks.com: Investing in Healthcare sector with Stocks | |
|
The following table helps investors and traders sort through current performance and trends (as measured by Smart Investing & Trading Score) of various
stocks in the Healthcare sector. Quick View: Move mouse or cursor over stock symbol (ticker) to view short-term Technical chart and over stock name to view long term chart. Click on  to add stock symbol to your watchlist and to add stock symbol to your watchlist and  to view watchlist. Click on any ticker or stock name for detailed market intelligence report for that stock. to view watchlist. Click on any ticker or stock name for detailed market intelligence report for that stock. |
12Stocks.com Performance of Stocks in Healthcare Sector
| Ticker | Stock Name | Watchlist | Category | Recent Price | Smart Investing & Trading Score | Change % | YTD Change% |
| ETNB | 89bio |   | Biotechnology | 8.51 | 25 | -0.23 | -23.81% |
| INZY | Inozyme Pharma | | Biotechnology | 4.41 | 17 | -0.23 | 3.64% |
| IART | Integra LifeSciences | | Instruments | 29.17 | 35 | -0.24 | -33.02% |
| SDGR | Schrodinger | | Health Information | 24.38 | 35 | -0.25 | -31.90% |
| MGNX | MacroGenics | | Biotechnology | 14.78 | 41 | -0.27 | 53.64% |
| AVIR | Atea | | Biotechnology | 3.70 | 40 | -0.27 | 21.31% |
| FBIOP | Fortress Biotech | | Biotechnology | 14.77 | 61 | -0.27 | 24.43% |
| SPRB | Spruce Biosciences | | Biotechnology | 0.71 | 30 | -0.27 | -75.75% |
| ENSG | Ensign | | Long-Term | 118.36 | 68 | -0.28 | 5.48% |
| BMEA | Biomea Fusion | | Biotechnology | 10.72 | 10 | -0.28 | -26.78% |
| ZTS | Zoetis | | Pharmaceutical | 159.24 | 64 | -0.29 | -19.32% |
| ANIK | Anika | | Biotechnology | 25.89 | 83 | -0.31 | 14.25% |
| EHC | Encompass Health | | Hospitals | 83.38 | 81 | -0.31 | 24.97% |
| BIIB | Biogen | | Biotechnology | 214.82 | 74 | -0.32 | -16.98% |
| CCCC | C4 | | Biotechnology | 6.30 | 41 | -0.32 | 11.70% |
| TELA | TELA Bio | | Equipment | 4.50 | 42 | -0.33 | -31.95% |
| CTKB | Cytek Biosciences | | Medical Devices | 6.01 | 54 | -0.33 | -34.64% |
| IRMD | IRadimed | | Equipment | 40.76 | 0 | -0.34 | -14.14% |
| TRVI | Trevi | | Biotechnology | 2.93 | 76 | -0.34 | 118.66% |
| HUM | Humana | | Insurance | 302.09 | 10 | -0.35 | -34.01% |
| TEVA | Teva | | Pharmaceutical | 14.05 | 95 | -0.35 | 34.58% |
| INBX | Inhibrx | | Biotechnology | 34.04 | 32 | -0.35 | -10.44% |
| VMD | Viemed | | Equipment | 8.19 | 66 | -0.36 | 4.33% |
| IKNA | Ikena Oncology | | Biotechnology | 1.33 | 27 | -0.38 | -33.75% |
| ARWR | Arrowhead | | Biotechnology | 23.04 | 27 | -0.39 | -24.71% |
| For chart view version of above stock list: Chart View ➞ 0 - 25 , 25 - 50 , 50 - 75 , 75 - 100 , 100 - 125 , 125 - 150 , 150 - 175 , 175 - 200 , 200 - 225 , 225 - 250 , 250 - 275 , 275 - 300 , 300 - 325 , 325 - 350 , 350 - 375 , 375 - 400 , 400 - 425 , 425 - 450 , 450 - 475 , 475 - 500 , 500 - 525 , 525 - 550 , 550 - 575 , 575 - 600 , 600 - 625 , 625 - 650 , 650 - 675 , 675 - 700 , 700 - 725 | ||
 | Click To Change The Sort Order: By Market Cap or Company Size Performance: Year-to-date, Week and Day |  |
|
Get the most comprehensive stock market coverage daily at 12Stocks.com ➞ Best Stocks Today ➞ Best Stocks Weekly ➞ Best Stocks Year-to-Date ➞ Best Stocks Trends ➞  Best Stocks Today 12Stocks.com Best Nasdaq Stocks ➞ Best S&P 500 Stocks ➞ Best Tech Stocks ➞ Best Biotech Stocks ➞ |
| Detailed Overview of Healthcare Stocks |
| Healthcare Technical Overview, Leaders & Laggards, Top Healthcare ETF Funds & Detailed Healthcare Stocks List, Charts, Trends & More |
| Healthcare Sector: Technical Analysis, Trends & YTD Performance | |
| Healthcare sector is composed of stocks
from pharmaceutical, biotech, diagnostics labs, insurance providers
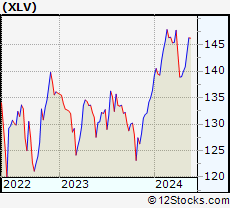
and healthcare services. Healthcare sector, as represented by XLV, an exchange-traded fund [ETF] that holds basket of Healthcare stocks (e.g, Merck, Amgen) is up by 2.9% and is currently underperforming the overall market by -1.9% year-to-date. Below is a quick view of Technical charts and trends: |
|
 XLV Weekly Chart |
|
| Long Term Trend: Good | |
| Medium Term Trend: Good | |
 XLV Daily Chart |
|
| Short Term Trend: Very Good | |
| Overall Trend Score: 60 | |
| YTD Performance: 2.9% | |
| **Trend Scores & Views Are Only For Educational Purposes And Not For Investing | |
| 12Stocks.com: Top Performing Healthcare Sector Stocks | ||||||||||||||||||||||||||||||||||||||||||||||||
 The top performing Healthcare sector stocks year to date are
Now, more recently, over last week, the top performing Healthcare sector stocks on the move are


|
||||||||||||||||||||||||||||||||||||||||||||||||
| 12Stocks.com: Investing in Healthcare Sector using Exchange Traded Funds | |
|
The following table shows list of key exchange traded funds (ETF) that
help investors track Healthcare Index. For detailed view, check out our ETF Funds section of our website. Quick View: Move mouse or cursor over ETF symbol (ticker) to view short-term Technical chart and over ETF name to view long term chart. Click on ticker or stock name for detailed view. Click on to add stock symbol to your watchlist and to view watchlist. |
12Stocks.com List of ETFs that track Healthcare Index
| Ticker | ETF Name | Watchlist | Recent Price | Smart Investing & Trading Score | Change % | Week % | Year-to-date % |
| XLV | Health Care | | 140.33 | 60 | -0.07 | 0.26 | 2.9% |
| XBI | Biotech | | 84.62 | 42 | -1.05 | 1.35 | -5.23% |
| IBB | Biotechnology | | 126.92 | 49 | -1.13 | 0.34 | -6.57% |
| BBH | Biotech | | 156.43 | 57 | -0.59 | 0.5 | -5.37% |
| VHT | Health Care | | 256.04 | 52 | -0.19 | 0.28 | 2.13% |
| IYH | Healthcare | | 58.83 | 70 | -0.05 | 0.38 | 2.76% |
| IHF | Healthcare Providers | | 51.84 | 53 | -0.42 | -0.15 | -1.28% |
| IHI | Medical Devices | | 55.01 | 30 | -1.47 | -0.94 | 1.93% |
| BIB | Biotechnology | | 50.35 | 42 | -2.74 | 1.39 | -11.74% |
| BIS | Short Biotech | | 19.84 | 44 | 1.48 | -1.88 | 9.8% |
| XHE | Health Care Equipment | | 82.11 | 28 | -1.27 | -0.39 | -2.55% |
| CURE | Healthcare Bull 3X | | 105.91 | 64 | -0.32 | 0.57 | 4.1% |
| LABU | Biotech Bull 3X | | 90.87 | 35 | -3.44 | 3.84 | -25.5% |
| LABD | Biotech Bear 3X | | 10.06 | 37 | 3.82 | -4.37 | 3.82% |
| PSCH | SmallCap Health Care | | 40.95 | 68 | -1.18 | 0.61 | -4.32% |
| XHS | Health Care Services | | 88.68 | 83 | -0.19 | 0.92 | -0.3% |
| PTH | DWA Healthcare Momentum | | 40.49 | 55 | 1.53 | 1.5 | 3.45% |
| BTEC | Principal Healthcare Innovators | | 34.65 | 49 | -0.55 | 1.17 | -4.62% |
| RXL | Health Care | | 95.00 | 54 | 0.89 | 0.18 | 3.93% |
| RXD | Short Health Care | | 11.36 | 30 | -0.35 | -0.79 | -4.74% |
| 12Stocks.com: Charts, Trends, Fundamental Data and Performances of Healthcare Stocks | |
|
We now take in-depth look at all Healthcare stocks including charts, multi-period performances and overall trends (as measured by Smart Investing & Trading Score). One can sort Healthcare stocks (click link to choose) by Daily, Weekly and by Year-to-Date performances. Also, one can sort by size of the company or by market capitalization. |
| Select Your Default Chart Type: | |||||
| |||||
| Click on stock symbol or name for detailed view. Click on to add stock symbol to your watchlist and to view watchlist. Quick View: Move mouse or cursor over "Daily" to quickly view daily Technical stock chart and over "Weekly" to view weekly Technical stock chart. | |||||

 | ETNB 89bio, Inc. |
| Sector: Health Care | |
| SubSector: Biotechnology | |
| MarketCap: 517.485 Millions | |
| Recent Price: 8.51 Smart Investing & Trading Score: 25 | |
| Day Percent Change: -0.23% Day Change: -0.02 | |
| Week Change: 3.03% Year-to-date Change: -23.8% | |
| ETNB Links: Profile News Message Board | |
| Charts:- Daily , Weekly | |
| Add ETNB to Watchlist: View: Get Complete ETNB Trend Analysis ➞ | |
 | INZY Inozyme Pharma, Inc. |
| Sector: Health Care | |
| SubSector: Biotechnology | |
| MarketCap: 53487 Millions | |
| Recent Price: 4.41 Smart Investing & Trading Score: 17 | |
| Day Percent Change: -0.23% Day Change: -0.01 | |
| Week Change: -0.68% Year-to-date Change: 3.6% | |
| INZY Links: Profile News Message Board | |
| Charts:- Daily , Weekly | |
| Add INZY to Watchlist: View: Get Complete INZY Trend Analysis ➞ | |
 | IART Integra LifeSciences Holdings Corporation |
| Sector: Health Care | |
| SubSector: Medical Instruments & Supplies | |
| MarketCap: 3510.4 Millions | |
| Recent Price: 29.17 Smart Investing & Trading Score: 35 | |
| Day Percent Change: -0.24% Day Change: -0.07 | |
| Week Change: 2.93% Year-to-date Change: -33.0% | |
| IART Links: Profile News Message Board | |
| Charts:- Daily , Weekly | |
| Add IART to Watchlist: View: Get Complete IART Trend Analysis ➞ | |
 | SDGR Schrodinger, Inc. |
| Sector: Health Care | |
| SubSector: Health Information Services | |
| MarketCap: 47287 Millions | |
| Recent Price: 24.38 Smart Investing & Trading Score: 35 | |
| Day Percent Change: -0.25% Day Change: -0.06 | |
| Week Change: 1.71% Year-to-date Change: -31.9% | |
| SDGR Links: Profile News Message Board | |
| Charts:- Daily , Weekly | |
| Add SDGR to Watchlist: View: Get Complete SDGR Trend Analysis ➞ | |
 | MGNX MacroGenics, Inc. |
| Sector: Health Care | |
| SubSector: Biotechnology | |
| MarketCap: 262.785 Millions | |
| Recent Price: 14.78 Smart Investing & Trading Score: 41 | |
| Day Percent Change: -0.27% Day Change: -0.04 | |
| Week Change: 1.51% Year-to-date Change: 53.6% | |
| MGNX Links: Profile News Message Board | |
| Charts:- Daily , Weekly | |
| Add MGNX to Watchlist: View: Get Complete MGNX Trend Analysis ➞ | |
 | AVIR Atea Pharmaceuticals, Inc. |
| Sector: Health Care | |
| SubSector: Biotechnology | |
| MarketCap: 22587 Millions | |
| Recent Price: 3.70 Smart Investing & Trading Score: 40 | |
| Day Percent Change: -0.27% Day Change: -0.01 | |
| Week Change: -0.27% Year-to-date Change: 21.3% | |
| AVIR Links: Profile News Message Board | |
| Charts:- Daily , Weekly | |
| Add AVIR to Watchlist: View: Get Complete AVIR Trend Analysis ➞ | |
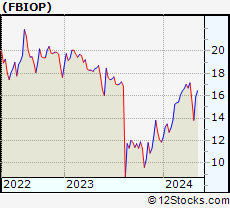 | FBIOP Fortress Biotech, Inc. |
| Sector: Health Care | |
| SubSector: Biotechnology | |
| MarketCap: 836.085 Millions | |
| Recent Price: 14.77 Smart Investing & Trading Score: 61 | |
| Day Percent Change: -0.27% Day Change: -0.04 | |
| Week Change: 6.87% Year-to-date Change: 24.4% | |
| FBIOP Links: Profile News Message Board | |
| Charts:- Daily , Weekly | |
| Add FBIOP to Watchlist: View: Get Complete FBIOP Trend Analysis ➞ | |
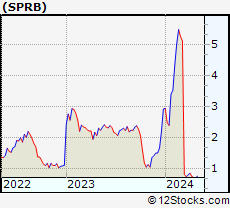 | SPRB Spruce Biosciences, Inc. |
| Sector: Health Care | |
| SubSector: Biotechnology | |
| MarketCap: 49487 Millions | |
| Recent Price: 0.71 Smart Investing & Trading Score: 30 | |
| Day Percent Change: -0.27% Day Change: 0.00 | |
| Week Change: 1.16% Year-to-date Change: -75.8% | |
| SPRB Links: Profile News Message Board | |
| Charts:- Daily , Weekly | |
| Add SPRB to Watchlist: View: Get Complete SPRB Trend Analysis ➞ | |
 | ENSG The Ensign Group, Inc. |
| Sector: Health Care | |
| SubSector: Long-Term Care Facilities | |
| MarketCap: 2053.76 Millions | |
| Recent Price: 118.36 Smart Investing & Trading Score: 68 | |
| Day Percent Change: -0.28% Day Change: -0.33 | |
| Week Change: 0.95% Year-to-date Change: 5.5% | |
| ENSG Links: Profile News Message Board | |
| Charts:- Daily , Weekly | |
| Add ENSG to Watchlist: View: Get Complete ENSG Trend Analysis ➞ | |
 | BMEA Biomea Fusion, Inc. |
| Sector: Health Care | |
| SubSector: Biotechnology | |
| MarketCap: 818 Millions | |
| Recent Price: 10.72 Smart Investing & Trading Score: 10 | |
| Day Percent Change: -0.28% Day Change: -0.03 | |
| Week Change: -0.46% Year-to-date Change: -26.8% | |
| BMEA Links: Profile News Message Board | |
| Charts:- Daily , Weekly | |
| Add BMEA to Watchlist: View: Get Complete BMEA Trend Analysis ➞ | |
 | ZTS Zoetis Inc. |
| Sector: Health Care | |
| SubSector: Drugs - Generic | |
| MarketCap: 51921.5 Millions | |
| Recent Price: 159.24 Smart Investing & Trading Score: 64 | |
| Day Percent Change: -0.29% Day Change: -0.46 | |
| Week Change: 0.52% Year-to-date Change: -19.3% | |
| ZTS Links: Profile News Message Board | |
| Charts:- Daily , Weekly | |
| Add ZTS to Watchlist: View: Get Complete ZTS Trend Analysis ➞ | |
 | ANIK Anika Therapeutics, Inc. |
| Sector: Health Care | |
| SubSector: Biotechnology | |
| MarketCap: 438.385 Millions | |
| Recent Price: 25.89 Smart Investing & Trading Score: 83 | |
| Day Percent Change: -0.31% Day Change: -0.08 | |
| Week Change: 1.25% Year-to-date Change: 14.3% | |
| ANIK Links: Profile News Message Board | |
| Charts:- Daily , Weekly | |
| Add ANIK to Watchlist: View: Get Complete ANIK Trend Analysis ➞ | |
 | EHC Encompass Health Corporation |
| Sector: Health Care | |
| SubSector: Hospitals | |
| MarketCap: 5384.06 Millions | |
| Recent Price: 83.38 Smart Investing & Trading Score: 81 | |
| Day Percent Change: -0.31% Day Change: -0.26 | |
| Week Change: 1.1% Year-to-date Change: 25.0% | |
| EHC Links: Profile News Message Board | |
| Charts:- Daily , Weekly | |
| Add EHC to Watchlist: View: Get Complete EHC Trend Analysis ➞ | |
 | BIIB Biogen Inc. |
| Sector: Health Care | |
| SubSector: Biotechnology | |
| MarketCap: 53102.6 Millions | |
| Recent Price: 214.82 Smart Investing & Trading Score: 74 | |
| Day Percent Change: -0.32% Day Change: -0.68 | |
| Week Change: 2.83% Year-to-date Change: -17.0% | |
| BIIB Links: Profile News Message Board | |
| Charts:- Daily , Weekly | |
| Add BIIB to Watchlist: View: Get Complete BIIB Trend Analysis ➞ | |
 | CCCC C4 Therapeutics, Inc. |
| Sector: Health Care | |
| SubSector: Biotechnology | |
| MarketCap: 12587 Millions | |
| Recent Price: 6.30 Smart Investing & Trading Score: 41 | |
| Day Percent Change: -0.32% Day Change: -0.02 | |
| Week Change: 2.11% Year-to-date Change: 11.7% | |
| CCCC Links: Profile News Message Board | |
| Charts:- Daily , Weekly | |
| Add CCCC to Watchlist: View: Get Complete CCCC Trend Analysis ➞ | |
 | TELA TELA Bio, Inc. |
| Sector: Health Care | |
| SubSector: Medical Appliances & Equipment | |
| MarketCap: 81.808 Millions | |
| Recent Price: 4.50 Smart Investing & Trading Score: 42 | |
| Day Percent Change: -0.33% Day Change: -0.01 | |
| Week Change: 1.24% Year-to-date Change: -32.0% | |
| TELA Links: Profile News Message Board | |
| Charts:- Daily , Weekly | |
| Add TELA to Watchlist: View: Get Complete TELA Trend Analysis ➞ | |
 | CTKB Cytek Biosciences, Inc. |
| Sector: Health Care | |
| SubSector: Medical Devices | |
| MarketCap: 1140 Millions | |
| Recent Price: 6.01 Smart Investing & Trading Score: 54 | |
| Day Percent Change: -0.33% Day Change: -0.02 | |
| Week Change: 4.34% Year-to-date Change: -34.6% | |
| CTKB Links: Profile News Message Board | |
| Charts:- Daily , Weekly | |
| Add CTKB to Watchlist: View: Get Complete CTKB Trend Analysis ➞ | |
 | IRMD IRadimed Corporation |
| Sector: Health Care | |
| SubSector: Medical Appliances & Equipment | |
| MarketCap: 207.78 Millions | |
| Recent Price: 40.76 Smart Investing & Trading Score: 0 | |
| Day Percent Change: -0.34% Day Change: -0.14 | |
| Week Change: -2.63% Year-to-date Change: -14.1% | |
| IRMD Links: Profile News Message Board | |
| Charts:- Daily , Weekly | |
| Add IRMD to Watchlist: View: Get Complete IRMD Trend Analysis ➞ | |
 | TRVI Trevi Therapeutics, Inc. |
| Sector: Health Care | |
| SubSector: Biotechnology | |
| MarketCap: 50.6785 Millions | |
| Recent Price: 2.93 Smart Investing & Trading Score: 76 | |
| Day Percent Change: -0.34% Day Change: -0.01 | |
| Week Change: 5.4% Year-to-date Change: 118.7% | |
| TRVI Links: Profile News Message Board | |
| Charts:- Daily , Weekly | |
| Add TRVI to Watchlist: View: Get Complete TRVI Trend Analysis ➞ | |
 | HUM Humana Inc. |
| Sector: Health Care | |
| SubSector: Health Care Plans | |
| MarketCap: 34125.6 Millions | |
| Recent Price: 302.09 Smart Investing & Trading Score: 10 | |
| Day Percent Change: -0.35% Day Change: -1.06 | |
| Week Change: -1.25% Year-to-date Change: -34.0% | |
| HUM Links: Profile News Message Board | |
| Charts:- Daily , Weekly | |
| Add HUM to Watchlist: View: Get Complete HUM Trend Analysis ➞ | |
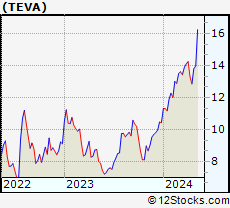 | TEVA Teva Pharmaceutical Industries Limited |
| Sector: Health Care | |
| SubSector: Drug Manufacturers - Other | |
| MarketCap: 9369.93 Millions | |
| Recent Price: 14.05 Smart Investing & Trading Score: 95 | |
| Day Percent Change: -0.35% Day Change: -0.05 | |
| Week Change: 1.74% Year-to-date Change: 34.6% | |
| TEVA Links: Profile News Message Board | |
| Charts:- Daily , Weekly | |
| Add TEVA to Watchlist: View: Get Complete TEVA Trend Analysis ➞ | |
 | INBX Inhibrx, Inc. |
| Sector: Health Care | |
| SubSector: Biotechnology | |
| MarketCap: 14187 Millions | |
| Recent Price: 34.04 Smart Investing & Trading Score: 32 | |
| Day Percent Change: -0.35% Day Change: -0.12 | |
| Week Change: -0.06% Year-to-date Change: -10.4% | |
| INBX Links: Profile News Message Board | |
| Charts:- Daily , Weekly | |
| Add INBX to Watchlist: View: Get Complete INBX Trend Analysis ➞ | |
 | VMD Viemed Healthcare, Inc. |
| Sector: Health Care | |
| SubSector: Medical Appliances & Equipment | |
| MarketCap: 177.28 Millions | |
| Recent Price: 8.19 Smart Investing & Trading Score: 66 | |
| Day Percent Change: -0.36% Day Change: -0.03 | |
| Week Change: -1.44% Year-to-date Change: 4.3% | |
| VMD Links: Profile News Message Board | |
| Charts:- Daily , Weekly | |
| Add VMD to Watchlist: View: Get Complete VMD Trend Analysis ➞ | |
 | IKNA Ikena Oncology, Inc. |
| Sector: Health Care | |
| SubSector: Biotechnology | |
| MarketCap: 277 Millions | |
| Recent Price: 1.33 Smart Investing & Trading Score: 27 | |
| Day Percent Change: -0.38% Day Change: -0.01 | |
| Week Change: 1.92% Year-to-date Change: -33.8% | |
| IKNA Links: Profile News Message Board | |
| Charts:- Daily , Weekly | |
| Add IKNA to Watchlist: View: Get Complete IKNA Trend Analysis ➞ | |
 | ARWR Arrowhead Pharmaceuticals, Inc. |
| Sector: Health Care | |
| SubSector: Biotechnology | |
| MarketCap: 3226.15 Millions | |
| Recent Price: 23.04 Smart Investing & Trading Score: 27 | |
| Day Percent Change: -0.39% Day Change: -0.09 | |
| Week Change: 4.16% Year-to-date Change: -24.7% | |
| ARWR Links: Profile News Message Board | |
| Charts:- Daily , Weekly | |
| Add ARWR to Watchlist: View: Get Complete ARWR Trend Analysis ➞ | |
| For tabular summary view of above stock list: Summary View ➞ 0 - 25 , 25 - 50 , 50 - 75 , 75 - 100 , 100 - 125 , 125 - 150 , 150 - 175 , 175 - 200 , 200 - 225 , 225 - 250 , 250 - 275 , 275 - 300 , 300 - 325 , 325 - 350 , 350 - 375 , 375 - 400 , 400 - 425 , 425 - 450 , 450 - 475 , 475 - 500 , 500 - 525 , 525 - 550 , 550 - 575 , 575 - 600 , 600 - 625 , 625 - 650 , 650 - 675 , 675 - 700 , 700 - 725 | ||
| Click To Change The Sort Order: By Market Cap or Company Size Performance: Year-to-date, Week and Day | |
| Select Chart Type: | ||
|
Best Stocks Today 12Stocks.com |
© 2024 12Stocks.com Terms & Conditions Privacy Contact Us
All Information Provided Only For Education And Not To Be Used For Investing or Trading. See Terms & Conditions


One More Thing ... Get Best Stocks Delivered Daily!
Never Ever Miss A Move With Our Top Ten Stocks Lists
Find Best Stocks In Any Market - Bull or Bear Market
Take A Peek At Our Top Ten Stocks Lists: Daily, Weekly, Year-to-Date & Top Trends
Find Best Stocks In Any Market - Bull or Bear Market
Take A Peek At Our Top Ten Stocks Lists: Daily, Weekly, Year-to-Date & Top Trends
Healthcare Stocks With Best Up Trends [0-bearish to 100-bullish]: Tenet [100], Day One[100], Fresenius [100], Haleon [100], DaVita [100], PTC [100], Cullinan Oncology[100], Perrigo [100], Phibro Animal[100], Xencor [100], Agios [100]
Best Healthcare Stocks Year-to-Date:
Pieris [6405.49%], Avenue [3011.8%], Precision BioSciences[2752.05%], Inovio [2145.1%], Aurora Cannabis[1838.26%], Assembly Biosciences[1420.55%], Agenus [1363.94%], Adverum Biotechnologies[1245.64%], NuCana [1238.74%], Affimed N.V[758.4%], CareMax [625.77%] Best Healthcare Stocks This Week:
Deciphera [72.49%], Canopy Growth[67%], GeneDx [54.42%], Concord [44.02%], Cue Biopharma[39.19%], Tilray [38.76%], Aurora Cannabis[37.76%], Phibro Animal[31.19%], Abeona [26.99%], Bright Green[25.75%], Exscientia [22.06%] Best Healthcare Stocks Daily:
Canopy Growth[78.85%], GeneDx [55.55%], Aurora Cannabis[46.04%], Tilray [38.76%], Cue Biopharma[33.80%], Bright Green[26.32%], Concord [25.00%], Abeona [20.35%], Cronos [15.29%], AnaptysBio [14.27%], OrganiGram [13.37%]