
 Login Sign Up


| |||||
 |  | ||||

| 12Stocks.com Market Intelligence |
Best Healthcare Stocks
 | "Discover best trending healthcare stocks with 12Stocks.com." |
| - Subu Vdaygiri, Founder, 12Stocks.com |
| In a hurry? Healthcare Stocks Lists: Performance Trends Table, Stock Charts
Sort Healthcare stocks: Daily, Weekly, Year-to-Date, Market Cap & Trends. Filter Healthcare stocks list by size:All Healthcare Large Mid-Range Small |
| 12Stocks.com Healthcare Stocks Performances & Trends Daily | |||||||||
|
|  The overall Smart Investing & Trading Score is 60 (0-bearish to 100-bullish) which puts Healthcare sector in short term neutral to bullish trend. The Smart Investing & Trading Score from previous trading session is 30 and an improvement of trend continues.
| ||||||||
Here are the Smart Investing & Trading Scores of the most requested Healthcare stocks at 12Stocks.com (click stock name for detailed review):
|


| 12Stocks.com: Investing in Healthcare sector with Stocks | |
|
The following table helps investors and traders sort through current performance and trends (as measured by Smart Investing & Trading Score) of various
stocks in the Healthcare sector. Quick View: Move mouse or cursor over stock symbol (ticker) to view short-term Technical chart and over stock name to view long term chart. Click on  to add stock symbol to your watchlist and to add stock symbol to your watchlist and  to view watchlist. Click on any ticker or stock name for detailed market intelligence report for that stock. to view watchlist. Click on any ticker or stock name for detailed market intelligence report for that stock. |
12Stocks.com Performance of Stocks in Healthcare Sector
| Ticker | Stock Name | Watchlist | Category | Recent Price | Smart Investing & Trading Score | Change % | YTD Change% |
| GILD | Gilead Sciences |   | Biotechnology | 65.20 | 28 | -1.12 | -19.52% |
| INSM | Insmed | | Biotechnology | 24.72 | 20 | -1.12 | -20.23% |
| FLGT | Fulgent Genetics | | Laboratories | 20.35 | 37 | -1.12 | -29.61% |
| EXEL | Exelixis | | Biotechnology | 23.46 | 68 | -1.14 | -2.21% |
| KMDA | Kamada | | Biotechnology | 5.22 | 57 | -1.14 | -14.71% |
| VOR | Vor Biopharma | | Biotechnology | 1.72 | 22 | -1.15 | -22.52% |
| XBIT | XBiotech | | Biotechnology | 7.67 | 46 | -1.16 | 91.75% |
| RGEN | Repligen | | Biotechnology | 164.20 | 20 | -1.17 | -8.68% |
| MRNA | Moderna | | Biotechnology | 110.31 | 100 | -1.17 | 10.92% |
| ZBH | Zimmer Biomet | | Equipment | 120.28 | 30 | -1.17 | -1.17% |
| BLTE | Belite Bio | | Biotechnology | 40.45 | 57 | -1.17 | -11.20% |
| ABT | Abbott | | Equipment | 105.97 | 7 | -1.21 | -3.72% |
| ASND | Ascendis Pharma | | Biotechnology | 138.44 | 48 | -1.22 | 9.92% |
| GKOS | Glaukos | | Instruments | 96.00 | 36 | -1.23 | 20.77% |
| NTRA | Natera | | Laboratories | 92.88 | 83 | -1.23 | 48.28% |
| VNDA | Vanda | | Biotechnology | 4.76 | 95 | -1.24 | 12.80% |
| XENE | Xenon | | Biotechnology | 42.20 | 64 | -1.24 | -8.38% |
| OCUL | Ocular Therapeutix | | Biotechnology | 4.74 | 25 | -1.25 | 6.28% |
| RDY | Dr. Reddy | | Pharmaceutical | 73.47 | 66 | -1.28 | 5.59% |
| LXRX | Lexicon | | Biotechnology | 1.54 | 10 | -1.28 | 0.65% |
| MASI | Masimo | | Instruments | 134.41 | 54 | -1.31 | 14.67% |
| MMSI | Merit | | Instruments | 74.10 | 67 | -1.32 | -2.45% |
| FDMT | 4D Molecular | | Biotechnology | 23.93 | 43 | -1.32 | 15.60% |
| CRL | Charles River | | Laboratories | 229.00 | 44 | -1.34 | -3.13% |
| PRVA | Privia Health | | Health Information | 18.40 | 37 | -1.34 | -22.13% |
| For chart view version of above stock list: Chart View ➞ 0 - 25 , 25 - 50 , 50 - 75 , 75 - 100 , 100 - 125 , 125 - 150 , 150 - 175 , 175 - 200 , 200 - 225 , 225 - 250 , 250 - 275 , 275 - 300 , 300 - 325 , 325 - 350 , 350 - 375 , 375 - 400 , 400 - 425 , 425 - 450 , 450 - 475 , 475 - 500 , 500 - 525 , 525 - 550 , 550 - 575 , 575 - 600 , 600 - 625 , 625 - 650 , 650 - 675 , 675 - 700 , 700 - 725 | ||
 | Click To Change The Sort Order: By Market Cap or Company Size Performance: Year-to-date, Week and Day |  |
|
Get the most comprehensive stock market coverage daily at 12Stocks.com ➞ Best Stocks Today ➞ Best Stocks Weekly ➞ Best Stocks Year-to-Date ➞ Best Stocks Trends ➞  Best Stocks Today 12Stocks.com Best Nasdaq Stocks ➞ Best S&P 500 Stocks ➞ Best Tech Stocks ➞ Best Biotech Stocks ➞ |
| Detailed Overview of Healthcare Stocks |
| Healthcare Technical Overview, Leaders & Laggards, Top Healthcare ETF Funds & Detailed Healthcare Stocks List, Charts, Trends & More |
| Healthcare Sector: Technical Analysis, Trends & YTD Performance | |
| Healthcare sector is composed of stocks
from pharmaceutical, biotech, diagnostics labs, insurance providers
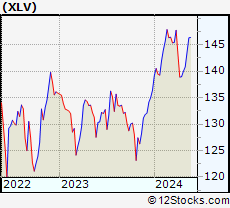
and healthcare services. Healthcare sector, as represented by XLV, an exchange-traded fund [ETF] that holds basket of Healthcare stocks (e.g, Merck, Amgen) is up by 2.9% and is currently underperforming the overall market by -1.9% year-to-date. Below is a quick view of Technical charts and trends: |
|
 XLV Weekly Chart |
|
| Long Term Trend: Not Good | |
| Medium Term Trend: Good | |
 XLV Daily Chart |
|
| Short Term Trend: Very Good | |
| Overall Trend Score: 60 | |
| YTD Performance: 2.9% | |
| **Trend Scores & Views Are Only For Educational Purposes And Not For Investing | |
| 12Stocks.com: Top Performing Healthcare Sector Stocks | ||||||||||||||||||||||||||||||||||||||||||||||||
 The top performing Healthcare sector stocks year to date are
Now, more recently, over last week, the top performing Healthcare sector stocks on the move are


|
||||||||||||||||||||||||||||||||||||||||||||||||
| 12Stocks.com: Investing in Healthcare Sector using Exchange Traded Funds | |
|
The following table shows list of key exchange traded funds (ETF) that
help investors track Healthcare Index. For detailed view, check out our ETF Funds section of our website. Quick View: Move mouse or cursor over ETF symbol (ticker) to view short-term Technical chart and over ETF name to view long term chart. Click on ticker or stock name for detailed view. Click on to add stock symbol to your watchlist and to view watchlist. |
12Stocks.com List of ETFs that track Healthcare Index
| Ticker | ETF Name | Watchlist | Recent Price | Smart Investing & Trading Score | Change % | Week % | Year-to-date % |
| XLV | Health Care | | 140.33 | 60 | -0.07 | 0.26 | 2.9% |
| XBI | Biotech | | 84.62 | 42 | -1.05 | 1.35 | -5.23% |
| IBB | Biotechnology | | 126.92 | 49 | -1.13 | 0.34 | -6.57% |
| BBH | Biotech | | 156.43 | 49 | -0.59 | 0.5 | -5.37% |
| VHT | Health Care | | 256.04 | 52 | -0.19 | 0.28 | 2.13% |
| IYH | Healthcare | | 58.83 | 70 | -0.05 | 0.38 | 2.76% |
| IHF | Healthcare Providers | | 51.84 | 53 | -0.42 | -0.15 | -1.28% |
| IHI | Medical Devices | | 55.01 | 30 | -1.47 | -0.94 | 1.93% |
| BIB | Biotechnology | | 50.35 | 42 | -2.74 | 1.39 | -11.74% |
| BIS | Short Biotech | | 19.84 | 63 | 1.48 | -1.88 | 9.8% |
| XHE | Health Care Equipment | | 82.11 | 28 | -1.27 | -0.39 | -2.55% |
| CURE | Healthcare Bull 3X | | 105.91 | 47 | -0.32 | 0.57 | 4.1% |
| LABU | Biotech Bull 3X | | 90.87 | 35 | -3.44 | 3.84 | -25.5% |
| LABD | Biotech Bear 3X | | 10.06 | 37 | 3.82 | -4.37 | 3.82% |
| PSCH | SmallCap Health Care | | 40.95 | 68 | -1.18 | 0.61 | -4.32% |
| XHS | Health Care Services | | 88.68 | 83 | -0.19 | 0.92 | -0.3% |
| PTH | DWA Healthcare Momentum | | 40.49 | 55 | 1.53 | 1.5 | 3.45% |
| BTEC | Principal Healthcare Innovators | | 34.65 | 42 | -0.55 | 1.17 | -4.62% |
| RXL | Health Care | | 95.00 | 47 | 0.89 | 0.18 | 3.93% |
| RXD | Short Health Care | | 11.36 | 30 | -0.35 | -0.79 | -4.74% |
| 12Stocks.com: Charts, Trends, Fundamental Data and Performances of Healthcare Stocks | |
|
We now take in-depth look at all Healthcare stocks including charts, multi-period performances and overall trends (as measured by Smart Investing & Trading Score). One can sort Healthcare stocks (click link to choose) by Daily, Weekly and by Year-to-Date performances. Also, one can sort by size of the company or by market capitalization. |
| Select Your Default Chart Type: | |||||
| |||||
| Click on stock symbol or name for detailed view. Click on to add stock symbol to your watchlist and to view watchlist. Quick View: Move mouse or cursor over "Daily" to quickly view daily Technical stock chart and over "Weekly" to view weekly Technical stock chart. | |||||

 | GILD Gilead Sciences, Inc. |
| Sector: Health Care | |
| SubSector: Biotechnology | |
| MarketCap: 99485.6 Millions | |
| Recent Price: 65.20 Smart Investing & Trading Score: 28 | |
| Day Percent Change: -1.12% Day Change: -0.74 | |
| Week Change: -0.34% Year-to-date Change: -19.5% | |
| GILD Links: Profile News Message Board | |
| Charts:- Daily , Weekly | |
| Add GILD to Watchlist: View: Get Complete GILD Trend Analysis ➞ | |
 | INSM Insmed Incorporated |
| Sector: Health Care | |
| SubSector: Biotechnology | |
| MarketCap: 1452.45 Millions | |
| Recent Price: 24.72 Smart Investing & Trading Score: 20 | |
| Day Percent Change: -1.12% Day Change: -0.28 | |
| Week Change: -0.32% Year-to-date Change: -20.2% | |
| INSM Links: Profile News Message Board | |
| Charts:- Daily , Weekly | |
| Add INSM to Watchlist: View: Get Complete INSM Trend Analysis ➞ | |
 | FLGT Fulgent Genetics, Inc. |
| Sector: Health Care | |
| SubSector: Medical Laboratories & Research | |
| MarketCap: 222.2 Millions | |
| Recent Price: 20.35 Smart Investing & Trading Score: 37 | |
| Day Percent Change: -1.12% Day Change: -0.23 | |
| Week Change: 1.24% Year-to-date Change: -29.6% | |
| FLGT Links: Profile News Message Board | |
| Charts:- Daily , Weekly | |
| Add FLGT to Watchlist: View: Get Complete FLGT Trend Analysis ➞ | |
 | EXEL Exelixis, Inc. |
| Sector: Health Care | |
| SubSector: Biotechnology | |
| MarketCap: 5254.75 Millions | |
| Recent Price: 23.46 Smart Investing & Trading Score: 68 | |
| Day Percent Change: -1.14% Day Change: -0.27 | |
| Week Change: -1.01% Year-to-date Change: -2.2% | |
| EXEL Links: Profile News Message Board | |
| Charts:- Daily , Weekly | |
| Add EXEL to Watchlist: View: Get Complete EXEL Trend Analysis ➞ | |
 | KMDA Kamada Ltd. |
| Sector: Health Care | |
| SubSector: Biotechnology | |
| MarketCap: 238.685 Millions | |
| Recent Price: 5.22 Smart Investing & Trading Score: 57 | |
| Day Percent Change: -1.14% Day Change: -0.06 | |
| Week Change: 1.36% Year-to-date Change: -14.7% | |
| KMDA Links: Profile News Message Board | |
| Charts:- Daily , Weekly | |
| Add KMDA to Watchlist: View: Get Complete KMDA Trend Analysis ➞ | |
 | VOR Vor Biopharma Inc. |
| Sector: Health Care | |
| SubSector: Biotechnology | |
| MarketCap: 224 Millions | |
| Recent Price: 1.72 Smart Investing & Trading Score: 22 | |
| Day Percent Change: -1.15% Day Change: -0.02 | |
| Week Change: 1.78% Year-to-date Change: -22.5% | |
| VOR Links: Profile News Message Board | |
| Charts:- Daily , Weekly | |
| Add VOR to Watchlist: View: Get Complete VOR Trend Analysis ➞ | |
 | XBIT XBiotech Inc. |
| Sector: Health Care | |
| SubSector: Biotechnology | |
| MarketCap: 420.385 Millions | |
| Recent Price: 7.67 Smart Investing & Trading Score: 46 | |
| Day Percent Change: -1.16% Day Change: -0.09 | |
| Week Change: -2.54% Year-to-date Change: 91.8% | |
| XBIT Links: Profile News Message Board | |
| Charts:- Daily , Weekly | |
| Add XBIT to Watchlist: View: Get Complete XBIT Trend Analysis ➞ | |
 | RGEN Repligen Corporation |
| Sector: Health Care | |
| SubSector: Biotechnology | |
| MarketCap: 4711.75 Millions | |
| Recent Price: 164.20 Smart Investing & Trading Score: 20 | |
| Day Percent Change: -1.17% Day Change: -1.94 | |
| Week Change: -1.43% Year-to-date Change: -8.7% | |
| RGEN Links: Profile News Message Board | |
| Charts:- Daily , Weekly | |
| Add RGEN to Watchlist: View: Get Complete RGEN Trend Analysis ➞ | |
 | MRNA Moderna, Inc. |
| Sector: Health Care | |
| SubSector: Biotechnology | |
| MarketCap: 11006.4 Millions | |
| Recent Price: 110.31 Smart Investing & Trading Score: 100 | |
| Day Percent Change: -1.17% Day Change: -1.31 | |
| Week Change: 2.17% Year-to-date Change: 10.9% | |
| MRNA Links: Profile News Message Board | |
| Charts:- Daily , Weekly | |
| Add MRNA to Watchlist: View: Get Complete MRNA Trend Analysis ➞ | |
 | ZBH Zimmer Biomet Holdings, Inc. |
| Sector: Health Care | |
| SubSector: Medical Appliances & Equipment | |
| MarketCap: 19339.4 Millions | |
| Recent Price: 120.28 Smart Investing & Trading Score: 30 | |
| Day Percent Change: -1.17% Day Change: -1.43 | |
| Week Change: 0.78% Year-to-date Change: -1.2% | |
| ZBH Links: Profile News Message Board | |
| Charts:- Daily , Weekly | |
| Add ZBH to Watchlist: View: Get Complete ZBH Trend Analysis ➞ | |
 | BLTE Belite Bio, Inc |
| Sector: Health Care | |
| SubSector: Biotechnology | |
| MarketCap: 404 Millions | |
| Recent Price: 40.45 Smart Investing & Trading Score: 57 | |
| Day Percent Change: -1.17% Day Change: -0.48 | |
| Week Change: 1.76% Year-to-date Change: -11.2% | |
| BLTE Links: Profile News Message Board | |
| Charts:- Daily , Weekly | |
| Add BLTE to Watchlist: View: Get Complete BLTE Trend Analysis ➞ | |
 | ABT Abbott Laboratories |
| Sector: Health Care | |
| SubSector: Medical Appliances & Equipment | |
| MarketCap: 125288 Millions | |
| Recent Price: 105.97 Smart Investing & Trading Score: 7 | |
| Day Percent Change: -1.21% Day Change: -1.30 | |
| Week Change: -1.45% Year-to-date Change: -3.7% | |
| ABT Links: Profile News Message Board | |
| Charts:- Daily , Weekly | |
| Add ABT to Watchlist: View: Get Complete ABT Trend Analysis ➞ | |
 | ASND Ascendis Pharma A/S |
| Sector: Health Care | |
| SubSector: Biotechnology | |
| MarketCap: 5470.35 Millions | |
| Recent Price: 138.44 Smart Investing & Trading Score: 48 | |
| Day Percent Change: -1.22% Day Change: -1.71 | |
| Week Change: 1.87% Year-to-date Change: 9.9% | |
| ASND Links: Profile News Message Board | |
| Charts:- Daily , Weekly | |
| Add ASND to Watchlist: View: Get Complete ASND Trend Analysis ➞ | |
 | GKOS Glaukos Corporation |
| Sector: Health Care | |
| SubSector: Medical Instruments & Supplies | |
| MarketCap: 1103.6 Millions | |
| Recent Price: 96.00 Smart Investing & Trading Score: 36 | |
| Day Percent Change: -1.23% Day Change: -1.20 | |
| Week Change: -3.5% Year-to-date Change: 20.8% | |
| GKOS Links: Profile News Message Board | |
| Charts:- Daily , Weekly | |
| Add GKOS to Watchlist: View: Get Complete GKOS Trend Analysis ➞ | |
 | NTRA Natera, Inc. |
| Sector: Health Care | |
| SubSector: Medical Laboratories & Research | |
| MarketCap: 2152.1 Millions | |
| Recent Price: 92.88 Smart Investing & Trading Score: 83 | |
| Day Percent Change: -1.23% Day Change: -1.16 | |
| Week Change: 1.33% Year-to-date Change: 48.3% | |
| NTRA Links: Profile News Message Board | |
| Charts:- Daily , Weekly | |
| Add NTRA to Watchlist: View: Get Complete NTRA Trend Analysis ➞ | |
 | VNDA Vanda Pharmaceuticals Inc. |
| Sector: Health Care | |
| SubSector: Biotechnology | |
| MarketCap: 464.585 Millions | |
| Recent Price: 4.76 Smart Investing & Trading Score: 95 | |
| Day Percent Change: -1.24% Day Change: -0.06 | |
| Week Change: 3.03% Year-to-date Change: 12.8% | |
| VNDA Links: Profile News Message Board | |
| Charts:- Daily , Weekly | |
| Add VNDA to Watchlist: View: Get Complete VNDA Trend Analysis ➞ | |
 | XENE Xenon Pharmaceuticals Inc. |
| Sector: Health Care | |
| SubSector: Biotechnology | |
| MarketCap: 388.585 Millions | |
| Recent Price: 42.20 Smart Investing & Trading Score: 64 | |
| Day Percent Change: -1.24% Day Change: -0.53 | |
| Week Change: 4.2% Year-to-date Change: -8.4% | |
| XENE Links: Profile News Message Board | |
| Charts:- Daily , Weekly | |
| Add XENE to Watchlist: View: Get Complete XENE Trend Analysis ➞ | |
 | OCUL Ocular Therapeutix, Inc. |
| Sector: Health Care | |
| SubSector: Biotechnology | |
| MarketCap: 249.985 Millions | |
| Recent Price: 4.74 Smart Investing & Trading Score: 25 | |
| Day Percent Change: -1.25% Day Change: -0.06 | |
| Week Change: -0.11% Year-to-date Change: 6.3% | |
| OCUL Links: Profile News Message Board | |
| Charts:- Daily , Weekly | |
| Add OCUL to Watchlist: View: Get Complete OCUL Trend Analysis ➞ | |
 | RDY Dr. Reddy s Laboratories Limited |
| Sector: Health Care | |
| SubSector: Drug Manufacturers - Other | |
| MarketCap: 6590.23 Millions | |
| Recent Price: 73.47 Smart Investing & Trading Score: 66 | |
| Day Percent Change: -1.28% Day Change: -0.95 | |
| Week Change: -1.45% Year-to-date Change: 5.6% | |
| RDY Links: Profile News Message Board | |
| Charts:- Daily , Weekly | |
| Add RDY to Watchlist: View: Get Complete RDY Trend Analysis ➞ | |
 | LXRX Lexicon Pharmaceuticals, Inc. |
| Sector: Health Care | |
| SubSector: Biotechnology | |
| MarketCap: 251.185 Millions | |
| Recent Price: 1.54 Smart Investing & Trading Score: 10 | |
| Day Percent Change: -1.28% Day Change: -0.02 | |
| Week Change: -2.53% Year-to-date Change: 0.7% | |
| LXRX Links: Profile News Message Board | |
| Charts:- Daily , Weekly | |
| Add LXRX to Watchlist: View: Get Complete LXRX Trend Analysis ➞ | |
 | MASI Masimo Corporation |
| Sector: Health Care | |
| SubSector: Medical Instruments & Supplies | |
| MarketCap: 8493.2 Millions | |
| Recent Price: 134.41 Smart Investing & Trading Score: 54 | |
| Day Percent Change: -1.31% Day Change: -1.79 | |
| Week Change: -1.27% Year-to-date Change: 14.7% | |
| MASI Links: Profile News Message Board | |
| Charts:- Daily , Weekly | |
| Add MASI to Watchlist: View: Get Complete MASI Trend Analysis ➞ | |
 | MMSI Merit Medical Systems, Inc. |
| Sector: Health Care | |
| SubSector: Medical Instruments & Supplies | |
| MarketCap: 1719.2 Millions | |
| Recent Price: 74.10 Smart Investing & Trading Score: 67 | |
| Day Percent Change: -1.32% Day Change: -0.99 | |
| Week Change: 0.43% Year-to-date Change: -2.5% | |
| MMSI Links: Profile News Message Board | |
| Charts:- Daily , Weekly | |
| Add MMSI to Watchlist: View: Get Complete MMSI Trend Analysis ➞ | |
 | FDMT 4D Molecular Therapeutics, Inc. |
| Sector: Health Care | |
| SubSector: Biotechnology | |
| MarketCap: 772 Millions | |
| Recent Price: 23.93 Smart Investing & Trading Score: 43 | |
| Day Percent Change: -1.32% Day Change: -0.32 | |
| Week Change: 3.04% Year-to-date Change: 15.6% | |
| FDMT Links: Profile News Message Board | |
| Charts:- Daily , Weekly | |
| Add FDMT to Watchlist: View: Get Complete FDMT Trend Analysis ➞ | |
 | CRL Charles River Laboratories International, Inc. |
| Sector: Health Care | |
| SubSector: Medical Laboratories & Research | |
| MarketCap: 5700.5 Millions | |
| Recent Price: 229.00 Smart Investing & Trading Score: 44 | |
| Day Percent Change: -1.34% Day Change: -3.10 | |
| Week Change: -0.01% Year-to-date Change: -3.1% | |
| CRL Links: Profile News Message Board | |
| Charts:- Daily , Weekly | |
| Add CRL to Watchlist: View: Get Complete CRL Trend Analysis ➞ | |
 | PRVA Privia Health Group, Inc. |
| Sector: Health Care | |
| SubSector: Health Information Services | |
| MarketCap: 3130 Millions | |
| Recent Price: 18.40 Smart Investing & Trading Score: 37 | |
| Day Percent Change: -1.34% Day Change: -0.25 | |
| Week Change: 0.71% Year-to-date Change: -22.1% | |
| PRVA Links: Profile News Message Board | |
| Charts:- Daily , Weekly | |
| Add PRVA to Watchlist: View: Get Complete PRVA Trend Analysis ➞ | |
| For tabular summary view of above stock list: Summary View ➞ 0 - 25 , 25 - 50 , 50 - 75 , 75 - 100 , 100 - 125 , 125 - 150 , 150 - 175 , 175 - 200 , 200 - 225 , 225 - 250 , 250 - 275 , 275 - 300 , 300 - 325 , 325 - 350 , 350 - 375 , 375 - 400 , 400 - 425 , 425 - 450 , 450 - 475 , 475 - 500 , 500 - 525 , 525 - 550 , 550 - 575 , 575 - 600 , 600 - 625 , 625 - 650 , 650 - 675 , 675 - 700 , 700 - 725 | ||
| Click To Change The Sort Order: By Market Cap or Company Size Performance: Year-to-date, Week and Day | |
| Select Chart Type: | ||
|
Best Stocks Today 12Stocks.com |
© 2024 12Stocks.com Terms & Conditions Privacy Contact Us
All Information Provided Only For Education And Not To Be Used For Investing or Trading. See Terms & Conditions


One More Thing ... Get Best Stocks Delivered Daily!
Never Ever Miss A Move With Our Top Ten Stocks Lists
Find Best Stocks In Any Market - Bull or Bear Market
Take A Peek At Our Top Ten Stocks Lists: Daily, Weekly, Year-to-Date & Top Trends
Find Best Stocks In Any Market - Bull or Bear Market
Take A Peek At Our Top Ten Stocks Lists: Daily, Weekly, Year-to-Date & Top Trends
Healthcare Stocks With Best Up Trends [0-bearish to 100-bullish]: Concord [100], Tenet [100], Day One[100], DaVita [100], PTC [100], Cullinan Oncology[100], Perrigo [100], Phibro Animal[100], Xencor [100], Agios [100], Lantheus [100]
Best Healthcare Stocks Year-to-Date:
Pieris [6405.49%], Avenue [3011.8%], Precision BioSciences[2752.05%], Inovio [2145.1%], Aurora Cannabis[1838.26%], Assembly Biosciences[1420.55%], Agenus [1363.94%], Adverum Biotechnologies[1245.64%], NuCana [1238.74%], Affimed N.V[758.4%], CareMax [625.77%] Best Healthcare Stocks This Week:
Deciphera [72.49%], Canopy Growth[67%], GeneDx [54.42%], Concord [44.02%], Cue Biopharma[39.19%], Tilray [38.76%], Aurora Cannabis[37.76%], Phibro Animal[31.19%], Abeona [26.99%], Bright Green[25.75%], Exscientia [22.06%] Best Healthcare Stocks Daily:
Canopy Growth[78.85%], GeneDx [55.55%], Aurora Cannabis[46.04%], Tilray [38.76%], Cue Biopharma[33.80%], Bright Green[26.32%], Concord [25.00%], Abeona [20.35%], Cronos [15.29%], AnaptysBio [14.27%], OrganiGram [13.37%]