
 Login Sign Up


| |||||
 |  | ||||

| 12Stocks.com Market Intelligence |
Best Healthcare Stocks
 | "Discover best trending healthcare stocks with 12Stocks.com." |
| - Subu Vdaygiri, Founder, 12Stocks.com |
| In a hurry? Healthcare Stocks Lists: Performance Trends Table, Stock Charts
Sort Healthcare stocks: Daily, Weekly, Year-to-Date, Market Cap & Trends. Filter Healthcare stocks list by size:All Healthcare Large Mid-Range Small |
| 12Stocks.com Healthcare Stocks Performances & Trends Daily | |||||||||
|
|  The overall Smart Investing & Trading Score is 60 (0-bearish to 100-bullish) which puts Healthcare sector in short term neutral to bullish trend. The Smart Investing & Trading Score from previous trading session is 30 and an improvement of trend continues.
| ||||||||
Here are the Smart Investing & Trading Scores of the most requested Healthcare stocks at 12Stocks.com (click stock name for detailed review):
|


| 12Stocks.com: Investing in Healthcare sector with Stocks | |
|
The following table helps investors and traders sort through current performance and trends (as measured by Smart Investing & Trading Score) of various
stocks in the Healthcare sector. Quick View: Move mouse or cursor over stock symbol (ticker) to view short-term Technical chart and over stock name to view long term chart. Click on  to add stock symbol to your watchlist and to add stock symbol to your watchlist and  to view watchlist. Click on any ticker or stock name for detailed market intelligence report for that stock. to view watchlist. Click on any ticker or stock name for detailed market intelligence report for that stock. |
12Stocks.com Performance of Stocks in Healthcare Sector
| Ticker | Stock Name | Watchlist | Category | Recent Price | Smart Investing & Trading Score | Change % | YTD Change% |
| PYPD | PolyPid |   | Biotechnology | 4.77 | 50 | 0.00 | 30.03% |
| ATHA | Athira Pharma | | Biotechnology | 1.97 | 10 | 0.00 | -19.26% |
| CVAC | CureVac N.V | | Biotechnology | 2.52 | 47 | 0.00 | -40.21% |
| XOMAO | XOMA | | Biotechnology | 24.89 | 38 | 0.00 | -0.40% |
| RPHM | Reneo | | Biotechnology | 1.67 | 48 | 0.00 | 3.09% |
| AVAH | Aveanna | | Medical Care Facilities | 2.25 | 42 | 0.00 | -16.51% |
| TNYA | Tenaya | | Biotechnology | 4.54 | 85 | 0.00 | 42.77% |
| PHAR | Pharming | | Biotechnology | 9.91 | 10 | 0.00 | -13.30% |
| DCPH | Deciphera | | Biotechnology | 25.27 | 93 | -0.04 | 56.66% |
| PFE | Pfizer | | Pharmaceutical | 25.62 | 49 | -0.08 | -11.01% |
| THRD | Third Harmonic | | Biotechnology | 11.14 | 68 | -0.09 | 1.13% |
| CERE | Cerevel | | Biotechnology | 42.71 | 93 | -0.09 | 0.75% |
| SLN | Silence | | Biotechnology | 21.86 | 20 | -0.09 | 24.52% |
| UTMD | Utah | | Instruments | 66.20 | 38 | -0.15 | -21.40% |
| NRC | National Research | | Laboratories | 34.25 | 43 | -0.15 | -13.42% |
| EYPT | EyePoint | | Biotechnology | 17.60 | 42 | -0.17 | -23.84% |
| OSCR | Oscar Health | | Healthcare Plans | 17.37 | 61 | -0.17 | 90.77% |
| IMVT | Immunovant | | Biotechnology | 27.44 | 27 | -0.18 | -34.87% |
| REGN | Regeneron | | Biotechnology | 890.66 | 25 | -0.20 | 1.41% |
| CORT | Corcept | | Biotechnology | 23.32 | 68 | -0.21 | -28.20% |
| NNOX | Nano X | | Medical Devices | 8.96 | 54 | -0.22 | 40.66% |
| INMD | InMode | | Equipment | 17.19 | 25 | -0.23 | -22.71% |
| ETNB | 89bio | | Biotechnology | 8.51 | 32 | -0.23 | -23.81% |
| INZY | Inozyme Pharma | | Biotechnology | 4.41 | 25 | -0.23 | 3.64% |
| IART | Integra LifeSciences | | Instruments | 29.17 | 42 | -0.24 | -33.02% |
| For chart view version of above stock list: Chart View ➞ 0 - 25 , 25 - 50 , 50 - 75 , 75 - 100 , 100 - 125 , 125 - 150 , 150 - 175 , 175 - 200 , 200 - 225 , 225 - 250 , 250 - 275 , 275 - 300 , 300 - 325 , 325 - 350 , 350 - 375 , 375 - 400 , 400 - 425 , 425 - 450 , 450 - 475 , 475 - 500 , 500 - 525 , 525 - 550 , 550 - 575 , 575 - 600 , 600 - 625 , 625 - 650 , 650 - 675 , 675 - 700 , 700 - 725 | ||
 | Click To Change The Sort Order: By Market Cap or Company Size Performance: Year-to-date, Week and Day |  |
|
Get the most comprehensive stock market coverage daily at 12Stocks.com ➞ Best Stocks Today ➞ Best Stocks Weekly ➞ Best Stocks Year-to-Date ➞ Best Stocks Trends ➞  Best Stocks Today 12Stocks.com Best Nasdaq Stocks ➞ Best S&P 500 Stocks ➞ Best Tech Stocks ➞ Best Biotech Stocks ➞ |
| Detailed Overview of Healthcare Stocks |
| Healthcare Technical Overview, Leaders & Laggards, Top Healthcare ETF Funds & Detailed Healthcare Stocks List, Charts, Trends & More |
| Healthcare Sector: Technical Analysis, Trends & YTD Performance | |
| Healthcare sector is composed of stocks
from pharmaceutical, biotech, diagnostics labs, insurance providers
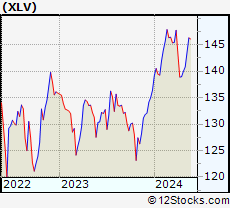
and healthcare services. Healthcare sector, as represented by XLV, an exchange-traded fund [ETF] that holds basket of Healthcare stocks (e.g, Merck, Amgen) is up by 2.9% and is currently underperforming the overall market by -1.9% year-to-date. Below is a quick view of Technical charts and trends: |
|
 XLV Weekly Chart |
|
| Long Term Trend: Not Good | |
| Medium Term Trend: Good | |
 XLV Daily Chart |
|
| Short Term Trend: Very Good | |
| Overall Trend Score: 60 | |
| YTD Performance: 2.9% | |
| **Trend Scores & Views Are Only For Educational Purposes And Not For Investing | |
| 12Stocks.com: Top Performing Healthcare Sector Stocks | ||||||||||||||||||||||||||||||||||||||||||||||||
 The top performing Healthcare sector stocks year to date are
Now, more recently, over last week, the top performing Healthcare sector stocks on the move are


|
||||||||||||||||||||||||||||||||||||||||||||||||
| 12Stocks.com: Investing in Healthcare Sector using Exchange Traded Funds | |
|
The following table shows list of key exchange traded funds (ETF) that
help investors track Healthcare Index. For detailed view, check out our ETF Funds section of our website. Quick View: Move mouse or cursor over ETF symbol (ticker) to view short-term Technical chart and over ETF name to view long term chart. Click on ticker or stock name for detailed view. Click on to add stock symbol to your watchlist and to view watchlist. |
12Stocks.com List of ETFs that track Healthcare Index
| Ticker | ETF Name | Watchlist | Recent Price | Smart Investing & Trading Score | Change % | Week % | Year-to-date % |
| XLV | Health Care | | 140.33 | 60 | -0.07 | 0.26 | 2.9% |
| XBI | Biotech | | 84.62 | 32 | -1.05 | 1.35 | -5.23% |
| IBB | Biotechnology | | 126.92 | 49 | -1.13 | 0.34 | -6.57% |
| BBH | Biotech | | 156.43 | 49 | -0.59 | 0.5 | -5.37% |
| VHT | Health Care | | 256.04 | 52 | -0.19 | 0.28 | 2.13% |
| IYH | Healthcare | | 58.83 | 52 | -0.05 | 0.38 | 2.76% |
| IHF | Healthcare Providers | | 51.84 | 53 | -0.42 | -0.15 | -1.28% |
| IHI | Medical Devices | | 55.01 | 13 | -1.47 | -0.94 | 1.93% |
| BIB | Biotechnology | | 50.35 | 42 | -2.74 | 1.39 | -11.74% |
| BIS | Short Biotech | | 19.84 | 63 | 1.48 | -1.88 | 9.8% |
| XHE | Health Care Equipment | | 82.11 | 28 | -1.27 | -0.39 | -2.55% |
| CURE | Healthcare Bull 3X | | 105.91 | 47 | -0.32 | 0.57 | 4.1% |
| LABU | Biotech Bull 3X | | 90.87 | 35 | -3.44 | 3.84 | -25.5% |
| LABD | Biotech Bear 3X | | 10.06 | 55 | 3.82 | -4.37 | 3.82% |
| PSCH | SmallCap Health Care | | 40.95 | 55 | -1.18 | 0.61 | -4.32% |
| XHS | Health Care Services | | 88.68 | 90 | -0.19 | 0.92 | -0.3% |
| PTH | DWA Healthcare Momentum | | 40.49 | 75 | 1.53 | 1.5 | 3.45% |
| BTEC | Principal Healthcare Innovators | | 34.65 | 32 | -0.55 | 1.17 | -4.62% |
| RXL | Health Care | | 95.00 | 47 | 0.89 | 0.18 | 3.93% |
| RXD | Short Health Care | | 11.36 | 30 | -0.35 | -0.79 | -4.74% |
| 12Stocks.com: Charts, Trends, Fundamental Data and Performances of Healthcare Stocks | |
|
We now take in-depth look at all Healthcare stocks including charts, multi-period performances and overall trends (as measured by Smart Investing & Trading Score). One can sort Healthcare stocks (click link to choose) by Daily, Weekly and by Year-to-Date performances. Also, one can sort by size of the company or by market capitalization. |
| Select Your Default Chart Type: | |||||
| |||||
| Click on stock symbol or name for detailed view. Click on to add stock symbol to your watchlist and to view watchlist. Quick View: Move mouse or cursor over "Daily" to quickly view daily Technical stock chart and over "Weekly" to view weekly Technical stock chart. | |||||

 | PYPD PolyPid Ltd. |
| Sector: Health Care | |
| SubSector: Biotechnology | |
| MarketCap: 20487 Millions | |
| Recent Price: 4.77 Smart Investing & Trading Score: 50 | |
| Day Percent Change: 0.00% Day Change: 0.00 | |
| Week Change: 0.4% Year-to-date Change: 30.0% | |
| PYPD Links: Profile News Message Board | |
| Charts:- Daily , Weekly | |
| Add PYPD to Watchlist: View: Get Complete PYPD Trend Analysis ➞ | |
 | ATHA Athira Pharma, Inc. |
| Sector: Health Care | |
| SubSector: Biotechnology | |
| MarketCap: 92487 Millions | |
| Recent Price: 1.97 Smart Investing & Trading Score: 10 | |
| Day Percent Change: 0.00% Day Change: 0.00 | |
| Week Change: 2.6% Year-to-date Change: -19.3% | |
| ATHA Links: Profile News Message Board | |
| Charts:- Daily , Weekly | |
| Add ATHA to Watchlist: View: Get Complete ATHA Trend Analysis ➞ | |
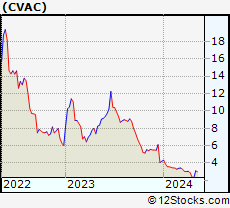 | CVAC CureVac N.V. |
| Sector: Health Care | |
| SubSector: Biotechnology | |
| MarketCap: 22957 Millions | |
| Recent Price: 2.52 Smart Investing & Trading Score: 47 | |
| Day Percent Change: 0.00% Day Change: 0.00 | |
| Week Change: 8.15% Year-to-date Change: -40.2% | |
| CVAC Links: Profile News Message Board | |
| Charts:- Daily , Weekly | |
| Add CVAC to Watchlist: View: Get Complete CVAC Trend Analysis ➞ | |
 | XOMAO XOMA Corporation |
| Sector: Health Care | |
| SubSector: Biotechnology | |
| MarketCap: 217 Millions | |
| Recent Price: 24.89 Smart Investing & Trading Score: 38 | |
| Day Percent Change: 0.00% Day Change: 0.00 | |
| Week Change: -0.32% Year-to-date Change: -0.4% | |
| XOMAO Links: Profile News Message Board | |
| Charts:- Daily , Weekly | |
| Add XOMAO to Watchlist: View: Get Complete XOMAO Trend Analysis ➞ | |
 | RPHM Reneo Pharmaceuticals, Inc. |
| Sector: Health Care | |
| SubSector: Biotechnology | |
| MarketCap: 233 Millions | |
| Recent Price: 1.67 Smart Investing & Trading Score: 48 | |
| Day Percent Change: 0.00% Day Change: 0.00 | |
| Week Change: 0% Year-to-date Change: 3.1% | |
| RPHM Links: Profile News Message Board | |
| Charts:- Daily , Weekly | |
| Add RPHM to Watchlist: View: Get Complete RPHM Trend Analysis ➞ | |
 | AVAH Aveanna Healthcare Holdings Inc. |
| Sector: Health Care | |
| SubSector: Medical Care Facilities | |
| MarketCap: 305 Millions | |
| Recent Price: 2.25 Smart Investing & Trading Score: 42 | |
| Day Percent Change: 0.00% Day Change: 0.00 | |
| Week Change: 2.27% Year-to-date Change: -16.5% | |
| AVAH Links: Profile News Message Board | |
| Charts:- Daily , Weekly | |
| Add AVAH to Watchlist: View: Get Complete AVAH Trend Analysis ➞ | |
 | TNYA Tenaya Therapeutics, Inc. |
| Sector: Health Care | |
| SubSector: Biotechnology | |
| MarketCap: 395 Millions | |
| Recent Price: 4.54 Smart Investing & Trading Score: 85 | |
| Day Percent Change: 0.00% Day Change: 0.00 | |
| Week Change: 5.34% Year-to-date Change: 42.8% | |
| TNYA Links: Profile News Message Board | |
| Charts:- Daily , Weekly | |
| Add TNYA to Watchlist: View: Get Complete TNYA Trend Analysis ➞ | |
 | PHAR Pharming Group N.V. |
| Sector: Health Care | |
| SubSector: Biotechnology | |
| MarketCap: 808 Millions | |
| Recent Price: 9.91 Smart Investing & Trading Score: 10 | |
| Day Percent Change: 0.00% Day Change: 0.00 | |
| Week Change: -5.17% Year-to-date Change: -13.3% | |
| PHAR Links: Profile News Message Board | |
| Charts:- Daily , Weekly | |
| Add PHAR to Watchlist: View: Get Complete PHAR Trend Analysis ➞ | |
 | DCPH Deciphera Pharmaceuticals, Inc. |
| Sector: Health Care | |
| SubSector: Biotechnology | |
| MarketCap: 2329.95 Millions | |
| Recent Price: 25.27 Smart Investing & Trading Score: 93 | |
| Day Percent Change: -0.04% Day Change: -0.01 | |
| Week Change: 72.49% Year-to-date Change: 56.7% | |
| DCPH Links: Profile News Message Board | |
| Charts:- Daily , Weekly | |
| Add DCPH to Watchlist: View: Get Complete DCPH Trend Analysis ➞ | |
 | PFE Pfizer Inc. |
| Sector: Health Care | |
| SubSector: Drug Manufacturers - Major | |
| MarketCap: 172467 Millions | |
| Recent Price: 25.62 Smart Investing & Trading Score: 49 | |
| Day Percent Change: -0.08% Day Change: -0.02 | |
| Week Change: 0.87% Year-to-date Change: -11.0% | |
| PFE Links: Profile News Message Board | |
| Charts:- Daily , Weekly | |
| Add PFE to Watchlist: View: Get Complete PFE Trend Analysis ➞ | |
 | THRD Third Harmonic Bio, Inc. |
| Sector: Health Care | |
| SubSector: Biotechnology | |
| MarketCap: 190 Millions | |
| Recent Price: 11.14 Smart Investing & Trading Score: 68 | |
| Day Percent Change: -0.09% Day Change: -0.01 | |
| Week Change: 2.86% Year-to-date Change: 1.1% | |
| THRD Links: Profile News Message Board | |
| Charts:- Daily , Weekly | |
| Add THRD to Watchlist: View: Get Complete THRD Trend Analysis ➞ | |
 | CERE Cerevel Therapeutics Holdings, Inc. |
| Sector: Health Care | |
| SubSector: Biotechnology | |
| MarketCap: 21587 Millions | |
| Recent Price: 42.71 Smart Investing & Trading Score: 93 | |
| Day Percent Change: -0.09% Day Change: -0.04 | |
| Week Change: 0.57% Year-to-date Change: 0.8% | |
| CERE Links: Profile News Message Board | |
| Charts:- Daily , Weekly | |
| Add CERE to Watchlist: View: Get Complete CERE Trend Analysis ➞ | |
 | SLN Silence Therapeutics plc |
| Sector: Health Care | |
| SubSector: Biotechnology | |
| MarketCap: 198 Millions | |
| Recent Price: 21.86 Smart Investing & Trading Score: 20 | |
| Day Percent Change: -0.09% Day Change: -0.02 | |
| Week Change: 1.18% Year-to-date Change: 24.5% | |
| SLN Links: Profile News Message Board | |
| Charts:- Daily , Weekly | |
| Add SLN to Watchlist: View: Get Complete SLN Trend Analysis ➞ | |
 | UTMD Utah Medical Products, Inc. |
| Sector: Health Care | |
| SubSector: Medical Instruments & Supplies | |
| MarketCap: 285.86 Millions | |
| Recent Price: 66.20 Smart Investing & Trading Score: 38 | |
| Day Percent Change: -0.15% Day Change: -0.10 | |
| Week Change: 0.42% Year-to-date Change: -21.4% | |
| UTMD Links: Profile News Message Board | |
| Charts:- Daily , Weekly | |
| Add UTMD to Watchlist: View: Get Complete UTMD Trend Analysis ➞ | |
 | NRC National Research Corporation |
| Sector: Health Care | |
| SubSector: Medical Laboratories & Research | |
| MarketCap: 1187.7 Millions | |
| Recent Price: 34.25 Smart Investing & Trading Score: 43 | |
| Day Percent Change: -0.15% Day Change: -0.05 | |
| Week Change: 1.3% Year-to-date Change: -13.4% | |
| NRC Links: Profile News Message Board | |
| Charts:- Daily , Weekly | |
| Add NRC to Watchlist: View: Get Complete NRC Trend Analysis ➞ | |
 | EYPT EyePoint Pharmaceuticals, Inc. |
| Sector: Health Care | |
| SubSector: Biotechnology | |
| MarketCap: 125.085 Millions | |
| Recent Price: 17.60 Smart Investing & Trading Score: 42 | |
| Day Percent Change: -0.17% Day Change: -0.03 | |
| Week Change: 5.07% Year-to-date Change: -23.8% | |
| EYPT Links: Profile News Message Board | |
| Charts:- Daily , Weekly | |
| Add EYPT to Watchlist: View: Get Complete EYPT Trend Analysis ➞ | |
 | OSCR Oscar Health, Inc. |
| Sector: Health Care | |
| SubSector: Healthcare Plans | |
| MarketCap: 1790 Millions | |
| Recent Price: 17.37 Smart Investing & Trading Score: 61 | |
| Day Percent Change: -0.17% Day Change: -0.03 | |
| Week Change: -1.08% Year-to-date Change: 90.8% | |
| OSCR Links: Profile News Message Board | |
| Charts:- Daily , Weekly | |
| Add OSCR to Watchlist: View: Get Complete OSCR Trend Analysis ➞ | |
 | IMVT Immunovant, Inc. |
| Sector: Health Care | |
| SubSector: Biotechnology | |
| MarketCap: 552.885 Millions | |
| Recent Price: 27.44 Smart Investing & Trading Score: 27 | |
| Day Percent Change: -0.18% Day Change: -0.05 | |
| Week Change: 0.99% Year-to-date Change: -34.9% | |
| IMVT Links: Profile News Message Board | |
| Charts:- Daily , Weekly | |
| Add IMVT to Watchlist: View: Get Complete IMVT Trend Analysis ➞ | |
 | REGN Regeneron Pharmaceuticals, Inc. |
| Sector: Health Care | |
| SubSector: Biotechnology | |
| MarketCap: 51903.7 Millions | |
| Recent Price: 890.66 Smart Investing & Trading Score: 25 | |
| Day Percent Change: -0.20% Day Change: -1.82 | |
| Week Change: 0.84% Year-to-date Change: 1.4% | |
| REGN Links: Profile News Message Board | |
| Charts:- Daily , Weekly | |
| Add REGN to Watchlist: View: Get Complete REGN Trend Analysis ➞ | |
 | CORT Corcept Therapeutics Incorporated |
| Sector: Health Care | |
| SubSector: Biotechnology | |
| MarketCap: 1228.45 Millions | |
| Recent Price: 23.32 Smart Investing & Trading Score: 68 | |
| Day Percent Change: -0.21% Day Change: -0.05 | |
| Week Change: 2.28% Year-to-date Change: -28.2% | |
| CORT Links: Profile News Message Board | |
| Charts:- Daily , Weekly | |
| Add CORT to Watchlist: View: Get Complete CORT Trend Analysis ➞ | |
 | NNOX Nano X Imaging Ltd. |
| Sector: Health Care | |
| SubSector: Medical Devices | |
| MarketCap: 22587 Millions | |
| Recent Price: 8.96 Smart Investing & Trading Score: 54 | |
| Day Percent Change: -0.22% Day Change: -0.02 | |
| Week Change: 0% Year-to-date Change: 40.7% | |
| NNOX Links: Profile News Message Board | |
| Charts:- Daily , Weekly | |
| Add NNOX to Watchlist: View: Get Complete NNOX Trend Analysis ➞ | |
 | INMD InMode Ltd. |
| Sector: Health Care | |
| SubSector: Medical Appliances & Equipment | |
| MarketCap: 689.08 Millions | |
| Recent Price: 17.19 Smart Investing & Trading Score: 25 | |
| Day Percent Change: -0.23% Day Change: -0.04 | |
| Week Change: 0.29% Year-to-date Change: -22.7% | |
| INMD Links: Profile News Message Board | |
| Charts:- Daily , Weekly | |
| Add INMD to Watchlist: View: Get Complete INMD Trend Analysis ➞ | |
 | ETNB 89bio, Inc. |
| Sector: Health Care | |
| SubSector: Biotechnology | |
| MarketCap: 517.485 Millions | |
| Recent Price: 8.51 Smart Investing & Trading Score: 32 | |
| Day Percent Change: -0.23% Day Change: -0.02 | |
| Week Change: 3.03% Year-to-date Change: -23.8% | |
| ETNB Links: Profile News Message Board | |
| Charts:- Daily , Weekly | |
| Add ETNB to Watchlist: View: Get Complete ETNB Trend Analysis ➞ | |
 | INZY Inozyme Pharma, Inc. |
| Sector: Health Care | |
| SubSector: Biotechnology | |
| MarketCap: 53487 Millions | |
| Recent Price: 4.41 Smart Investing & Trading Score: 25 | |
| Day Percent Change: -0.23% Day Change: -0.01 | |
| Week Change: -0.68% Year-to-date Change: 3.6% | |
| INZY Links: Profile News Message Board | |
| Charts:- Daily , Weekly | |
| Add INZY to Watchlist: View: Get Complete INZY Trend Analysis ➞ | |
 | IART Integra LifeSciences Holdings Corporation |
| Sector: Health Care | |
| SubSector: Medical Instruments & Supplies | |
| MarketCap: 3510.4 Millions | |
| Recent Price: 29.17 Smart Investing & Trading Score: 42 | |
| Day Percent Change: -0.24% Day Change: -0.07 | |
| Week Change: 2.93% Year-to-date Change: -33.0% | |
| IART Links: Profile News Message Board | |
| Charts:- Daily , Weekly | |
| Add IART to Watchlist: View: Get Complete IART Trend Analysis ➞ | |
| For tabular summary view of above stock list: Summary View ➞ 0 - 25 , 25 - 50 , 50 - 75 , 75 - 100 , 100 - 125 , 125 - 150 , 150 - 175 , 175 - 200 , 200 - 225 , 225 - 250 , 250 - 275 , 275 - 300 , 300 - 325 , 325 - 350 , 350 - 375 , 375 - 400 , 400 - 425 , 425 - 450 , 450 - 475 , 475 - 500 , 500 - 525 , 525 - 550 , 550 - 575 , 575 - 600 , 600 - 625 , 625 - 650 , 650 - 675 , 675 - 700 , 700 - 725 | ||
| Click To Change The Sort Order: By Market Cap or Company Size Performance: Year-to-date, Week and Day | |
| Select Chart Type: | ||
|
Best Stocks Today 12Stocks.com |
© 2024 12Stocks.com Terms & Conditions Privacy Contact Us
All Information Provided Only For Education And Not To Be Used For Investing or Trading. See Terms & Conditions


One More Thing ... Get Best Stocks Delivered Daily!
Never Ever Miss A Move With Our Top Ten Stocks Lists
Find Best Stocks In Any Market - Bull or Bear Market
Take A Peek At Our Top Ten Stocks Lists: Daily, Weekly, Year-to-Date & Top Trends
Find Best Stocks In Any Market - Bull or Bear Market
Take A Peek At Our Top Ten Stocks Lists: Daily, Weekly, Year-to-Date & Top Trends
Healthcare Stocks With Best Up Trends [0-bearish to 100-bullish]: Canopy Growth[100], GeneDx [100], Aurora Cannabis[100], Bright Green[100], Concord [100], Cronos [100], AnaptysBio [100], Tenet [100], CareMax [100], Day One[100], Janux [100]
Best Healthcare Stocks Year-to-Date:
Pieris [6405.49%], Avenue [3011.8%], Precision BioSciences[2752.05%], Inovio [2145.1%], Aurora Cannabis[1838.26%], Assembly Biosciences[1420.55%], Agenus [1363.94%], Adverum Biotechnologies[1245.64%], NuCana [1238.74%], Affimed N.V[758.4%], CareMax [636.08%] Best Healthcare Stocks This Week:
Deciphera [72.49%], Canopy Growth[67%], GeneDx [54.06%], Concord [44.02%], Cue Biopharma[39.19%], Tilray [38.76%], Aurora Cannabis[37.76%], Phibro Animal[31.19%], Abeona [26.99%], Bright Green[25.7%], Exscientia [22.06%] Best Healthcare Stocks Daily:
Canopy Growth[78.85%], GeneDx [55.18%], Aurora Cannabis[46.04%], Tilray [38.76%], Cue Biopharma[33.80%], Bright Green[26.27%], Concord [25.00%], Abeona [20.35%], Cronos [15.29%], AnaptysBio [14.27%], OrganiGram [13.37%]