
 Login Sign Up


| |||||
 |  | ||||

| 12Stocks.com Market Intelligence |
Best Healthcare Stocks
 | "Discover best trending healthcare stocks with 12Stocks.com." |
| - Subu Vdaygiri, Founder, 12Stocks.com |
| In a hurry? Healthcare Stocks Lists: Performance Trends Table, Stock Charts
Sort Healthcare stocks: Daily, Weekly, Year-to-Date, Market Cap & Trends. Filter Healthcare stocks list by size:All Healthcare Large Mid-Range Small |
| 12Stocks.com Healthcare Stocks Performances & Trends Daily | |||||||||
|
|  The overall Smart Investing & Trading Score is 60 (0-bearish to 100-bullish) which puts Healthcare sector in short term neutral to bullish trend. The Smart Investing & Trading Score from previous trading session is 30 and an improvement of trend continues.
| ||||||||
Here are the Smart Investing & Trading Scores of the most requested Healthcare stocks at 12Stocks.com (click stock name for detailed review):
|


| 12Stocks.com: Investing in Healthcare sector with Stocks | |
|
The following table helps investors and traders sort through current performance and trends (as measured by Smart Investing & Trading Score) of various
stocks in the Healthcare sector. Quick View: Move mouse or cursor over stock symbol (ticker) to view short-term Technical chart and over stock name to view long term chart. Click on  to add stock symbol to your watchlist and to add stock symbol to your watchlist and  to view watchlist. Click on any ticker or stock name for detailed market intelligence report for that stock. to view watchlist. Click on any ticker or stock name for detailed market intelligence report for that stock. |
12Stocks.com Performance of Stocks in Healthcare Sector
| Ticker | Stock Name | Watchlist | Category | Recent Price | Smart Investing & Trading Score | Change % | YTD Change% |
| SIBN | SI-BONE |   | Equipment | 14.26 | 20 | -2.66 | -32.06% |
| LCTX | Lineage Cell | | Biotechnology | 1.09 | 61 | -2.68 | 0.00% |
| TMCI | Treace | | Medical Devices | 10.37 | 35 | -2.68 | -18.64% |
| KRMD | Repro Med | | Instruments | 2.17 | 93 | -2.69 | -11.61% |
| APLM | Apollomics | | Biotechnology | 0.43 | 10 | -2.73 | -53.93% |
| PEN | Penumbra | | Instruments | 196.47 | 15 | -2.76 | -21.89% |
| AHCO | AdaptHealth | | Equipment | 9.85 | 83 | -2.76 | 35.12% |
| INVA | Innoviva | | Biotechnology | 15.11 | 62 | -2.77 | -5.80% |
| EMBC | Embecta | | Instruments | 10.15 | 35 | -2.78 | -46.87% |
| ENZ | Enzo Biochem | | Laboratories | 1.04 | 20 | -2.80 | -25.18% |
| ALLO | Allogene | | Biotechnology | 2.76 | 15 | -2.82 | -14.02% |
| MEIP | MEI Pharma | | Biotechnology | 3.05 | 20 | -2.87 | -47.41% |
| DH | Definitive | | Health Information | 6.95 | 33 | -2.87 | -31.03% |
| NERV | Minerva Neurosciences | | Biotechnology | 2.34 | 10 | -2.90 | -61.95% |
| AVNS | Avanos | | Instruments | 18.08 | 45 | -2.90 | -19.39% |
| BVS | Bioventus | | Medical Devices | 3.95 | 10 | -2.95 | -25.33% |
| ALDX | Aldeyra | | Biotechnology | 3.94 | 68 | -2.96 | 12.25% |
| MEDP | Medpace | | Laboratories | 388.35 | 64 | -2.96 | 26.69% |
| EDIT | Editas Medicine | | Biotechnology | 5.21 | 20 | -2.98 | -48.57% |
| KYMR | Kymera | | Biotechnology | 33.62 | 41 | -3.00 | 32.31% |
| JYNT | Joint | | Hospitals | 11.94 | 76 | -3.01 | 24.25% |
| ELAN | Elanco Animal | | Pharmaceutical | 13.16 | 42 | -3.02 | -11.68% |
| PRAX | Praxis Precision | | Biotechnology | 55.12 | 78 | -3.06 | 145.58% |
| ZIMV | ZimVie | | Medical Devices | 15.19 | 33 | -3.06 | -14.28% |
| ME | 23andMe Holding | | Diagnostics & Research | 0.50 | 69 | -3.08 | -43.91% |
| For chart view version of above stock list: Chart View ➞ 0 - 25 , 25 - 50 , 50 - 75 , 75 - 100 , 100 - 125 , 125 - 150 , 150 - 175 , 175 - 200 , 200 - 225 , 225 - 250 , 250 - 275 , 275 - 300 , 300 - 325 , 325 - 350 , 350 - 375 , 375 - 400 , 400 - 425 , 425 - 450 , 450 - 475 , 475 - 500 , 500 - 525 , 525 - 550 , 550 - 575 , 575 - 600 , 600 - 625 , 625 - 650 , 650 - 675 , 675 - 700 , 700 - 725 | ||
 | Click To Change The Sort Order: By Market Cap or Company Size Performance: Year-to-date, Week and Day |  |
|
Get the most comprehensive stock market coverage daily at 12Stocks.com ➞ Best Stocks Today ➞ Best Stocks Weekly ➞ Best Stocks Year-to-Date ➞ Best Stocks Trends ➞  Best Stocks Today 12Stocks.com Best Nasdaq Stocks ➞ Best S&P 500 Stocks ➞ Best Tech Stocks ➞ Best Biotech Stocks ➞ |
| Detailed Overview of Healthcare Stocks |
| Healthcare Technical Overview, Leaders & Laggards, Top Healthcare ETF Funds & Detailed Healthcare Stocks List, Charts, Trends & More |
| Healthcare Sector: Technical Analysis, Trends & YTD Performance | |
| Healthcare sector is composed of stocks
from pharmaceutical, biotech, diagnostics labs, insurance providers
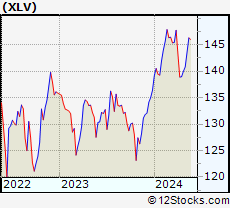
and healthcare services. Healthcare sector, as represented by XLV, an exchange-traded fund [ETF] that holds basket of Healthcare stocks (e.g, Merck, Amgen) is up by 2.9% and is currently underperforming the overall market by -1.9% year-to-date. Below is a quick view of Technical charts and trends: |
|
 XLV Weekly Chart |
|
| Long Term Trend: Not Good | |
| Medium Term Trend: Good | |
 XLV Daily Chart |
|
| Short Term Trend: Very Good | |
| Overall Trend Score: 60 | |
| YTD Performance: 2.9% | |
| **Trend Scores & Views Are Only For Educational Purposes And Not For Investing | |
| 12Stocks.com: Top Performing Healthcare Sector Stocks | ||||||||||||||||||||||||||||||||||||||||||||||||
 The top performing Healthcare sector stocks year to date are
Now, more recently, over last week, the top performing Healthcare sector stocks on the move are


|
||||||||||||||||||||||||||||||||||||||||||||||||
| 12Stocks.com: Investing in Healthcare Sector using Exchange Traded Funds | |
|
The following table shows list of key exchange traded funds (ETF) that
help investors track Healthcare Index. For detailed view, check out our ETF Funds section of our website. Quick View: Move mouse or cursor over ETF symbol (ticker) to view short-term Technical chart and over ETF name to view long term chart. Click on ticker or stock name for detailed view. Click on to add stock symbol to your watchlist and to view watchlist. |
12Stocks.com List of ETFs that track Healthcare Index
| Ticker | ETF Name | Watchlist | Recent Price | Smart Investing & Trading Score | Change % | Week % | Year-to-date % |
| XLV | Health Care | | 140.33 | 60 | -0.07 | 0.26 | 2.9% |
| XBI | Biotech | | 84.62 | 42 | -1.05 | 1.35 | -5.23% |
| IBB | Biotechnology | | 126.92 | 49 | -1.13 | 0.34 | -6.57% |
| BBH | Biotech | | 156.43 | 49 | -0.59 | 0.5 | -5.37% |
| VHT | Health Care | | 256.04 | 52 | -0.19 | 0.28 | 2.13% |
| IYH | Healthcare | | 58.83 | 70 | -0.05 | 0.38 | 2.76% |
| IHF | Healthcare Providers | | 51.84 | 53 | -0.42 | -0.15 | -1.28% |
| IHI | Medical Devices | | 55.01 | 30 | -1.47 | -0.94 | 1.93% |
| BIB | Biotechnology | | 50.35 | 42 | -2.74 | 1.39 | -11.74% |
| BIS | Short Biotech | | 19.84 | 63 | 1.48 | -1.88 | 9.8% |
| XHE | Health Care Equipment | | 82.11 | 28 | -1.27 | -0.39 | -2.55% |
| CURE | Healthcare Bull 3X | | 105.91 | 47 | -0.32 | 0.57 | 4.1% |
| LABU | Biotech Bull 3X | | 90.87 | 35 | -3.44 | 3.84 | -25.5% |
| LABD | Biotech Bear 3X | | 10.06 | 37 | 3.82 | -4.37 | 3.82% |
| PSCH | SmallCap Health Care | | 40.95 | 68 | -1.18 | 0.61 | -4.32% |
| XHS | Health Care Services | | 88.68 | 83 | -0.19 | 0.92 | -0.3% |
| PTH | DWA Healthcare Momentum | | 40.49 | 55 | 1.53 | 1.5 | 3.45% |
| BTEC | Principal Healthcare Innovators | | 34.65 | 42 | -0.55 | 1.17 | -4.62% |
| RXL | Health Care | | 95.00 | 47 | 0.89 | 0.18 | 3.93% |
| RXD | Short Health Care | | 11.36 | 30 | -0.35 | -0.79 | -4.74% |
| 12Stocks.com: Charts, Trends, Fundamental Data and Performances of Healthcare Stocks | |
|
We now take in-depth look at all Healthcare stocks including charts, multi-period performances and overall trends (as measured by Smart Investing & Trading Score). One can sort Healthcare stocks (click link to choose) by Daily, Weekly and by Year-to-Date performances. Also, one can sort by size of the company or by market capitalization. |
| Select Your Default Chart Type: | |||||
| |||||
| Click on stock symbol or name for detailed view. Click on to add stock symbol to your watchlist and to view watchlist. Quick View: Move mouse or cursor over "Daily" to quickly view daily Technical stock chart and over "Weekly" to view weekly Technical stock chart. | |||||

 | SIBN SI-BONE, Inc. |
| Sector: Health Care | |
| SubSector: Medical Appliances & Equipment | |
| MarketCap: 234.78 Millions | |
| Recent Price: 14.26 Smart Investing & Trading Score: 20 | |
| Day Percent Change: -2.66% Day Change: -0.39 | |
| Week Change: -2.13% Year-to-date Change: -32.1% | |
| SIBN Links: Profile News Message Board | |
| Charts:- Daily , Weekly | |
| Add SIBN to Watchlist: View: Get Complete SIBN Trend Analysis ➞ | |
 | LCTX Lineage Cell Therapeutics, Inc. |
| Sector: Health Care | |
| SubSector: Biotechnology | |
| MarketCap: 141.285 Millions | |
| Recent Price: 1.09 Smart Investing & Trading Score: 61 | |
| Day Percent Change: -2.68% Day Change: -0.03 | |
| Week Change: -4.39% Year-to-date Change: 0.0% | |
| LCTX Links: Profile News Message Board | |
| Charts:- Daily , Weekly | |
| Add LCTX to Watchlist: View: Get Complete LCTX Trend Analysis ➞ | |
 | TMCI Treace Medical Concepts, Inc. |
| Sector: Health Care | |
| SubSector: Medical Devices | |
| MarketCap: 1550 Millions | |
| Recent Price: 10.37 Smart Investing & Trading Score: 35 | |
| Day Percent Change: -2.68% Day Change: -0.29 | |
| Week Change: -0.24% Year-to-date Change: -18.6% | |
| TMCI Links: Profile News Message Board | |
| Charts:- Daily , Weekly | |
| Add TMCI to Watchlist: View: Get Complete TMCI Trend Analysis ➞ | |
 | KRMD Repro Med Systems, Inc. |
| Sector: Health Care | |
| SubSector: Medical Instruments & Supplies | |
| MarketCap: 340.06 Millions | |
| Recent Price: 2.17 Smart Investing & Trading Score: 93 | |
| Day Percent Change: -2.69% Day Change: -0.06 | |
| Week Change: -0.91% Year-to-date Change: -11.6% | |
| KRMD Links: Profile News Message Board | |
| Charts:- Daily , Weekly | |
| Add KRMD to Watchlist: View: Get Complete KRMD Trend Analysis ➞ | |
 | APLM Apollomics, Inc. |
| Sector: Health Care | |
| SubSector: Biotechnology | |
| MarketCap: 481 Millions | |
| Recent Price: 0.43 Smart Investing & Trading Score: 10 | |
| Day Percent Change: -2.73% Day Change: -0.01 | |
| Week Change: -4.89% Year-to-date Change: -53.9% | |
| APLM Links: Profile News Message Board | |
| Charts:- Daily , Weekly | |
| Add APLM to Watchlist: View: Get Complete APLM Trend Analysis ➞ | |
 | PEN Penumbra, Inc. |
| Sector: Health Care | |
| SubSector: Medical Instruments & Supplies | |
| MarketCap: 4854.1 Millions | |
| Recent Price: 196.47 Smart Investing & Trading Score: 15 | |
| Day Percent Change: -2.76% Day Change: -5.57 | |
| Week Change: -3.88% Year-to-date Change: -21.9% | |
| PEN Links: Profile News Message Board | |
| Charts:- Daily , Weekly | |
| Add PEN to Watchlist: View: Get Complete PEN Trend Analysis ➞ | |
 | AHCO AdaptHealth Corp. |
| Sector: Health Care | |
| SubSector: Medical Appliances & Equipment | |
| MarketCap: 1084.8 Millions | |
| Recent Price: 9.85 Smart Investing & Trading Score: 83 | |
| Day Percent Change: -2.76% Day Change: -0.28 | |
| Week Change: -1.1% Year-to-date Change: 35.1% | |
| AHCO Links: Profile News Message Board | |
| Charts:- Daily , Weekly | |
| Add AHCO to Watchlist: View: Get Complete AHCO Trend Analysis ➞ | |
 | INVA Innoviva, Inc. |
| Sector: Health Care | |
| SubSector: Biotechnology | |
| MarketCap: 1023.15 Millions | |
| Recent Price: 15.11 Smart Investing & Trading Score: 62 | |
| Day Percent Change: -2.77% Day Change: -0.43 | |
| Week Change: -0.98% Year-to-date Change: -5.8% | |
| INVA Links: Profile News Message Board | |
| Charts:- Daily , Weekly | |
| Add INVA to Watchlist: View: Get Complete INVA Trend Analysis ➞ | |
 | EMBC Embecta Corp. |
| Sector: Health Care | |
| SubSector: Medical Instruments & Supplies | |
| MarketCap: 1260 Millions | |
| Recent Price: 10.15 Smart Investing & Trading Score: 35 | |
| Day Percent Change: -2.78% Day Change: -0.29 | |
| Week Change: -1.55% Year-to-date Change: -46.9% | |
| EMBC Links: Profile News Message Board | |
| Charts:- Daily , Weekly | |
| Add EMBC to Watchlist: View: Get Complete EMBC Trend Analysis ➞ | |
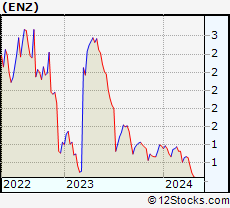 | ENZ Enzo Biochem, Inc. |
| Sector: Health Care | |
| SubSector: Medical Laboratories & Research | |
| MarketCap: 156.3 Millions | |
| Recent Price: 1.04 Smart Investing & Trading Score: 20 | |
| Day Percent Change: -2.80% Day Change: -0.03 | |
| Week Change: -0.95% Year-to-date Change: -25.2% | |
| ENZ Links: Profile News Message Board | |
| Charts:- Daily , Weekly | |
| Add ENZ to Watchlist: View: Get Complete ENZ Trend Analysis ➞ | |
 | ALLO Allogene Therapeutics, Inc. |
| Sector: Health Care | |
| SubSector: Biotechnology | |
| MarketCap: 2858.65 Millions | |
| Recent Price: 2.76 Smart Investing & Trading Score: 15 | |
| Day Percent Change: -2.82% Day Change: -0.08 | |
| Week Change: -4.5% Year-to-date Change: -14.0% | |
| ALLO Links: Profile News Message Board | |
| Charts:- Daily , Weekly | |
| Add ALLO to Watchlist: View: Get Complete ALLO Trend Analysis ➞ | |
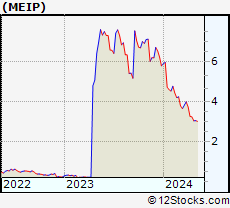 | MEIP MEI Pharma, Inc. |
| Sector: Health Care | |
| SubSector: Biotechnology | |
| MarketCap: 145.185 Millions | |
| Recent Price: 3.05 Smart Investing & Trading Score: 20 | |
| Day Percent Change: -2.87% Day Change: -0.09 | |
| Week Change: 0% Year-to-date Change: -47.4% | |
| MEIP Links: Profile News Message Board | |
| Charts:- Daily , Weekly | |
| Add MEIP to Watchlist: View: Get Complete MEIP Trend Analysis ➞ | |
 | DH Definitive Healthcare Corp. |
| Sector: Health Care | |
| SubSector: Health Information Services | |
| MarketCap: 1690 Millions | |
| Recent Price: 6.95 Smart Investing & Trading Score: 33 | |
| Day Percent Change: -2.87% Day Change: -0.21 | |
| Week Change: -0.64% Year-to-date Change: -31.0% | |
| DH Links: Profile News Message Board | |
| Charts:- Daily , Weekly | |
| Add DH to Watchlist: View: Get Complete DH Trend Analysis ➞ | |
 | NERV Minerva Neurosciences, Inc. |
| Sector: Health Care | |
| SubSector: Biotechnology | |
| MarketCap: 223.385 Millions | |
| Recent Price: 2.34 Smart Investing & Trading Score: 10 | |
| Day Percent Change: -2.90% Day Change: -0.07 | |
| Week Change: -3.98% Year-to-date Change: -62.0% | |
| NERV Links: Profile News Message Board | |
| Charts:- Daily , Weekly | |
| Add NERV to Watchlist: View: Get Complete NERV Trend Analysis ➞ | |
 | AVNS Avanos Medical, Inc. |
| Sector: Health Care | |
| SubSector: Medical Instruments & Supplies | |
| MarketCap: 1229.6 Millions | |
| Recent Price: 18.08 Smart Investing & Trading Score: 45 | |
| Day Percent Change: -2.90% Day Change: -0.54 | |
| Week Change: -0.11% Year-to-date Change: -19.4% | |
| AVNS Links: Profile News Message Board | |
| Charts:- Daily , Weekly | |
| Add AVNS to Watchlist: View: Get Complete AVNS Trend Analysis ➞ | |
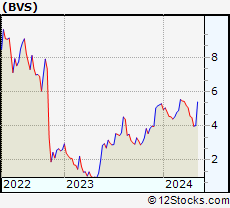 | BVS Bioventus Inc. |
| Sector: Health Care | |
| SubSector: Medical Devices | |
| MarketCap: 234 Millions | |
| Recent Price: 3.95 Smart Investing & Trading Score: 10 | |
| Day Percent Change: -2.95% Day Change: -0.12 | |
| Week Change: -0.75% Year-to-date Change: -25.3% | |
| BVS Links: Profile News Message Board | |
| Charts:- Daily , Weekly | |
| Add BVS to Watchlist: View: Get Complete BVS Trend Analysis ➞ | |
 | ALDX Aldeyra Therapeutics, Inc. |
| Sector: Health Care | |
| SubSector: Biotechnology | |
| MarketCap: 61.2785 Millions | |
| Recent Price: 3.94 Smart Investing & Trading Score: 68 | |
| Day Percent Change: -2.96% Day Change: -0.12 | |
| Week Change: 0.25% Year-to-date Change: 12.3% | |
| ALDX Links: Profile News Message Board | |
| Charts:- Daily , Weekly | |
| Add ALDX to Watchlist: View: Get Complete ALDX Trend Analysis ➞ | |
 | MEDP Medpace Holdings, Inc. |
| Sector: Health Care | |
| SubSector: Medical Laboratories & Research | |
| MarketCap: 2888.7 Millions | |
| Recent Price: 388.35 Smart Investing & Trading Score: 64 | |
| Day Percent Change: -2.96% Day Change: -11.86 | |
| Week Change: -1.91% Year-to-date Change: 26.7% | |
| MEDP Links: Profile News Message Board | |
| Charts:- Daily , Weekly | |
| Add MEDP to Watchlist: View: Get Complete MEDP Trend Analysis ➞ | |
 | EDIT Editas Medicine, Inc. |
| Sector: Health Care | |
| SubSector: Biotechnology | |
| MarketCap: 1194.95 Millions | |
| Recent Price: 5.21 Smart Investing & Trading Score: 20 | |
| Day Percent Change: -2.98% Day Change: -0.16 | |
| Week Change: -2.07% Year-to-date Change: -48.6% | |
| EDIT Links: Profile News Message Board | |
| Charts:- Daily , Weekly | |
| Add EDIT to Watchlist: View: Get Complete EDIT Trend Analysis ➞ | |
 | KYMR Kymera Therapeutics, Inc. |
| Sector: Health Care | |
| SubSector: Biotechnology | |
| MarketCap: 27087 Millions | |
| Recent Price: 33.62 Smart Investing & Trading Score: 41 | |
| Day Percent Change: -3.00% Day Change: -1.04 | |
| Week Change: 0.75% Year-to-date Change: 32.3% | |
| KYMR Links: Profile News Message Board | |
| Charts:- Daily , Weekly | |
| Add KYMR to Watchlist: View: Get Complete KYMR Trend Analysis ➞ | |
 | JYNT The Joint Corp. |
| Sector: Health Care | |
| SubSector: Hospitals | |
| MarketCap: 125.146 Millions | |
| Recent Price: 11.94 Smart Investing & Trading Score: 76 | |
| Day Percent Change: -3.01% Day Change: -0.37 | |
| Week Change: -2.37% Year-to-date Change: 24.3% | |
| JYNT Links: Profile News Message Board | |
| Charts:- Daily , Weekly | |
| Add JYNT to Watchlist: View: Get Complete JYNT Trend Analysis ➞ | |
 | ELAN Elanco Animal Health Incorporated |
| Sector: Health Care | |
| SubSector: Drugs - Generic | |
| MarketCap: 7752.15 Millions | |
| Recent Price: 13.16 Smart Investing & Trading Score: 42 | |
| Day Percent Change: -3.02% Day Change: -0.41 | |
| Week Change: -0.75% Year-to-date Change: -11.7% | |
| ELAN Links: Profile News Message Board | |
| Charts:- Daily , Weekly | |
| Add ELAN to Watchlist: View: Get Complete ELAN Trend Analysis ➞ | |
 | PRAX Praxis Precision Medicines, Inc. |
| Sector: Health Care | |
| SubSector: Biotechnology | |
| MarketCap: 16587 Millions | |
| Recent Price: 55.12 Smart Investing & Trading Score: 78 | |
| Day Percent Change: -3.06% Day Change: -1.74 | |
| Week Change: 0.58% Year-to-date Change: 145.6% | |
| PRAX Links: Profile News Message Board | |
| Charts:- Daily , Weekly | |
| Add PRAX to Watchlist: View: Get Complete PRAX Trend Analysis ➞ | |
 | ZIMV ZimVie Inc. |
| Sector: Health Care | |
| SubSector: Medical Devices | |
| MarketCap: 303 Millions | |
| Recent Price: 15.19 Smart Investing & Trading Score: 33 | |
| Day Percent Change: -3.06% Day Change: -0.48 | |
| Week Change: -3.98% Year-to-date Change: -14.3% | |
| ZIMV Links: Profile News Message Board | |
| Charts:- Daily , Weekly | |
| Add ZIMV to Watchlist: View: Get Complete ZIMV Trend Analysis ➞ | |
 | ME 23andMe Holding Co. |
| Sector: Health Care | |
| SubSector: Diagnostics & Research | |
| MarketCap: 802 Millions | |
| Recent Price: 0.50 Smart Investing & Trading Score: 69 | |
| Day Percent Change: -3.08% Day Change: -0.02 | |
| Week Change: 7.67% Year-to-date Change: -43.9% | |
| ME Links: Profile News Message Board | |
| Charts:- Daily , Weekly | |
| Add ME to Watchlist: View: Get Complete ME Trend Analysis ➞ | |
| For tabular summary view of above stock list: Summary View ➞ 0 - 25 , 25 - 50 , 50 - 75 , 75 - 100 , 100 - 125 , 125 - 150 , 150 - 175 , 175 - 200 , 200 - 225 , 225 - 250 , 250 - 275 , 275 - 300 , 300 - 325 , 325 - 350 , 350 - 375 , 375 - 400 , 400 - 425 , 425 - 450 , 450 - 475 , 475 - 500 , 500 - 525 , 525 - 550 , 550 - 575 , 575 - 600 , 600 - 625 , 625 - 650 , 650 - 675 , 675 - 700 , 700 - 725 | ||
| Click To Change The Sort Order: By Market Cap or Company Size Performance: Year-to-date, Week and Day | |
| Select Chart Type: | ||
|
Best Stocks Today 12Stocks.com |
© 2024 12Stocks.com Terms & Conditions Privacy Contact Us
All Information Provided Only For Education And Not To Be Used For Investing or Trading. See Terms & Conditions


One More Thing ... Get Best Stocks Delivered Daily!
Never Ever Miss A Move With Our Top Ten Stocks Lists
Find Best Stocks In Any Market - Bull or Bear Market
Take A Peek At Our Top Ten Stocks Lists: Daily, Weekly, Year-to-Date & Top Trends
Find Best Stocks In Any Market - Bull or Bear Market
Take A Peek At Our Top Ten Stocks Lists: Daily, Weekly, Year-to-Date & Top Trends
Healthcare Stocks With Best Up Trends [0-bearish to 100-bullish]: Concord [100], Tenet [100], Day One[100], DaVita [100], PTC [100], Cullinan Oncology[100], Perrigo [100], Phibro Animal[100], Xencor [100], Agios [100], Lantheus [100]
Best Healthcare Stocks Year-to-Date:
Pieris [6405.49%], Avenue [3011.8%], Precision BioSciences[2752.05%], Inovio [2145.1%], Aurora Cannabis[1838.26%], Assembly Biosciences[1420.55%], Agenus [1363.94%], Adverum Biotechnologies[1245.64%], NuCana [1238.74%], Affimed N.V[758.4%], CareMax [625.77%] Best Healthcare Stocks This Week:
Deciphera [72.49%], Canopy Growth[67%], GeneDx [54.42%], Concord [44.02%], Cue Biopharma[39.19%], Tilray [38.76%], Aurora Cannabis[37.76%], Phibro Animal[31.19%], Abeona [26.99%], Bright Green[25.75%], Exscientia [22.06%] Best Healthcare Stocks Daily:
Canopy Growth[78.85%], GeneDx [55.55%], Aurora Cannabis[46.04%], Tilray [38.76%], Cue Biopharma[33.80%], Bright Green[26.32%], Concord [25.00%], Abeona [20.35%], Cronos [15.29%], AnaptysBio [14.27%], OrganiGram [13.37%]