
 Login Sign Up


| |||||
 |  | ||||

| 12Stocks.com Market Intelligence |
Best Healthcare Stocks
 | "Discover best trending healthcare stocks with 12Stocks.com." |
| - Subu Vdaygiri, Founder, 12Stocks.com |
| In a hurry? Healthcare Stocks Lists: Performance Trends Table, Stock Charts
Sort Healthcare stocks: Daily, Weekly, Year-to-Date, Market Cap & Trends. Filter Healthcare stocks list by size:All Healthcare Large Mid-Range Small |
| 12Stocks.com Healthcare Stocks Performances & Trends Daily | |||||||||
|
|  The overall Smart Investing & Trading Score is 60 (0-bearish to 100-bullish) which puts Healthcare sector in short term neutral to bullish trend. The Smart Investing & Trading Score from previous trading session is 30 and an improvement of trend continues.
| ||||||||
Here are the Smart Investing & Trading Scores of the most requested Healthcare stocks at 12Stocks.com (click stock name for detailed review):
|


| 12Stocks.com: Investing in Healthcare sector with Stocks | |
|
The following table helps investors and traders sort through current performance and trends (as measured by Smart Investing & Trading Score) of various
stocks in the Healthcare sector. Quick View: Move mouse or cursor over stock symbol (ticker) to view short-term Technical chart and over stock name to view long term chart. Click on  to add stock symbol to your watchlist and to add stock symbol to your watchlist and  to view watchlist. Click on any ticker or stock name for detailed market intelligence report for that stock. to view watchlist. Click on any ticker or stock name for detailed market intelligence report for that stock. |
12Stocks.com Performance of Stocks in Healthcare Sector
| Ticker | Stock Name | Watchlist | Category | Recent Price | Smart Investing & Trading Score | Change % | YTD Change% |
| CVS | CVS Health |   | Insurance | 67.71 | 32 | 0.39 | -14.25% |
| NHC | National | | Long-Term | 90.87 | 40 | 0.39 | -1.68% |
| VYGR | Voyager | | Biotechnology | 7.80 | 65 | 0.39 | -7.58% |
| FENC | Fennec | | Biotechnology | 9.18 | 25 | 0.38 | -18.23% |
| IMRX | Immuneering | | Biotechnology | 1.49 | 15 | 0.34 | -80.43% |
| BCYC | Bicycle | | Biotechnology | 23.49 | 90 | 0.34 | 29.92% |
| CYH | Community Health | | Hospitals | 3.30 | 67 | 0.30 | 5.43% |
| PBYI | Puma Biotechnology | | Biotechnology | 5.04 | 51 | 0.30 | 16.28% |
| RPHM | Reneo | | Biotechnology | 1.68 | 48 | 0.30 | 3.40% |
| AGTI | Agiliti | | Health Information | 10.15 | 75 | 0.30 | 28.81% |
| SNY | Sanofi | | Pharmaceutical | 49.23 | 67 | 0.29 | -1.01% |
| BTMD | biote | | Medical Care Facilities | 5.50 | 36 | 0.27 | 10.79% |
| CHE | Chemed | | Home Care | 568.00 | 7 | 0.26 | -2.86% |
| AMED | Amedisys | | Home Care | 92.05 | 55 | 0.23 | -3.17% |
| FUSN | Fusion | | Biotechnology | 21.45 | 54 | 0.23 | 123.44% |
| AIH | Aesthetic | | Specialized | 0.45 | 40 | 0.22 | -34.74% |
| AVAH | Aveanna | | Medical Care Facilities | 2.25 | 27 | 0.22 | -16.33% |
| LBPH | Longboard | | Biotechnology | 21.27 | 87 | 0.21 | 248.20% |
| RBOT | Vicarious Surgical | | Medical Devices | 0.28 | 54 | 0.21 | -23.50% |
| CRMD | CorMedix | | Biotechnology | 5.29 | 43 | 0.19 | 40.69% |
| DVAX | Dynavax Technologies | | Biotechnology | 11.36 | 27 | 0.18 | -18.74% |
| SWAV | ShockWave | | Equipment | 330.11 | 68 | 0.18 | 73.23% |
| CI | Cigna | | Insurance | 357.04 | 83 | 0.17 | 19.23% |
| AVXL | Anavex Life | | Biotechnology | 3.65 | 42 | 0.14 | -60.74% |
| MIRM | Mirum | | Biotechnology | 25.11 | 57 | 0.14 | -14.96% |
| For chart view version of above stock list: Chart View ➞ 0 - 25 , 25 - 50 , 50 - 75 , 75 - 100 , 100 - 125 , 125 - 150 , 150 - 175 , 175 - 200 , 200 - 225 , 225 - 250 , 250 - 275 , 275 - 300 , 300 - 325 , 325 - 350 , 350 - 375 , 375 - 400 , 400 - 425 , 425 - 450 , 450 - 475 , 475 - 500 , 500 - 525 , 525 - 550 , 550 - 575 , 575 - 600 , 600 - 625 , 625 - 650 , 650 - 675 , 675 - 700 , 700 - 725 | ||
 | Click To Change The Sort Order: By Market Cap or Company Size Performance: Year-to-date, Week and Day |  |
|
Get the most comprehensive stock market coverage daily at 12Stocks.com ➞ Best Stocks Today ➞ Best Stocks Weekly ➞ Best Stocks Year-to-Date ➞ Best Stocks Trends ➞  Best Stocks Today 12Stocks.com Best Nasdaq Stocks ➞ Best S&P 500 Stocks ➞ Best Tech Stocks ➞ Best Biotech Stocks ➞ |
| Detailed Overview of Healthcare Stocks |
| Healthcare Technical Overview, Leaders & Laggards, Top Healthcare ETF Funds & Detailed Healthcare Stocks List, Charts, Trends & More |
| Healthcare Sector: Technical Analysis, Trends & YTD Performance | |
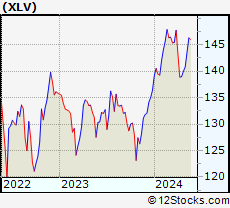
| Healthcare sector is composed of stocks
from pharmaceutical, biotech, diagnostics labs, insurance providers
and healthcare services. Healthcare sector, as represented by XLV, an exchange-traded fund [ETF] that holds basket of Healthcare stocks (e.g, Merck, Amgen) is up by 2.9% and is currently underperforming the overall market by -1.9% year-to-date. Below is a quick view of Technical charts and trends: |
|
 XLV Weekly Chart |
|
| Long Term Trend: Good | |
| Medium Term Trend: Good | |
 XLV Daily Chart |
|
| Short Term Trend: Very Good | |
| Overall Trend Score: 60 | |
| YTD Performance: 2.9% | |
| **Trend Scores & Views Are Only For Educational Purposes And Not For Investing | |
| 12Stocks.com: Top Performing Healthcare Sector Stocks | ||||||||||||||||||||||||||||||||||||||||||||||||
 The top performing Healthcare sector stocks year to date are
Now, more recently, over last week, the top performing Healthcare sector stocks on the move are


|
||||||||||||||||||||||||||||||||||||||||||||||||
| 12Stocks.com: Investing in Healthcare Sector using Exchange Traded Funds | |
|
The following table shows list of key exchange traded funds (ETF) that
help investors track Healthcare Index. For detailed view, check out our ETF Funds section of our website. Quick View: Move mouse or cursor over ETF symbol (ticker) to view short-term Technical chart and over ETF name to view long term chart. Click on ticker or stock name for detailed view. Click on to add stock symbol to your watchlist and to view watchlist. |
12Stocks.com List of ETFs that track Healthcare Index
| Ticker | ETF Name | Watchlist | Recent Price | Smart Investing & Trading Score | Change % | Week % | Year-to-date % |
| XLV | Health Care | | 140.33 | 60 | -0.07 | 0.26 | 2.9% |
| XBI | Biotech | | 84.53 | 42 | -1.16 | 1.25 | -5.33% |
| IBB | Biotechnology | | 126.89 | 49 | -1.15 | 0.32 | -6.6% |
| BBH | Biotech | | 156.43 | 57 | -0.59 | 0.5 | -5.37% |
| VHT | Health Care | | 256.48 | 52 | -0.03 | 0.45 | 2.3% |
| IYH | Healthcare | | 58.84 | 70 | -0.04 | 0.38 | 2.77% |
| IHF | Healthcare Providers | | 51.84 | 53 | -0.42 | -0.15 | -1.28% |
| IHI | Medical Devices | | 55.03 | 30 | -1.43 | -0.9 | 1.96% |
| BIB | Biotechnology | | 50.54 | 42 | -2.38 | 1.77 | -11.41% |
| BIS | Short Biotech | | 19.54 | 44 | -0.05 | -3.36 | 8.14% |
| XHE | Health Care Equipment | | 82.11 | 28 | -1.27 | -0.39 | -2.55% |
| CURE | Healthcare Bull 3X | | 105.91 | 64 | -0.32 | 0.57 | 4.1% |
| LABU | Biotech Bull 3X | | 90.77 | 35 | -3.55 | 3.73 | -25.58% |
| LABD | Biotech Bear 3X | | 10.09 | 37 | 4.13 | -4.09 | 4.13% |
| PSCH | SmallCap Health Care | | 40.95 | 68 | -1.18 | 0.61 | -4.32% |
| XHS | Health Care Services | | 88.68 | 83 | -0.19 | 0.92 | -0.3% |
| PTH | DWA Healthcare Momentum | | 40.94 | 55 | 2.66 | 2.63 | 4.6% |
| BTEC | Principal Healthcare Innovators | | 35.10 | 49 | 0.75 | 2.48 | -3.39% |
| RXL | Health Care | | 95.00 | 54 | 0.89 | 0.18 | 3.93% |
| RXD | Short Health Care | | 11.36 | 30 | -0.35 | -0.79 | -4.74% |
| 12Stocks.com: Charts, Trends, Fundamental Data and Performances of Healthcare Stocks | |
|
We now take in-depth look at all Healthcare stocks including charts, multi-period performances and overall trends (as measured by Smart Investing & Trading Score). One can sort Healthcare stocks (click link to choose) by Daily, Weekly and by Year-to-Date performances. Also, one can sort by size of the company or by market capitalization. |
| Select Your Default Chart Type: | |||||
| |||||
| Click on stock symbol or name for detailed view. Click on to add stock symbol to your watchlist and to view watchlist. Quick View: Move mouse or cursor over "Daily" to quickly view daily Technical stock chart and over "Weekly" to view weekly Technical stock chart. | |||||

 | CVS CVS Health Corporation |
| Sector: Health Care | |
| SubSector: Health Care Plans | |
| MarketCap: 80104.3 Millions | |
| Recent Price: 67.71 Smart Investing & Trading Score: 32 | |
| Day Percent Change: 0.39% Day Change: 0.26 | |
| Week Change: 0.79% Year-to-date Change: -14.3% | |
| CVS Links: Profile News Message Board | |
| Charts:- Daily , Weekly | |
| Add CVS to Watchlist: View: Get Complete CVS Trend Analysis ➞ | |
 | NHC National HealthCare Corporation |
| Sector: Health Care | |
| SubSector: Long-Term Care Facilities | |
| MarketCap: 1164.86 Millions | |
| Recent Price: 90.87 Smart Investing & Trading Score: 40 | |
| Day Percent Change: 0.39% Day Change: 0.35 | |
| Week Change: -0.45% Year-to-date Change: -1.7% | |
| NHC Links: Profile News Message Board | |
| Charts:- Daily , Weekly | |
| Add NHC to Watchlist: View: Get Complete NHC Trend Analysis ➞ | |
 | VYGR Voyager Therapeutics, Inc. |
| Sector: Health Care | |
| SubSector: Biotechnology | |
| MarketCap: 321.085 Millions | |
| Recent Price: 7.80 Smart Investing & Trading Score: 65 | |
| Day Percent Change: 0.39% Day Change: 0.03 | |
| Week Change: 2.36% Year-to-date Change: -7.6% | |
| VYGR Links: Profile News Message Board | |
| Charts:- Daily , Weekly | |
| Add VYGR to Watchlist: View: Get Complete VYGR Trend Analysis ➞ | |
 | FENC Fennec Pharmaceuticals Inc. |
| Sector: Health Care | |
| SubSector: Biotechnology | |
| MarketCap: 126.785 Millions | |
| Recent Price: 9.18 Smart Investing & Trading Score: 25 | |
| Day Percent Change: 0.38% Day Change: 0.04 | |
| Week Change: -0.38% Year-to-date Change: -18.2% | |
| FENC Links: Profile News Message Board | |
| Charts:- Daily , Weekly | |
| Add FENC to Watchlist: View: Get Complete FENC Trend Analysis ➞ | |
 | IMRX Immuneering Corporation |
| Sector: Health Care | |
| SubSector: Biotechnology | |
| MarketCap: 303 Millions | |
| Recent Price: 1.49 Smart Investing & Trading Score: 15 | |
| Day Percent Change: 0.34% Day Change: 0.01 | |
| Week Change: 1.02% Year-to-date Change: -80.4% | |
| IMRX Links: Profile News Message Board | |
| Charts:- Daily , Weekly | |
| Add IMRX to Watchlist: View: Get Complete IMRX Trend Analysis ➞ | |
 | BCYC Bicycle Therapeutics plc |
| Sector: Health Care | |
| SubSector: Biotechnology | |
| MarketCap: 214.485 Millions | |
| Recent Price: 23.49 Smart Investing & Trading Score: 90 | |
| Day Percent Change: 0.34% Day Change: 0.08 | |
| Week Change: 3.34% Year-to-date Change: 29.9% | |
| BCYC Links: Profile News Message Board | |
| Charts:- Daily , Weekly | |
| Add BCYC to Watchlist: View: Get Complete BCYC Trend Analysis ➞ | |
 | CYH Community Health Systems, Inc. |
| Sector: Health Care | |
| SubSector: Hospitals | |
| MarketCap: 371.546 Millions | |
| Recent Price: 3.30 Smart Investing & Trading Score: 67 | |
| Day Percent Change: 0.30% Day Change: 0.01 | |
| Week Change: -2.65% Year-to-date Change: 5.4% | |
| CYH Links: Profile News Message Board | |
| Charts:- Daily , Weekly | |
| Add CYH to Watchlist: View: Get Complete CYH Trend Analysis ➞ | |
 | PBYI Puma Biotechnology, Inc. |
| Sector: Health Care | |
| SubSector: Biotechnology | |
| MarketCap: 385.585 Millions | |
| Recent Price: 5.04 Smart Investing & Trading Score: 51 | |
| Day Percent Change: 0.30% Day Change: 0.02 | |
| Week Change: 0.3% Year-to-date Change: 16.3% | |
| PBYI Links: Profile News Message Board | |
| Charts:- Daily , Weekly | |
| Add PBYI to Watchlist: View: Get Complete PBYI Trend Analysis ➞ | |
 | RPHM Reneo Pharmaceuticals, Inc. |
| Sector: Health Care | |
| SubSector: Biotechnology | |
| MarketCap: 233 Millions | |
| Recent Price: 1.68 Smart Investing & Trading Score: 48 | |
| Day Percent Change: 0.30% Day Change: 0.01 | |
| Week Change: 0.3% Year-to-date Change: 3.4% | |
| RPHM Links: Profile News Message Board | |
| Charts:- Daily , Weekly | |
| Add RPHM to Watchlist: View: Get Complete RPHM Trend Analysis ➞ | |
 | AGTI Agiliti, Inc. |
| Sector: Health Care | |
| SubSector: Health Information Services | |
| MarketCap: 2270 Millions | |
| Recent Price: 10.15 Smart Investing & Trading Score: 75 | |
| Day Percent Change: 0.30% Day Change: 0.03 | |
| Week Change: 1% Year-to-date Change: 28.8% | |
| AGTI Links: Profile News Message Board | |
| Charts:- Daily , Weekly | |
| Add AGTI to Watchlist: View: Get Complete AGTI Trend Analysis ➞ | |
 | SNY Sanofi |
| Sector: Health Care | |
| SubSector: Drug Manufacturers - Major | |
| MarketCap: 104761 Millions | |
| Recent Price: 49.23 Smart Investing & Trading Score: 67 | |
| Day Percent Change: 0.29% Day Change: 0.14 | |
| Week Change: 0.2% Year-to-date Change: -1.0% | |
| SNY Links: Profile News Message Board | |
| Charts:- Daily , Weekly | |
| Add SNY to Watchlist: View: Get Complete SNY Trend Analysis ➞ | |
 | BTMD biote Corp. |
| Sector: Health Care | |
| SubSector: Medical Care Facilities | |
| MarketCap: 468 Millions | |
| Recent Price: 5.50 Smart Investing & Trading Score: 36 | |
| Day Percent Change: 0.27% Day Change: 0.01 | |
| Week Change: -0.45% Year-to-date Change: 10.8% | |
| BTMD Links: Profile News Message Board | |
| Charts:- Daily , Weekly | |
| Add BTMD to Watchlist: View: Get Complete BTMD Trend Analysis ➞ | |
 | CHE Chemed Corporation |
| Sector: Health Care | |
| SubSector: Home Health Care | |
| MarketCap: 6148.95 Millions | |
| Recent Price: 568.00 Smart Investing & Trading Score: 7 | |
| Day Percent Change: 0.26% Day Change: 1.49 | |
| Week Change: 1.35% Year-to-date Change: -2.9% | |
| CHE Links: Profile News Message Board | |
| Charts:- Daily , Weekly | |
| Add CHE to Watchlist: View: Get Complete CHE Trend Analysis ➞ | |
 | AMED Amedisys, Inc. |
| Sector: Health Care | |
| SubSector: Home Health Care | |
| MarketCap: 6058.95 Millions | |
| Recent Price: 92.05 Smart Investing & Trading Score: 55 | |
| Day Percent Change: 0.23% Day Change: 0.21 | |
| Week Change: 0.28% Year-to-date Change: -3.2% | |
| AMED Links: Profile News Message Board | |
| Charts:- Daily , Weekly | |
| Add AMED to Watchlist: View: Get Complete AMED Trend Analysis ➞ | |
 | FUSN Fusion Pharmaceuticals Inc. |
| Sector: Health Care | |
| SubSector: Biotechnology | |
| MarketCap: 52487 Millions | |
| Recent Price: 21.45 Smart Investing & Trading Score: 54 | |
| Day Percent Change: 0.23% Day Change: 0.05 | |
| Week Change: 0.14% Year-to-date Change: 123.4% | |
| FUSN Links: Profile News Message Board | |
| Charts:- Daily , Weekly | |
| Add FUSN to Watchlist: View: Get Complete FUSN Trend Analysis ➞ | |
 | AIH Aesthetic Medical International Holdings Group Limited |
| Sector: Health Care | |
| SubSector: Specialized Health Services | |
| MarketCap: 205.356 Millions | |
| Recent Price: 0.45 Smart Investing & Trading Score: 40 | |
| Day Percent Change: 0.22% Day Change: 0.00 | |
| Week Change: 4.63% Year-to-date Change: -34.7% | |
| AIH Links: Profile News Message Board | |
| Charts:- Daily , Weekly | |
| Add AIH to Watchlist: View: Get Complete AIH Trend Analysis ➞ | |
 | AVAH Aveanna Healthcare Holdings Inc. |
| Sector: Health Care | |
| SubSector: Medical Care Facilities | |
| MarketCap: 305 Millions | |
| Recent Price: 2.25 Smart Investing & Trading Score: 27 | |
| Day Percent Change: 0.22% Day Change: 0.00 | |
| Week Change: 2.5% Year-to-date Change: -16.3% | |
| AVAH Links: Profile News Message Board | |
| Charts:- Daily , Weekly | |
| Add AVAH to Watchlist: View: Get Complete AVAH Trend Analysis ➞ | |
 | LBPH Longboard Pharmaceuticals, Inc. |
| Sector: Health Care | |
| SubSector: Biotechnology | |
| MarketCap: 169 Millions | |
| Recent Price: 21.27 Smart Investing & Trading Score: 87 | |
| Day Percent Change: 0.21% Day Change: 0.04 | |
| Week Change: 7.89% Year-to-date Change: 248.2% | |
| LBPH Links: Profile News Message Board | |
| Charts:- Daily , Weekly | |
| Add LBPH to Watchlist: View: Get Complete LBPH Trend Analysis ➞ | |
 | RBOT Vicarious Surgical Inc. |
| Sector: Health Care | |
| SubSector: Medical Devices | |
| MarketCap: 241 Millions | |
| Recent Price: 0.28 Smart Investing & Trading Score: 54 | |
| Day Percent Change: 0.21% Day Change: 0.00 | |
| Week Change: 3.93% Year-to-date Change: -23.5% | |
| RBOT Links: Profile News Message Board | |
| Charts:- Daily , Weekly | |
| Add RBOT to Watchlist: View: Get Complete RBOT Trend Analysis ➞ | |
 | CRMD CorMedix, Inc. |
| Sector: Health Care | |
| SubSector: Biotechnology | |
| MarketCap: 90.7785 Millions | |
| Recent Price: 5.29 Smart Investing & Trading Score: 43 | |
| Day Percent Change: 0.19% Day Change: 0.01 | |
| Week Change: -0.38% Year-to-date Change: 40.7% | |
| CRMD Links: Profile News Message Board | |
| Charts:- Daily , Weekly | |
| Add CRMD to Watchlist: View: Get Complete CRMD Trend Analysis ➞ | |
 | DVAX Dynavax Technologies Corporation |
| Sector: Health Care | |
| SubSector: Biotechnology | |
| MarketCap: 276.885 Millions | |
| Recent Price: 11.36 Smart Investing & Trading Score: 27 | |
| Day Percent Change: 0.18% Day Change: 0.02 | |
| Week Change: 1.34% Year-to-date Change: -18.7% | |
| DVAX Links: Profile News Message Board | |
| Charts:- Daily , Weekly | |
| Add DVAX to Watchlist: View: Get Complete DVAX Trend Analysis ➞ | |
 | SWAV ShockWave Medical, Inc. |
| Sector: Health Care | |
| SubSector: Medical Appliances & Equipment | |
| MarketCap: 855.58 Millions | |
| Recent Price: 330.11 Smart Investing & Trading Score: 68 | |
| Day Percent Change: 0.18% Day Change: 0.60 | |
| Week Change: 0.03% Year-to-date Change: 73.2% | |
| SWAV Links: Profile News Message Board | |
| Charts:- Daily , Weekly | |
| Add SWAV to Watchlist: View: Get Complete SWAV Trend Analysis ➞ | |
 | CI Cigna Corporation |
| Sector: Health Care | |
| SubSector: Health Care Plans | |
| MarketCap: 60251.8 Millions | |
| Recent Price: 357.04 Smart Investing & Trading Score: 83 | |
| Day Percent Change: 0.17% Day Change: 0.60 | |
| Week Change: 0.73% Year-to-date Change: 19.2% | |
| CI Links: Profile News Message Board | |
| Charts:- Daily , Weekly | |
| Add CI to Watchlist: View: Get Complete CI Trend Analysis ➞ | |
 | AVXL Anavex Life Sciences Corp. |
| Sector: Health Care | |
| SubSector: Biotechnology | |
| MarketCap: 175.985 Millions | |
| Recent Price: 3.65 Smart Investing & Trading Score: 42 | |
| Day Percent Change: 0.14% Day Change: 0.00 | |
| Week Change: 6.25% Year-to-date Change: -60.7% | |
| AVXL Links: Profile News Message Board | |
| Charts:- Daily , Weekly | |
| Add AVXL to Watchlist: View: Get Complete AVXL Trend Analysis ➞ | |
 | MIRM Mirum Pharmaceuticals, Inc. |
| Sector: Health Care | |
| SubSector: Biotechnology | |
| MarketCap: 309.585 Millions | |
| Recent Price: 25.11 Smart Investing & Trading Score: 57 | |
| Day Percent Change: 0.14% Day Change: 0.04 | |
| Week Change: 2.64% Year-to-date Change: -15.0% | |
| MIRM Links: Profile News Message Board | |
| Charts:- Daily , Weekly | |
| Add MIRM to Watchlist: View: Get Complete MIRM Trend Analysis ➞ | |
| For tabular summary view of above stock list: Summary View ➞ 0 - 25 , 25 - 50 , 50 - 75 , 75 - 100 , 100 - 125 , 125 - 150 , 150 - 175 , 175 - 200 , 200 - 225 , 225 - 250 , 250 - 275 , 275 - 300 , 300 - 325 , 325 - 350 , 350 - 375 , 375 - 400 , 400 - 425 , 425 - 450 , 450 - 475 , 475 - 500 , 500 - 525 , 525 - 550 , 550 - 575 , 575 - 600 , 600 - 625 , 625 - 650 , 650 - 675 , 675 - 700 , 700 - 725 | ||
| Click To Change The Sort Order: By Market Cap or Company Size Performance: Year-to-date, Week and Day | |
| Select Chart Type: | ||
|
Best Stocks Today 12Stocks.com |
© 2024 12Stocks.com Terms & Conditions Privacy Contact Us
All Information Provided Only For Education And Not To Be Used For Investing or Trading. See Terms & Conditions


One More Thing ... Get Best Stocks Delivered Daily!
Never Ever Miss A Move With Our Top Ten Stocks Lists
Find Best Stocks In Any Market - Bull or Bear Market
Take A Peek At Our Top Ten Stocks Lists: Daily, Weekly, Year-to-Date & Top Trends
Find Best Stocks In Any Market - Bull or Bear Market
Take A Peek At Our Top Ten Stocks Lists: Daily, Weekly, Year-to-Date & Top Trends
Healthcare Stocks With Best Up Trends [0-bearish to 100-bullish]: Tenet [100], Day One[100], Tandem Diabetes[100], Fresenius [100], Haleon [100], DaVita [100], PTC [100], Cullinan Oncology[100], Perrigo [100], Phibro Animal[100], Xencor [100]
Best Healthcare Stocks Year-to-Date:
Pieris [6405.49%], Avenue [3033.54%], Precision BioSciences[2754.79%], Inovio [2147.06%], Aurora Cannabis[1844.56%], Assembly Biosciences[1400.43%], Agenus [1362.13%], Adverum Biotechnologies[1245.64%], NuCana [1201.56%], Affimed N.V[758.4%], CareMax [625.77%] Best Healthcare Stocks This Week:
Deciphera [72.49%], Canopy Growth[67%], GeneDx [54.42%], Cue Biopharma[39.19%], Tilray [39.04%], Aurora Cannabis[38.21%], Concord [37.24%], Phibro Animal[31.15%], Abeona [27.3%], Bright Green[25.75%], Exscientia [22.06%] Best Healthcare Stocks Daily:
Canopy Growth[78.85%], GeneDx [55.55%], Aurora Cannabis[46.52%], Tilray [39.04%], Cue Biopharma[33.80%], Bright Green[26.32%], Abeona [20.64%], Concord [19.12%], Cronos [15.29%], AnaptysBio [14.58%], OrganiGram [13.37%]