
 Login Sign Up


| |||||
 |  | ||||

| 12Stocks.com Market Intelligence |
Stock Charts, Performance & Trend Analysis for BBBY
Bed Bath & Beyond Inc
|
| |||||||||||||||||||
 ➞
➞ ➞
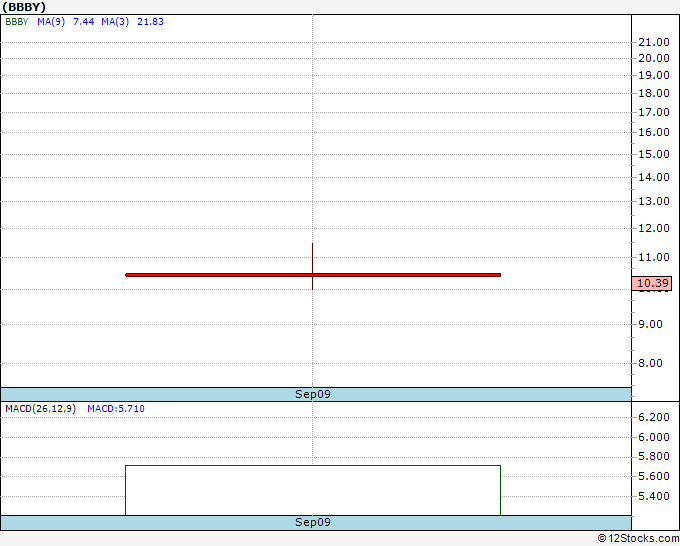
➞September 13, 2025 - The year-to-date (YTD) return or performance of Bed Bath (BBBY) is down -6.48065% and is underperforming the overall stock market by -19.33165%.
Recently, the weekly return of Bed Bath (BBBY) is down -81.0781% and is underperforming the overall market by -82.38066%.
Although long and mid term trends for Bed Bath & Beyond Inc looks good, the short term trends are deteriorating.
The overall 12Stocks.com Smart Investing & Trading Score is 20 (measures stock trend from 0-bearish to 100-bullish) which puts BBBY in short term bearish trend.
The Smart Investing & Trading Score from previous trading session is 70 and a deterioration of trend continues. Scroll down for key technical charts, support & resistance levels and analysis for Bed Bath.
| Stock Analysis for BBBY | |||||||
| Name: Bed Bath & Beyond Inc | |||||||
| Sector: Services & Goods | |||||||
| SubSector: Internet Retail | |||||||
| In A Glance Bed Bath (BBBY) Stock Performance and Technical Trend Chart View | |||||||
| |||||||
Weekly BBBY Technical Chart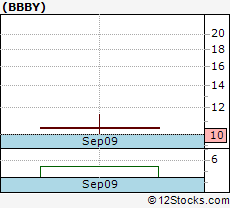 Daily BBBY Technical Chart 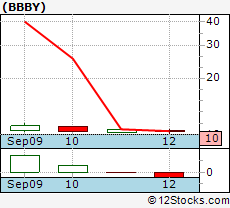 Add BBBY To Watch List View List | |||||||
| 12Stocks.com Short Term Trend Analysis for BBBY | |||||||
| 20 / 100 | |||||||
| The current technical trend score is 20 in a scale where 0 is bearish and 100 is bullish. | |||||||
| The technical trend score from previous session is 20. | |||||||
| Trend score updated daily. Not to be used for investing. | |||||||
Stocks Similar To Bed Bath
|
|
|
|
Get the most comprehensive stock market coverage daily at 12Stocks.com ➞ Best Stocks Today ➞ Best Stocks Weekly ➞ Best Stocks Year-to-Date ➞ Best Stocks Trends ➞  Best Stocks Today 12Stocks.com Best Nasdaq Stocks ➞ Best S&P 500 Stocks ➞ Best Tech Stocks ➞ Best Biotech Stocks ➞ |
© 2025 12Stocks.com Terms & Conditions Privacy Contact Us
All Information Provided Only For Education And Not To Be Used For Investing or Trading. See Terms & Conditions


One More Thing ... Get Best Stocks Delivered Daily!
Never Ever Miss A Move With Our Top Ten Stocks Lists
Get Best Performing Stocks, Daily Market Trends & Insight
Take A Peek At Our Top Ten Stocks Lists: Daily, Weekly, Year-to-Date & Top Trends
Get Best Performing Stocks, Daily Market Trends & Insight
Take A Peek At Our Top Ten Stocks Lists: Daily, Weekly, Year-to-Date & Top Trends
Dow Stocks With Best Current Trends [0-bearish to 100-bullish]: Home Depot[100], Travelers [100], Goldman Sachs[100], Chase[90], S&P[90], Unitedhealth [90], Microsoft [80], Walmart Inc[80], Exxon Mobil[80], 3M Co[80] Best S&P 500 Stocks Year-to-Date Update:
Seagate [129.939%], Western Digital[109.221%], Newmont Corp[108.758%], Warner Bros.[83.62%], Micron [80.4454%], NRG Energy[79.6843%], Oracle Corp[77.4466%], CVS Health[75.3787%], Amphenol Corp[72.7257%], GE Aerospace[67.6417%] Best Nasdaq 100 Stocks Weekly Update:
Warner Bros.[58.3%], Splunk [38.7643%], Micron [26.584%], Broadcom Inc[17.5662%], Tesla Inc[16.9793%], Lam Research[16.4708%], KLA Corp[10.3894%], ASML Holding[8.02198%], Applied Materials[6.04146%], QQQ[5.72552%] Today's Stock Market In A Nutshell:Oil [0.4%], Gold [0.2%], US Dollar [0.1%], India [0.1%], Euro [0%], US Large Cap [-0%], Emerging Markets [-0.1%], Bonds [-0.1%], Europe [-0.4%], China [-0.6%], US Small Cap [-1%], US Mid Cap [-1.1%],