
 Login Sign Up


| |||||
 |  | ||||

| 12Stocks.com Market Intelligence |
Stock Charts, Performance & Trend Analysis for EEMA
iShares MSCI Emerging Markets Asia
|
| |||||||||||||||||||
 ➞
➞ ➞
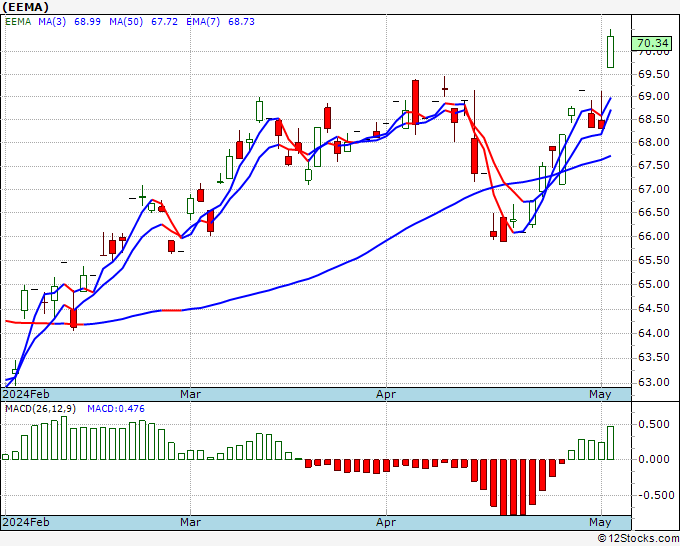
➞August 23, 2025 - The year-to-date (YTD) return or performance of (EEMA) is up 19.2% and is outperforming the overall stock market by 11.95%.
Recently, the weekly return of (EEMA) is down -0.32% and is underperforming the overall market by -0.86%.
All trends (long term, mid-term and short term) for iShares MSCI Emerging Markets Asia looks good.
The overall 12Stocks.com Smart Investing & Trading Score is 90 (measures stock trend from 0-bearish to 100-bullish) which puts EEMA in short term bullish trend.
The Smart Investing & Trading Score from previous trading session is 60 and hence a significant improvement of trend. Scroll down for key technical charts, support & resistance levels and analysis for .
| Stock Analysis for EEMA | |||||||
| Name: iShares MSCI Emerging Markets Asia | |||||||
| Sector: ETF | |||||||
| SubSector: Exchange Traded Fund | |||||||
| In A Glance (EEMA) Stock Performance and Technical Trend Chart View | |||||||
| |||||||
Weekly EEMA Technical Chart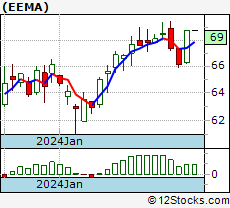 Daily EEMA Technical Chart 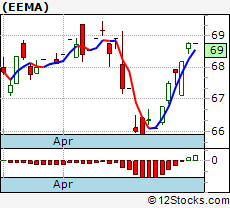 Add EEMA To Watch List View List | |||||||
| 12Stocks.com Short Term Trend Analysis for EEMA | |||||||
| 90 / 100 | |||||||
| The current technical trend score is 90 in a scale where 0 is bearish and 100 is bullish. | |||||||
| The technical trend score from previous session is 60. | |||||||
| Trend score updated daily. Not to be used for investing. | |||||||
Stocks Similar To
|
|
|
|
Get the most comprehensive stock market coverage daily at 12Stocks.com ➞ Best Stocks Today ➞ Best Stocks Weekly ➞ Best Stocks Year-to-Date ➞ Best Stocks Trends ➞  Best Stocks Today 12Stocks.com Best Nasdaq Stocks ➞ Best S&P 500 Stocks ➞ Best Tech Stocks ➞ Best Biotech Stocks ➞ |
© 2025 12Stocks.com Terms & Conditions Privacy Contact Us
All Information Provided Only For Education And Not To Be Used For Investing or Trading. See Terms & Conditions


One More Thing ... Get Best Stocks Delivered Daily!
Never Ever Miss A Move With Our Top Ten Stocks Lists
Get Best Performing Stocks, Daily Market Trends & Insight
Take A Peek At Our Top Ten Stocks Lists: Daily, Weekly, Year-to-Date & Top Trends
Get Best Performing Stocks, Daily Market Trends & Insight
Take A Peek At Our Top Ten Stocks Lists: Daily, Weekly, Year-to-Date & Top Trends
Dow Stocks With Best Current Trends [0-bearish to 100-bullish]: [100], Home Depot[100], Merck [100], McDonald s[100], Caterpillar [90], Goldman Sachs[90], American Express[90], NIKE [90], Chevron [90], Chase[90] Best S&P 500 Stocks Year-to-Date Update:
Seagate [81.55%], Newmont [67.44%], Western Digital[65.96%], NRG Energy[63.49%], eBay [60.95%], Amphenol [57.36%], Uber [56.22%], IDEXX [53.12%], Tapestry [51.93%], Dollar General[51.26%] Best Nasdaq 100 Stocks Weekly Update:
Pinduoduo [7.16%], Texas [5.91%], Regeneron [5.69%], Palo Alto[5.63%], Booking [4.89%], Analog Devices[4.55%], Datadog [3.72%], MongoDB [3.71%], Cognizant [3.39%], T-Mobile [3.14%] Today's Stock Market In A Nutshell:US Small Cap [3.9%], US Mid Cap [2.8%], China [2.3%], Emerging Markets [2%], US Large Cap [1.5%], Gold [1.1%], Euro [1.1%], Oil [0.7%], Bonds [0.5%], Europe [-0.7%], US Dollar [-0.9%],