
 Login Sign Up


| |||||
 |  | ||||

| 12Stocks.com Market Intelligence |
Stock Charts, Performance & Trend Analysis for EEMA
iShares MSCI Emerging Markets Asia ETF
|
| |||||||||||||||||||
 ➞
➞ ➞
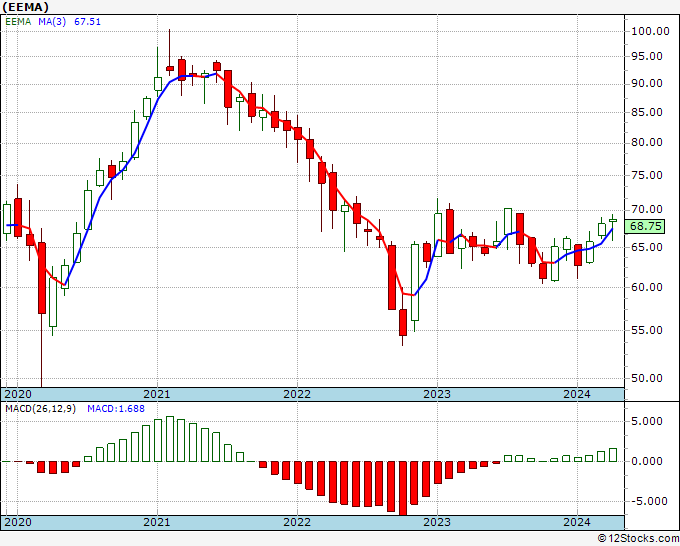
➞September 15, 2025 - The year-to-date (YTD) return or performance of (EEMA) is up 26.5978% and is outperforming the overall stock market by 13.2388%.
Recently, the weekly return of (EEMA) is up 5.36438% and is outperforming the overall market by 3.41789%.
All trends (long term, mid-term and short term) for iShares MSCI Emerging Markets Asia ETF looks good.
The overall 12Stocks.com Smart Investing & Trading Score is 100 (measures stock trend from 0-bearish to 100-bullish) which puts EEMA in short term bullish trend.
The Smart Investing & Trading Score from previous trading session is 90 and an improvement of trend continues. Scroll down for key technical charts, support & resistance levels and analysis for .
| Stock Analysis for EEMA | |||||||
| Name: iShares MSCI Emerging Markets Asia ETF | |||||||
| Sector: ETF | |||||||
| SubSector: Exchange Traded Fund | |||||||
| In A Glance (EEMA) Stock Performance and Technical Trend Chart View | |||||||
| |||||||
Weekly EEMA Technical Chart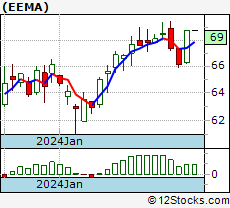 Daily EEMA Technical Chart 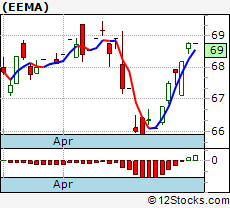 Add EEMA To Watch List View List | |||||||
| 12Stocks.com Short Term Trend Analysis for EEMA | |||||||
| 100 / 100 | |||||||
| The current technical trend score is 100 in a scale where 0 is bearish and 100 is bullish. | |||||||
| The technical trend score from previous session is 100. | |||||||
| Trend score updated daily. Not to be used for investing. | |||||||
Stocks Similar To
|
|
|
|
Get the most comprehensive stock market coverage daily at 12Stocks.com ➞ Best Stocks Today ➞ Best Stocks Weekly ➞ Best Stocks Year-to-Date ➞ Best Stocks Trends ➞  Best Stocks Today 12Stocks.com Best Nasdaq Stocks ➞ Best S&P 500 Stocks ➞ Best Tech Stocks ➞ Best Biotech Stocks ➞ |
© 2025 12Stocks.com Terms & Conditions Privacy Contact Us
All Information Provided Only For Education And Not To Be Used For Investing or Trading. See Terms & Conditions


One More Thing ... Get Best Stocks Delivered Daily!
Never Ever Miss A Move With Our Top Ten Stocks Lists
Get Best Performing Stocks, Daily Market Trends & Insight
Take A Peek At Our Top Ten Stocks Lists: Daily, Weekly, Year-to-Date & Top Trends
Get Best Performing Stocks, Daily Market Trends & Insight
Take A Peek At Our Top Ten Stocks Lists: Daily, Weekly, Year-to-Date & Top Trends
Dow Stocks With Best Current Trends [0-bearish to 100-bullish]: Intel Corp[100], Goldman Sachs[100], Chase[100], S&P[90], American Express[80], Johnson & Johnson[80], Caterpillar Inc[80], Walmart Inc[80], [80], Microsoft [80] Best S&P 500 Stocks Year-to-Date Update:
Seagate [147.349%], Western Digital[119.033%], Newmont Corp[106.282%], Warner Bros.[86.78%], Oracle Corp[85.117%], NRG Energy[82.4639%], Micron [82.339%], Amphenol Corp[73.5116%], CVS Health[71.8234%], Tapestry Inc[69.985%] Best Nasdaq 100 Stocks Weekly Update:
Splunk [38.7643%], Micron [20.9409%], Tesla Inc[19.2652%], Lam Research[14.3371%], Constellation Energy[9.01917%], ASML Holding[8.39069%], KLA Corp[8.03235%], Broadcom Inc[7.89513%], QQQ[7.1553%], Crowdstrike [6.95352%] Today's Stock Market In A Nutshell:Oil [1.3%], China [0.8%], Emerging Markets [0.6%], US Small Cap [0.5%], US Large Cap [0.5%], Gold [0.4%], US Mid Cap [0.3%], Euro [0.2%], India [0.1%], Bonds [-0.1%], US Dollar [-0.1%], Europe [-0.4%],