
![]()
Stocks with best trends & most momentum Starts at $49.99/Mo Subscribe ➞
| Terms & Conditions | Follow @DozenStocks | 12Stocks.com - Best Performing Stocks |
|
 Login Sign Up


| |||||
 |  | ||||
| 12Stocks.com Market Intelligence |
Best United Kingdom Stocks
 | "Discover best U.K stocks with 12Stocks.com" |
| - Subu Vdaygiri, Founder, 12Stocks.com |
|
|
| Quick Read: Top United Kingdom Stocks By Performances & Trends: Daily, Weekly, Year-to-Date, Market Cap (Size) & Technical Trends | |||
| Best United Kingdom Views: Quick Browse View, Summary & Slide Show | |||
| 12Stocks.com United Kingdom Stocks Performances & Trends Daily | |||||||||
|
|  The overall market intelligence score is 70 (0-bearish to 100-bullish) which puts United Kingdom index in short term neutral to bullish trend. The market intelligence score from previous trading session is 100 and hence a deterioration of trend.
| ||||||||
Here are the market intelligence trend scores of the most requested United Kingdom stocks at 12Stocks.com (click stock name for detailed review):
| |||||||||||||||||||||||
| Scroll down this page for most comprehensive review of United Kingdom stocks by performance, trends, technical analysis, charts, fund plays & more | |||||||||||||||||||||||


| 12Stocks.com: Top Performing United Kingdom Index Stocks | ||||||||||||||||||||||||||||||||||||||||||||||||
 The top performing United Kingdom Index stocks year to date are
Now, more recently, over last week, the top performing United Kingdom Index stocks on the move are


|
||||||||||||||||||||||||||||||||||||||||||||||||
| 12Stocks.com: Investing in United Kingdom Index with Stocks | |
|
The following table helps investors and traders sort through current performance and trends (as measured by market intelligence score) of various
stocks in the United Kingdom Index. Quick View: Move mouse or cursor over stock symbol (ticker) to view short-term technical chart and over stock name to view long term chart. Click on  to add stock symbol to your watchlist and to add stock symbol to your watchlist and  to view watchlist. Click on any ticker or stock name for detailed market intelligence report for that stock. to view watchlist. Click on any ticker or stock name for detailed market intelligence report for that stock. |
12Stocks.com Performance of Stocks in United Kingdom Index
| Ticker | Stock Name | Watchlist | Category | Recent Price | Market Intelligence Score | Change % | YTD Change% |
| NVT | nVent Electric |   | Industrials | 99.43 | 90 | -0.69 | 46.56% |
| FCAU | Fiat Chrysler | | Consumer Staples | 191.51 | 70 | -0.70 | 0.00% |
| HSBC | HSBC | | Financials | 70.83 | 70 | -0.74 | 51.37% |
| AZN | Astrazeneca | | Health Care | 83.66 | 100 | -0.83 | 29.65% |
| NVGS | Navigator | | Energy | 15.36 | 10 | -0.84 | -3.62% |
| VOD | Vodafone | | Technology | 11.42 | 40 | -0.95 | 37.61% |
| SNN | Smith & Nephew | | Health Care | 36.45 | 80 | -0.95 | 51.85% |
| RELX | RELX | | Industrials | 46.61 | 30 | -0.98 | 4.43% |
| KNOP | KNOT Offshore | | Energy | 8.69 | 40 | -1.03 | 49.36% |
| NOMD | Nomad Foods | | Consumer Staples | 13.23 | 50 | -1.05 | -18.24% |
| WLTW | Willis Towers | | Financials | 231.56 | 0 | -1.19 | 0.00% |
| HLN | Haleon | | Health Care | 8.88 | 41 | -1.44 | -5.40% |
| DAVA | Endava | | Technology | 9.17 | 60 | -1.71 | -69.92% |
| BP | BP | | Energy | 33.86 | 30 | -1.74 | 16.58% |
| IHS | IHS Holding | | Financials | 6.79 | 60 | -1.74 | 113.52% |
| CWK | Cushman & Wakefield | | Financials | 15.69 | 30 | -1.75 | 24.62% |
| IMCR | Immunocore | | Health Care | 35.28 | 70 | -1.81 | 18.31% |
| WPP | WPP . | | Technology | 24.28 | 30 | -2.18 | -50.53% |
| PUK | Prudential | | Financials | 27.48 | 30 | -2.28 | 77.67% |
| CCEP | Coca-Cola Europacific | | Consumer Staples | 87.84 | 0 | -2.42 | 15.94% |
| GENI | Genius Sports | | Technology | 11.94 | 10 | -3.01 | 40.47% |
| KNSA | Kiniksa | | Health Care | 37.46 | 50 | -3.05 | 87.86% |
| AUTL | Autolus | | Health Care | 1.61 | 60 | -3.59 | -38.78% |
| GSK | GSK | | Health Care | 43.69 | 80 | -4.00 | 31.65% |
| NCNA | NuCana | | Health Care | 4.63 | 60 | -4.73 | -98.13% |
| To view more stocks, click on Next / Previous arrows or select different range: 0 - 25 , 25 - 50 , 50 - 75 , 75 - 100 , 100 - 125 | ||
 | Click To Change The Sort Order: By Market Cap or Company Size Performance: Year-to-date, Week and Day |  |
| Detailed Overview Of United Kingdom Stocks |
| United Kingdom Technical Overview, Leaders & Laggards, Top United Kingdom ETF Funds & Detailed United Kingdom Stocks List, Charts, Trends & More |
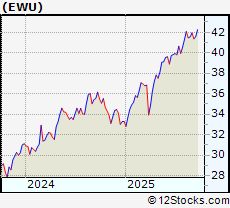
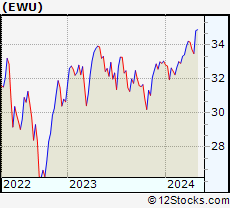
| United Kingdom: Technical Analysis, Trends & YTD Performance | |
 EWU Weekly Chart |
|
| Long Term Trend: Good | |
| Medium Term Trend: Good | |
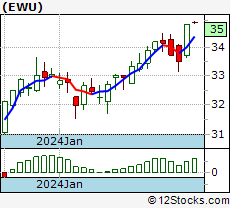
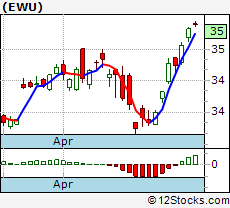 EWU Daily Chart |
|
| Short Term Trend: Very Good | |
| Overall Trend Score: 70 | |
| YTD Performance: 27.5142% | |
| **Trend Scores & Views Are Only For Educational Purposes And Not For Investing | |
| 12Stocks.com: Investing in United Kingdom Index using Exchange Traded Funds | |
|
The following table shows list of key exchange traded funds (ETF) that
help investors play United Kingdom stock market. For detailed view, check out our ETF Funds section of our website. Quick View: Move mouse or cursor over ETF symbol (ticker) to view short-term technical chart and over ETF name to view long term chart. Click on ticker or stock name for detailed view. Click on to add stock symbol to your watchlist and to view watchlist. |
12Stocks.com List of ETFs that track United Kingdom Index
| Ticker | ETF Name | Watchlist | Recent Price | Market Intelligence Score | Change % | Week % | Year-to-date % |
| DXPS | United Kingdom Hedged | | 22.16 | 30 | 1.84 | -20.3451 | 0% |
| QGBR | United Kingdom StratFacts | | 51.64 | 20 | 0.00 | 0 | 0% |
| FEU | Europe 50 | | 50.11 | 90 | 1.54 | 4.63562 | 26.3171% |
| 12Stocks.com: Charts, Trends, Fundamental Data and Performances of United Kingdom Stocks | |
|
We now take in-depth look at all United Kingdom stocks including charts, multi-period performances and overall trends (as measured by market intelligence score). One can sort United Kingdom stocks (click link to choose) by Daily, Weekly and by Year-to-Date performances. Also, one can sort by size of the company or by market capitalization. |
| Select Your Default Chart Type: | |||||
| |||||
| Click on stock symbol or name for detailed view. Click on to add stock symbol to your watchlist and to view watchlist. Quick View: Move mouse or cursor over "Daily" to quickly view daily technical stock chart and over "Weekly" to view weekly technical stock chart. | |||||
 | NVT nVent Electric plc |
| Sector: Industrials | |
| SubSector: Electrical Equipment & Parts | |
| MarketCap: 14935.9 Millions | |
| Recent Price: 99.43 Market Intelligence Score: 90 | |
| Day Percent Change: -0.69% Day Change: -0.69 | |
| Week Change: 2.22062% Year-to-date Change: 46.6% | |
| NVT Links: Profile News Message Board | |
| Charts:- Daily , Weekly | |
| Add NVT to Watchlist: View: Get Complete NVT Trend Analysis ➞ | |
 | FCAU Fiat Chrysler Automobiles N.V. |
| Sector: Consumer Staples | |
| SubSector: Auto Manufacturers - Major | |
| MarketCap: 9953.71 Millions | |
| Recent Price: 191.51 Market Intelligence Score: 70 | |
| Day Percent Change: -0.70% Day Change: -1.35 | |
| Week Change: 10.3931% Year-to-date Change: 0.0% | |
| FCAU Links: Profile News Message Board | |
| Charts:- Daily , Weekly | |
| Add FCAU to Watchlist: View: Get Complete FCAU Trend Analysis ➞ | |
 | HSBC HSBC Holdings plc ADR |
| Sector: Financials | |
| SubSector: Banks - Diversified | |
| MarketCap: 227760 Millions | |
| Recent Price: 70.83 Market Intelligence Score: 70 | |
| Day Percent Change: -0.74% Day Change: -0.53 | |
| Week Change: 1.34497% Year-to-date Change: 51.4% | |
| HSBC Links: Profile News Message Board | |
| Charts:- Daily , Weekly | |
| Add HSBC to Watchlist: View: Get Complete HSBC Trend Analysis ➞ | |
 | AZN Astrazeneca plc ADR |
| Sector: Health Care | |
| SubSector: Drug Manufacturers - General | |
| MarketCap: 253309 Millions | |
| Recent Price: 83.66 Market Intelligence Score: 100 | |
| Day Percent Change: -0.83% Day Change: -0.70 | |
| Week Change: 11.0138% Year-to-date Change: 29.6% | |
| AZN Links: Profile News Message Board | |
| Charts:- Daily , Weekly | |
| Add AZN to Watchlist: View: Get Complete AZN Trend Analysis ➞ | |
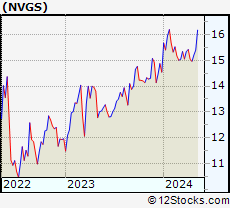 | NVGS Navigator Holdings Ltd |
| Sector: Energy | |
| SubSector: Oil & Gas Midstream | |
| MarketCap: 1151.13 Millions | |
| Recent Price: 15.36 Market Intelligence Score: 10 | |
| Day Percent Change: -0.84% Day Change: -0.13 | |
| Week Change: -5.93999% Year-to-date Change: -3.6% | |
| NVGS Links: Profile News Message Board | |
| Charts:- Daily , Weekly | |
| Add NVGS to Watchlist: View: Get Complete NVGS Trend Analysis ➞ | |
 | VOD Vodafone Group plc ADR |
| Sector: Technology | |
| SubSector: Telecom Services | |
| MarketCap: 28493.3 Millions | |
| Recent Price: 11.42 Market Intelligence Score: 40 | |
| Day Percent Change: -0.95% Day Change: -0.11 | |
| Week Change: 0.794351% Year-to-date Change: 37.6% | |
| VOD Links: Profile News Message Board | |
| Charts:- Daily , Weekly | |
| Add VOD to Watchlist: View: Get Complete VOD Trend Analysis ➞ | |
 | SNN Smith & Nephew plc ADR |
| Sector: Health Care | |
| SubSector: Medical Devices | |
| MarketCap: 16598.5 Millions | |
| Recent Price: 36.45 Market Intelligence Score: 80 | |
| Day Percent Change: -0.95% Day Change: -0.35 | |
| Week Change: 1.70201% Year-to-date Change: 51.9% | |
| SNN Links: Profile News Message Board | |
| Charts:- Daily , Weekly | |
| Add SNN to Watchlist: View: Get Complete SNN Trend Analysis ➞ | |
 | RELX RELX Plc ADR |
| Sector: Industrials | |
| SubSector: Specialty Business Services | |
| MarketCap: 85982.9 Millions | |
| Recent Price: 46.61 Market Intelligence Score: 30 | |
| Day Percent Change: -0.98% Day Change: -0.46 | |
| Week Change: 0.517576% Year-to-date Change: 4.4% | |
| RELX Links: Profile News Message Board | |
| Charts:- Daily , Weekly | |
| Add RELX to Watchlist: View: Get Complete RELX Trend Analysis ➞ | |
 | KNOP KNOT Offshore Partners LP |
| Sector: Energy | |
| SubSector: Oil & Gas Midstream | |
| MarketCap: 283 Millions | |
| Recent Price: 8.69 Market Intelligence Score: 40 | |
| Day Percent Change: -1.03% Day Change: -0.09 | |
| Week Change: -6.85959% Year-to-date Change: 49.4% | |
| KNOP Links: Profile News Message Board | |
| Charts:- Daily , Weekly | |
| Add KNOP to Watchlist: View: Get Complete KNOP Trend Analysis ➞ | |
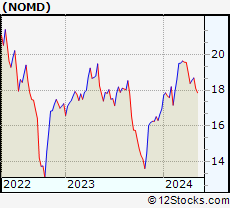 | NOMD Nomad Foods Limited |
| Sector: Consumer Staples | |
| SubSector: Packaged Foods | |
| MarketCap: 2256.56 Millions | |
| Recent Price: 13.23 Market Intelligence Score: 50 | |
| Day Percent Change: -1.05% Day Change: -0.14 | |
| Week Change: 0.227273% Year-to-date Change: -18.2% | |
| NOMD Links: Profile News Message Board | |
| Charts:- Daily , Weekly | |
| Add NOMD to Watchlist: View: Get Complete NOMD Trend Analysis ➞ | |
 | WLTW Willis Towers Watson Public Limited Company |
| Sector: Financials | |
| SubSector: Insurance Brokers | |
| MarketCap: 21403.4 Millions | |
| Recent Price: 231.56 Market Intelligence Score: 0 | |
| Day Percent Change: -1.19% Day Change: -2.78 | |
| Week Change: -2.3448% Year-to-date Change: 0.0% | |
| WLTW Links: Profile News Message Board | |
| Charts:- Daily , Weekly | |
| Add WLTW to Watchlist: View: Get Complete WLTW Trend Analysis ➞ | |
 | HLN Haleon plc ADR |
| Sector: Health Care | |
| SubSector: Drug Manufacturers - Specialty & Generic | |
| MarketCap: 43935.4 Millions | |
| Recent Price: 8.88 Market Intelligence Score: 41 | |
| Day Percent Change: -1.44% Day Change: -0.13 | |
| Week Change: 0.34% Year-to-date Change: -5.4% | |
| HLN Links: Profile News Message Board | |
| Charts:- Daily , Weekly | |
| Add HLN to Watchlist: View: Get Complete HLN Trend Analysis ➞ | |
 | DAVA Endava plc ADR |
| Sector: Technology | |
| SubSector: Software - Infrastructure | |
| MarketCap: 453.01 Millions | |
| Recent Price: 9.17 Market Intelligence Score: 60 | |
| Day Percent Change: -1.71% Day Change: -0.16 | |
| Week Change: -2.23881% Year-to-date Change: -69.9% | |
| DAVA Links: Profile News Message Board | |
| Charts:- Daily , Weekly | |
| Add DAVA to Watchlist: View: Get Complete DAVA Trend Analysis ➞ | |
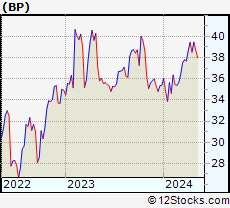 | BP BP plc ADR |
| Sector: Energy | |
| SubSector: Oil & Gas Integrated | |
| MarketCap: 87465.1 Millions | |
| Recent Price: 33.86 Market Intelligence Score: 30 | |
| Day Percent Change: -1.74% Day Change: -0.60 | |
| Week Change: -3.83414% Year-to-date Change: 16.6% | |
| BP Links: Profile News Message Board | |
| Charts:- Daily , Weekly | |
| Add BP to Watchlist: View: Get Complete BP Trend Analysis ➞ | |
 | IHS IHS Holding Ltd |
| Sector: Financials | |
| SubSector: Real Estate Services | |
| MarketCap: 2424.12 Millions | |
| Recent Price: 6.79 Market Intelligence Score: 60 | |
| Day Percent Change: -1.74% Day Change: -0.12 | |
| Week Change: 0.89153% Year-to-date Change: 113.5% | |
| IHS Links: Profile News Message Board | |
| Charts:- Daily , Weekly | |
| Add IHS to Watchlist: View: Get Complete IHS Trend Analysis ➞ | |
 | CWK Cushman & Wakefield plc |
| Sector: Financials | |
| SubSector: Real Estate Services | |
| MarketCap: 3841.1 Millions | |
| Recent Price: 15.69 Market Intelligence Score: 30 | |
| Day Percent Change: -1.75% Day Change: -0.28 | |
| Week Change: -0.696203% Year-to-date Change: 24.6% | |
| CWK Links: Profile News Message Board | |
| Charts:- Daily , Weekly | |
| Add CWK to Watchlist: View: Get Complete CWK Trend Analysis ➞ | |
 | IMCR Immunocore Holdings plc ADR |
| Sector: Health Care | |
| SubSector: Biotechnology | |
| MarketCap: 1873.76 Millions | |
| Recent Price: 35.28 Market Intelligence Score: 70 | |
| Day Percent Change: -1.81% Day Change: -0.65 | |
| Week Change: 2.94718% Year-to-date Change: 18.3% | |
| IMCR Links: Profile News Message Board | |
| Charts:- Daily , Weekly | |
| Add IMCR to Watchlist: View: Get Complete IMCR Trend Analysis ➞ | |
 | WPP WPP Plc. ADR |
| Sector: Technology | |
| SubSector: Advertising Agencies | |
| MarketCap: 5825.25 Millions | |
| Recent Price: 24.28 Market Intelligence Score: 30 | |
| Day Percent Change: -2.18% Day Change: -0.54 | |
| Week Change: 1.20884% Year-to-date Change: -50.5% | |
| WPP Links: Profile News Message Board | |
| Charts:- Daily , Weekly | |
| Add WPP to Watchlist: View: Get Complete WPP Trend Analysis ➞ | |
 | PUK Prudential plc ADR |
| Sector: Financials | |
| SubSector: Insurance - Life | |
| MarketCap: 33752 Millions | |
| Recent Price: 27.48 Market Intelligence Score: 30 | |
| Day Percent Change: -2.28% Day Change: -0.64 | |
| Week Change: -0.901551% Year-to-date Change: 77.7% | |
| PUK Links: Profile News Message Board | |
| Charts:- Daily , Weekly | |
| Add PUK to Watchlist: View: Get Complete PUK Trend Analysis ➞ | |
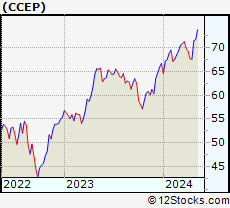 | CCEP Coca-Cola Europacific Partners Plc |
| Sector: Consumer Staples | |
| SubSector: Beverages - Non-Alcoholic | |
| MarketCap: 40954.2 Millions | |
| Recent Price: 87.84 Market Intelligence Score: 0 | |
| Day Percent Change: -2.42% Day Change: -2.18 | |
| Week Change: -2.13904% Year-to-date Change: 15.9% | |
| CCEP Links: Profile News Message Board | |
| Charts:- Daily , Weekly | |
| Add CCEP to Watchlist: View: Get Complete CCEP Trend Analysis ➞ | |
 | GENI Genius Sports Limited |
| Sector: Technology | |
| SubSector: Internet Content & Information | |
| MarketCap: 3414.71 Millions | |
| Recent Price: 11.94 Market Intelligence Score: 10 | |
| Day Percent Change: -3.01% Day Change: -0.37 | |
| Week Change: -8.92449% Year-to-date Change: 40.5% | |
| GENI Links: Profile News Message Board | |
| Charts:- Daily , Weekly | |
| Add GENI to Watchlist: View: Get Complete GENI Trend Analysis ➞ | |
 | KNSA Kiniksa Pharmaceuticals International Plc |
| Sector: Health Care | |
| SubSector: Drug Manufacturers - Specialty & Generic | |
| MarketCap: 2646.38 Millions | |
| Recent Price: 37.46 Market Intelligence Score: 50 | |
| Day Percent Change: -3.05% Day Change: -1.18 | |
| Week Change: 3.79607% Year-to-date Change: 87.9% | |
| KNSA Links: Profile News Message Board | |
| Charts:- Daily , Weekly | |
| Add KNSA to Watchlist: View: Get Complete KNSA Trend Analysis ➞ | |
 | AUTL Autolus Therapeutics plc ADR |
| Sector: Health Care | |
| SubSector: Biotechnology | |
| MarketCap: 388.56 Millions | |
| Recent Price: 1.61 Market Intelligence Score: 60 | |
| Day Percent Change: -3.59% Day Change: -0.06 | |
| Week Change: 3.20513% Year-to-date Change: -38.8% | |
| AUTL Links: Profile News Message Board | |
| Charts:- Daily , Weekly | |
| Add AUTL to Watchlist: View: Get Complete AUTL Trend Analysis ➞ | |
 | GSK GSK Plc ADR |
| Sector: Health Care | |
| SubSector: Drug Manufacturers - General | |
| MarketCap: 81591.3 Millions | |
| Recent Price: 43.69 Market Intelligence Score: 80 | |
| Day Percent Change: -4.00% Day Change: -1.82 | |
| Week Change: 8.73569% Year-to-date Change: 31.6% | |
| GSK Links: Profile News Message Board | |
| Charts:- Daily , Weekly | |
| Add GSK to Watchlist: View: Get Complete GSK Trend Analysis ➞ | |
 | NCNA NuCana plc ADR |
| Sector: Health Care | |
| SubSector: Biotechnology | |
| MarketCap: 5.48 Millions | |
| Recent Price: 4.63 Market Intelligence Score: 60 | |
| Day Percent Change: -4.73% Day Change: -0.23 | |
| Week Change: 11.5663% Year-to-date Change: -98.1% | |
| NCNA Links: Profile News Message Board | |
| Charts:- Daily , Weekly | |
| Add NCNA to Watchlist: View: Get Complete NCNA Trend Analysis ➞ | |
| To view more stocks, click on Next / Previous arrows or select different range: 0 - 25 , 25 - 50 , 50 - 75 , 75 - 100 , 100 - 125 | ||
| Click To Change The Sort Order: By Market Cap or Company Size Performance: Year-to-date, Week and Day | |
| Select Chart Type: | ||
 Best Stocks Today 12Stocks.com |
© 2025 12Stocks.com Terms & Conditions Privacy Contact Us
All Information Provided Only For Education And Not To Be Used For Investing or Trading. See Terms & Conditions


One More Thing ... Get Best Stocks Delivered Daily!
Never Ever Miss A Move With Our Top Ten Stocks Lists
Find Best Stocks In Any Market - Bull or Bear Market
Take A Peek At Our Top Ten Stocks Lists: Daily, Weekly, Year-to-Date & Top Trends
Find Best Stocks In Any Market - Bull or Bear Market
Take A Peek At Our Top Ten Stocks Lists: Daily, Weekly, Year-to-Date & Top Trends
United Kingdom Stocks With Best Up Trends [0-bearish to 100-bullish]: Arqit Quantum[100], Compass Pathways[100], Bicycle [100], Seadrill Partners[100], Roivant Sciences[100], Super [100], Ensco [100], Ferroglobe [100], Willis Towers[100], Mereo Biopharma[100], Astrazeneca [100]
Best United Kingdom Stocks Year-to-Date:
AngloGold Ashanti[205.031%], Tiziana Life[193.772%], Verona Pharma[121.618%], Super [119.863%], IHS Holding[113.522%], Kiniksa [87.8636%], Prudential [77.6743%], Lloyds Banking[75.854%], Barclays [61.2197%], Smith & Nephew[51.8548%], HSBC [51.3714%] Best United Kingdom Stocks This Week:
ROYAL DTCH[232.805%], Seadrill Partners[56.1198%], ROYAL DTCH[49.5206%], Ensco [45.9434%], Bicycle [20.3103%], Arqit Quantum[15.3609%], WPP [14.6079%], Mereo Biopharma[14.4444%], Michael Kors[12.7237%], Astrazeneca [11.0138%], Fiat Chrysler[10.3931%] Best United Kingdom Stocks Daily:
Arqit Quantum[17.94%], Vertical Aerospace[7.98%], ECARX [5.53%], Compass Pathways[4.16%], Silence [2.94%], Tiziana Life[2.56%], Bicycle [2.40%], CNH Industrial[2.37%], Vtex [2.33%], Travelport Worldwide[1.98%], Janus Henderson[1.93%]