
 Login Sign Up


| |||||
 |  | ||||

| 12Stocks.com Market Intelligence |
Best Tech Stocks
| In a hurry? Tech Stocks Lists: Performance & Trends, Stock Charts, FANG Stocks
Sort Tech stocks: Daily, Weekly, Year-to-Date, Market Cap & Trends. Filter Tech stocks list by size:All Tech Large Mid-Range Small and MicroCap |
| 12Stocks.com Tech Stocks Performances & Trends Daily | |||||||||
|
|  The overall Smart Investing & Trading Score is 100 (0-bearish to 100-bullish) which puts Technology sector in short term bullish trend. The Smart Investing & Trading Score from previous trading session is 90 and an improvement of trend continues.
| ||||||||
Here are the Smart Investing & Trading Scores of the most requested Technology stocks at 12Stocks.com (click stock name for detailed review):
|


| 12Stocks.com: Investing in Technology sector with Stocks | |
|
The following table helps investors and traders sort through current performance and trends (as measured by Smart Investing & Trading Score) of various
stocks in the Tech sector. Quick View: Move mouse or cursor over stock symbol (ticker) to view short-term technical chart and over stock name to view long term chart. Click on  to add stock symbol to your watchlist and to add stock symbol to your watchlist and  to view watchlist. Click on any ticker or stock name for detailed market intelligence report for that stock. to view watchlist. Click on any ticker or stock name for detailed market intelligence report for that stock. |
12Stocks.com Performance of Stocks in Tech Sector
| Ticker | Stock Name | Watchlist | Category | Recent Price | Smart Investing & Trading Score | Change % | YTD Change% |
| CLFD | Clearfield |   | Communication | 35.33 | 80 | 0.50% | 10.36% |
| IDEX | Ideanomics | | Software | 0.06 | 50 | -8.33% | 10.00% |
| EVER | EverQuote | | Internet Content & Information | 22.23 | 0 | 0.27% | 9.78% |
| HCOM | Hawaiian Telcom | | Communication | 14.54 | 30 | 0.00% | 8.68% |
| CCO | Clear Channel | | Advertising Agencies | 1.51 | 80 | -3.21% | 7.86% |
| TCX | Tucows | | Software - Infrastructure | 18.05 | 10 | -1.53% | 7.57% |
| SHEN | Shenandoah Tele | | Telecom | 13.24 | 40 | 0.46% | 7.29% |
| PRO | Pros | | Software - | 22.99 | 90 | 0.26% | 6.98% |
| ADTN | ADTRAN | | Communication | 9.29 | 50 | -2.57% | 6.84% |
| MIND | MIND | | Instruments | 8.21 | 50 | -1.50% | 6.84% |
| MDIA | MediaCo Holding | | Broadcasting | 1.25 | 30 | -0.79% | 5.93% |
| WOW | WideOpenWest | | Telecom | 5.11 | 30 | -0.97% | 5.58% |
| EVC | Entravision | | Advertising Agencies | 2.30 | 20 | 3.14% | 4.22% |
| GRVY | Gravity Co | | Electronic Gaming & Multimedia | 63.54 | 40 | -0.72% | 3.18% |
| SPWR | Complete Solaria | | Solar | 1.95 | 90 | 6.56% | 3.17% |
| BCOV | Brightcove | | Software | 4.45 | 50 | 0.23% | 2.77% |
| HEAR | Turtle Beach | | Communication | 17.25 | 30 | -1.26% | 1.17% |
| INFN | Infinera | | Communication | 6.64 | 30 | -0.15% | 1.07% |
| SCWX | SecureWorks | | Software | 8.51 | 60 | 0.24% | 0.83% |
| MATR | Mattersight | | Software | 42.14 | 70 | 4.33% | 0.00% |
| AVID | Avid | | Software | 6.76 | 20 | 0.30% | 0.00% |
| ESIO | Electro Scientific | | Semiconductor | 8.31 | 50 | 0.73% | 0.00% |
| BBOX | Black Box | | Networking | 5.60 | 10 | -4.92% | 0.00% |
| FRP | Fairpoint | | Telecom | 7.54 | 0 | 0.67% | 0.00% |
| GNCMA | General Communication | | Long Distance Carriers | 16.67 | 30 | 0.73% | 0.00% |
| For chart view version of above stock list: Chart View ➞ 0 - 25 , 25 - 50 , 50 - 75 , 75 - 100 , 100 - 125 , 125 - 150 , 150 - 175 , 175 - 200 , 200 - 225 , 225 - 250 , 250 - 275 , 275 - 300 , 300 - 325 , 325 - 350 , 350 - 375 | ||
 | Click To Change The Sort Order: By Market Cap or Company Size Performance: Year-to-date, Week and Day |  |
|
Get the most comprehensive stock market coverage daily at 12Stocks.com ➞ Best Stocks Today ➞ Best Stocks Weekly ➞ Best Stocks Year-to-Date ➞ Best Stocks Trends ➞  Best Stocks Today 12Stocks.com Best Nasdaq Stocks ➞ Best S&P 500 Stocks ➞ Best Tech Stocks ➞ Best Biotech Stocks ➞ |
| Detailed Overview of Tech Stocks |
| Tech Technical Overview, Leaders & Laggards, Top Tech ETF Funds & Detailed Tech Stocks List, Charts, Trends & More |
| Tech Sector: Technical Analysis, Trends & YTD Performance | |
| Technology sector is composed of stocks
from semiconductors, software, web, social media
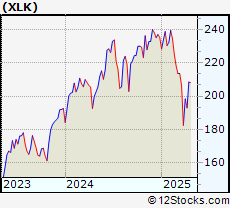
and services subsectors. Technology sector, as represented by XLK, an exchange-traded fund [ETF] that holds basket of tech stocks (e.g, Intel, Google) is up by 23.7823% and is currently outperforming the overall market by 9.0244% year-to-date. Below is a quick view of technical charts and trends: |
|
 XLK Weekly Chart |
|
| Long Term Trend: Very Good | |
| Medium Term Trend: Good | |
 XLK Daily Chart |
|
| Short Term Trend: Very Good | |
| Overall Trend Score: 100 | |
| YTD Performance: 23.7823% | |
| **Trend Scores & Views Are Only For Educational Purposes And Not For Investing | |
| 12Stocks.com: Top Performing Technology Sector Stocks | ||||||||||||||||||||||||||||||||||||||||||||||||
 The top performing Technology sector stocks year to date are
Now, more recently, over last week, the top performing Technology sector stocks on the move are


|
||||||||||||||||||||||||||||||||||||||||||||||||
| 12Stocks.com: Investing in Tech Sector using Exchange Traded Funds | |
|
The following table shows list of key exchange traded funds (ETF) that
help investors track Tech Index. For detailed view, check out our ETF Funds section of our website. Quick View: Move mouse or cursor over ETF symbol (ticker) to view short-term technical chart and over ETF name to view long term chart. Click on ticker or stock name for detailed view. Click on to add stock symbol to your watchlist and to view watchlist. |
12Stocks.com List of ETFs that track Tech Index
| Ticker | ETF Name | Watchlist | Recent Price | Smart Investing & Trading Score | Change % | Week % | Year-to-date % |
| IGN | Tech-Multimd Ntwk | | 53.86 | 40 | 0.918119 | -20.6435 | 0% |
| 12Stocks.com: Charts, Trends, Fundamental Data and Performances of Tech Stocks | |
|
We now take in-depth look at all Tech stocks including charts, multi-period performances and overall trends (as measured by Smart Investing & Trading Score). One can sort Tech stocks (click link to choose) by Daily, Weekly and by Year-to-Date performances. Also, one can sort by size of the company or by market capitalization. |
| Select Your Default Chart Type: | |||||
| |||||
| Click on stock symbol or name for detailed view. Click on to add stock symbol to your watchlist and to view watchlist. Quick View: Move mouse or cursor over "Daily" to quickly view daily technical stock chart and over "Weekly" to view weekly technical stock chart. | |||||


 | CLFD Clearfield Inc |
| Sector: Technology | |
| SubSector: Communication Equipment | |
| MarketCap: 454.63 Millions | |
| Recent Price: 35.33 Smart Investing & Trading Score: 80 | |
| Day Percent Change: 0.497866% Day Change: 0.1 | |
| Week Change: 3.95821% Year-to-date Change: 10.4% | |
| CLFD Links: Profile News Message Board | |
| Charts:- Daily , Weekly | |
| Add CLFD to Watchlist: View: Get Complete CLFD Trend Analysis ➞ | |
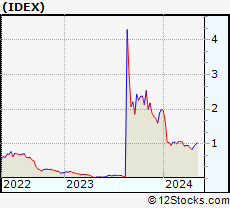 | IDEX Ideanomics, Inc. |
| Sector: Technology | |
| SubSector: Application Software | |
| MarketCap: 79 Millions | |
| Recent Price: 0.06 Smart Investing & Trading Score: 50 | |
| Day Percent Change: -8.33333% Day Change: -9999 | |
| Week Change: 175% Year-to-date Change: 10.0% | |
| IDEX Links: Profile News Message Board | |
| Charts:- Daily , Weekly | |
| Add IDEX to Watchlist: View: Get Complete IDEX Trend Analysis ➞ | |
 | EVER EverQuote Inc |
| Sector: Technology | |
| SubSector: Internet Content & Information | |
| MarketCap: 859.51 Millions | |
| Recent Price: 22.23 Smart Investing & Trading Score: 0 | |
| Day Percent Change: 0.270636% Day Change: -0.32 | |
| Week Change: -5.92467% Year-to-date Change: 9.8% | |
| EVER Links: Profile News Message Board | |
| Charts:- Daily , Weekly | |
| Add EVER to Watchlist: View: Get Complete EVER Trend Analysis ➞ | |
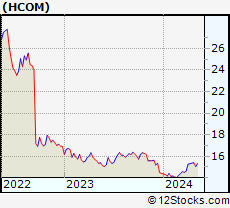 | HCOM Hawaiian Telcom Holdco, Inc. |
| Sector: Technology | |
| SubSector: Diversified Communication Services | |
| MarketCap: 272.82 Millions | |
| Recent Price: 14.54 Smart Investing & Trading Score: 30 | |
| Day Percent Change: 0% Day Change: -9999 | |
| Week Change: 0% Year-to-date Change: 8.7% | |
| HCOM Links: Profile News Message Board | |
| Charts:- Daily , Weekly | |
| Add HCOM to Watchlist: View: Get Complete HCOM Trend Analysis ➞ | |
 | CCO Clear Channel Outdoor Holdings Inc |
| Sector: Technology | |
| SubSector: Advertising Agencies | |
| MarketCap: 656.06 Millions | |
| Recent Price: 1.51 Smart Investing & Trading Score: 80 | |
| Day Percent Change: -3.20513% Day Change: -0.01 | |
| Week Change: -0.657895% Year-to-date Change: 7.9% | |
| CCO Links: Profile News Message Board | |
| Charts:- Daily , Weekly | |
| Add CCO to Watchlist: View: Get Complete CCO Trend Analysis ➞ | |
 | TCX Tucows, Inc |
| Sector: Technology | |
| SubSector: Software - Infrastructure | |
| MarketCap: 197.53 Millions | |
| Recent Price: 18.05 Smart Investing & Trading Score: 10 | |
| Day Percent Change: -1.52755% Day Change: -0.47 | |
| Week Change: -5.19958% Year-to-date Change: 7.6% | |
| TCX Links: Profile News Message Board | |
| Charts:- Daily , Weekly | |
| Add TCX to Watchlist: View: Get Complete TCX Trend Analysis ➞ | |
 | SHEN Shenandoah Telecommunications Co |
| Sector: Technology | |
| SubSector: Telecom Services | |
| MarketCap: 738.37 Millions | |
| Recent Price: 13.24 Smart Investing & Trading Score: 40 | |
| Day Percent Change: 0.455235% Day Change: 0.21 | |
| Week Change: 0.227101% Year-to-date Change: 7.3% | |
| SHEN Links: Profile News Message Board | |
| Charts:- Daily , Weekly | |
| Add SHEN to Watchlist: View: Get Complete SHEN Trend Analysis ➞ | |
 | PRO Pros Holdings Inc |
| Sector: Technology | |
| SubSector: Software - Application | |
| MarketCap: 745.65 Millions | |
| Recent Price: 22.99 Smart Investing & Trading Score: 90 | |
| Day Percent Change: 0.261666% Day Change: 0.41 | |
| Week Change: 0.349193% Year-to-date Change: 7.0% | |
| PRO Links: Profile News Message Board | |
| Charts:- Daily , Weekly | |
| Add PRO to Watchlist: View: Get Complete PRO Trend Analysis ➞ | |
 | ADTN ADTRAN Holdings Inc |
| Sector: Technology | |
| SubSector: Communication Equipment | |
| MarketCap: 780.51 Millions | |
| Recent Price: 9.29 Smart Investing & Trading Score: 50 | |
| Day Percent Change: -2.56813% Day Change: 0.29 | |
| Week Change: -1.4316% Year-to-date Change: 6.8% | |
| ADTN Links: Profile News Message Board | |
| Charts:- Daily , Weekly | |
| Add ADTN to Watchlist: View: Get Complete ADTN Trend Analysis ➞ | |
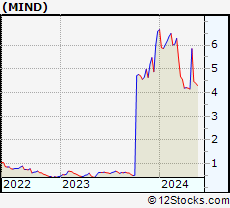 | MIND MIND Technology Inc |
| Sector: Technology | |
| SubSector: Scientific & Technical Instruments | |
| MarketCap: 75.23 Millions | |
| Recent Price: 8.21 Smart Investing & Trading Score: 50 | |
| Day Percent Change: -1.5006% Day Change: 0.43 | |
| Week Change: -4.25904% Year-to-date Change: 6.8% | |
| MIND Links: Profile News Message Board | |
| Charts:- Daily , Weekly | |
| Add MIND to Watchlist: View: Get Complete MIND Trend Analysis ➞ | |
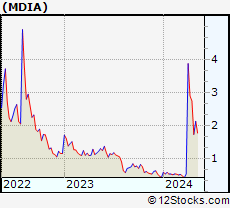 | MDIA MediaCo Holding Inc |
| Sector: Technology | |
| SubSector: Broadcasting | |
| MarketCap: 72.46 Millions | |
| Recent Price: 1.25 Smart Investing & Trading Score: 30 | |
| Day Percent Change: -0.793651% Day Change: -0.04 | |
| Week Change: -4.58015% Year-to-date Change: 5.9% | |
| MDIA Links: Profile News Message Board | |
| Charts:- Daily , Weekly | |
| Add MDIA to Watchlist: View: Get Complete MDIA Trend Analysis ➞ | |
 | WOW WideOpenWest Inc |
| Sector: Technology | |
| SubSector: Telecom Services | |
| MarketCap: 440.85 Millions | |
| Recent Price: 5.11 Smart Investing & Trading Score: 30 | |
| Day Percent Change: -0.968992% Day Change: 0 | |
| Week Change: -0.968992% Year-to-date Change: 5.6% | |
| WOW Links: Profile News Message Board | |
| Charts:- Daily , Weekly | |
| Add WOW to Watchlist: View: Get Complete WOW Trend Analysis ➞ | |
 | EVC Entravision Communications Corp |
| Sector: Technology | |
| SubSector: Advertising Agencies | |
| MarketCap: 225.62 Millions | |
| Recent Price: 2.30 Smart Investing & Trading Score: 20 | |
| Day Percent Change: 3.13901% Day Change: -0.02 | |
| Week Change: -4.16667% Year-to-date Change: 4.2% | |
| EVC Links: Profile News Message Board | |
| Charts:- Daily , Weekly | |
| Add EVC to Watchlist: View: Get Complete EVC Trend Analysis ➞ | |
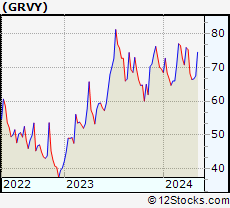 | GRVY Gravity Co Ltd ADR |
| Sector: Technology | |
| SubSector: Electronic Gaming & Multimedia | |
| MarketCap: 444.04 Millions | |
| Recent Price: 63.54 Smart Investing & Trading Score: 40 | |
| Day Percent Change: -0.71875% Day Change: -0.89 | |
| Week Change: -1.01262% Year-to-date Change: 3.2% | |
| GRVY Links: Profile News Message Board | |
| Charts:- Daily , Weekly | |
| Add GRVY to Watchlist: View: Get Complete GRVY Trend Analysis ➞ | |
 | SPWR Complete Solaria Inc |
| Sector: Technology | |
| SubSector: Solar | |
| MarketCap: 124.66 Millions | |
| Recent Price: 1.95 Smart Investing & Trading Score: 90 | |
| Day Percent Change: 6.55738% Day Change: -0.05 | |
| Week Change: 10.1695% Year-to-date Change: 3.2% | |
| SPWR Links: Profile News Message Board | |
| Charts:- Daily , Weekly | |
| Add SPWR to Watchlist: View: Get Complete SPWR Trend Analysis ➞ | |
 | BCOV Brightcove Inc. |
| Sector: Technology | |
| SubSector: Application Software | |
| MarketCap: 266.162 Millions | |
| Recent Price: 4.45 Smart Investing & Trading Score: 50 | |
| Day Percent Change: 0.225225% Day Change: -9999 | |
| Week Change: 0.451467% Year-to-date Change: 2.8% | |
| BCOV Links: Profile News Message Board | |
| Charts:- Daily , Weekly | |
| Add BCOV to Watchlist: View: Get Complete BCOV Trend Analysis ➞ | |
 | HEAR Turtle Beach Corporation |
| Sector: Technology | |
| SubSector: Communication Equipment | |
| MarketCap: 73.0539 Millions | |
| Recent Price: 17.25 Smart Investing & Trading Score: 30 | |
| Day Percent Change: -1.2593% Day Change: -9999 | |
| Week Change: 1.95035% Year-to-date Change: 1.2% | |
| HEAR Links: Profile News Message Board | |
| Charts:- Daily , Weekly | |
| Add HEAR to Watchlist: View: Get Complete HEAR Trend Analysis ➞ | |
 | INFN Infinera Corporation |
| Sector: Technology | |
| SubSector: Communication Equipment | |
| MarketCap: 943 Millions | |
| Recent Price: 6.64 Smart Investing & Trading Score: 30 | |
| Day Percent Change: -0.150376% Day Change: -9999 | |
| Week Change: -0.598802% Year-to-date Change: 1.1% | |
| INFN Links: Profile News Message Board | |
| Charts:- Daily , Weekly | |
| Add INFN to Watchlist: View: Get Complete INFN Trend Analysis ➞ | |
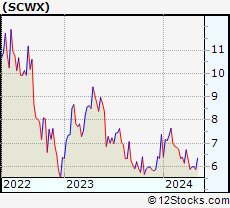 | SCWX SecureWorks Corp. |
| Sector: Technology | |
| SubSector: Application Software | |
| MarketCap: 986 Millions | |
| Recent Price: 8.51 Smart Investing & Trading Score: 60 | |
| Day Percent Change: 0.235571% Day Change: -9999 | |
| Week Change: 0.591017% Year-to-date Change: 0.8% | |
| SCWX Links: Profile News Message Board | |
| Charts:- Daily , Weekly | |
| Add SCWX to Watchlist: View: Get Complete SCWX Trend Analysis ➞ | |
 | MATR Mattersight Corporation |
| Sector: Technology | |
| SubSector: Application Software | |
| MarketCap: 95.87 Millions | |
| Recent Price: 42.14 Smart Investing & Trading Score: 70 | |
| Day Percent Change: 4.33276% Day Change: -9999 | |
| Week Change: 1169.28% Year-to-date Change: 0.0% | |
| MATR Links: Profile News Message Board | |
| Charts:- Daily , Weekly | |
| Add MATR to Watchlist: View: Get Complete MATR Trend Analysis ➞ | |
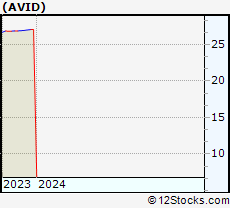 | AVID Avid Technology, Inc. |
| Sector: Technology | |
| SubSector: Multimedia & Graphics Software | |
| MarketCap: 290.686 Millions | |
| Recent Price: 6.76 Smart Investing & Trading Score: 20 | |
| Day Percent Change: 0.296736% Day Change: -9999 | |
| Week Change: -75% Year-to-date Change: 0.0% | |
| AVID Links: Profile News Message Board | |
| Charts:- Daily , Weekly | |
| Add AVID to Watchlist: View: Get Complete AVID Trend Analysis ➞ | |
 | ESIO Electro Scientific Industries, Inc. |
| Sector: Technology | |
| SubSector: Semiconductor - Integrated Circuits | |
| MarketCap: 226.91 Millions | |
| Recent Price: 8.31 Smart Investing & Trading Score: 50 | |
| Day Percent Change: 0.727273% Day Change: -9999 | |
| Week Change: 35.342% Year-to-date Change: 0.0% | |
| ESIO Links: Profile News Message Board | |
| Charts:- Daily , Weekly | |
| Add ESIO to Watchlist: View: Get Complete ESIO Trend Analysis ➞ | |
 | BBOX Black Box Corporation |
| Sector: Technology | |
| SubSector: Networking & Communication Devices | |
| MarketCap: 131.75 Millions | |
| Recent Price: 5.60 Smart Investing & Trading Score: 10 | |
| Day Percent Change: -4.9236% Day Change: -9999 | |
| Week Change: -48.7179% Year-to-date Change: 0.0% | |
| BBOX Links: Profile News Message Board | |
| Charts:- Daily , Weekly | |
| Add BBOX to Watchlist: View: Get Complete BBOX Trend Analysis ➞ | |
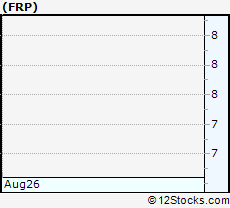 | FRP Fairpoint Communications, Inc. |
| Sector: Technology | |
| SubSector: Telecom Services - Domestic | |
| MarketCap: 448.39 Millions | |
| Recent Price: 7.54 Smart Investing & Trading Score: 0 | |
| Day Percent Change: 0.667557% Day Change: -9999 | |
| Week Change: -67.9966% Year-to-date Change: 0.0% | |
| FRP Links: Profile News Message Board | |
| Charts:- Daily , Weekly | |
| Add FRP to Watchlist: View: Get Complete FRP Trend Analysis ➞ | |
 | GNCMA General Communication, Inc. |
| Sector: Technology | |
| SubSector: Long Distance Carriers | |
| MarketCap: 697.93 Millions | |
| Recent Price: 16.67 Smart Investing & Trading Score: 30 | |
| Day Percent Change: 0.725076% Day Change: -9999 | |
| Week Change: -8.65753% Year-to-date Change: 0.0% | |
| GNCMA Links: Profile News Message Board | |
| Charts:- Daily , Weekly | |
| Add GNCMA to Watchlist: View: Get Complete GNCMA Trend Analysis ➞ | |
| For tabular summary view of above stock list: Summary View ➞ 0 - 25 , 25 - 50 , 50 - 75 , 75 - 100 , 100 - 125 , 125 - 150 , 150 - 175 , 175 - 200 , 200 - 225 , 225 - 250 , 250 - 275 , 275 - 300 , 300 - 325 , 325 - 350 , 350 - 375 | ||
| Click To Change The Sort Order: By Market Cap or Company Size Performance: Year-to-date, Week and Day | |
| Select Chart Type: | ||
|
Best Stocks Today 12Stocks.com |
© 2025 12Stocks.com Terms & Conditions Privacy Contact Us
All Information Provided Only For Education And Not To Be Used For Investing or Trading. See Terms & Conditions


One More Thing ... Get Best Stocks Delivered Daily!
Never Ever Miss A Move With Our Top Ten Stocks Lists
Find Best Stocks In Any Market - Bull or Bear Market
Take A Peek At Our Top Ten Stocks Lists: Daily, Weekly, Year-to-Date & Top Trends
Find Best Stocks In Any Market - Bull or Bear Market
Take A Peek At Our Top Ten Stocks Lists: Daily, Weekly, Year-to-Date & Top Trends
Technology Stocks With Best Up Trends [0-bearish to 100-bullish]: Sony [100], Bakkt [100], Rigetti Computing[100], Fair Isaac[100], Arqit Quantum[100], D-Wave Quantum[100], Navitas Semiconductor[100], Shoals [100], Vuzix [100], Arteris [100], Lantronix [100]
Best Technology Stocks Year-to-Date:
Xunlei [370.476%], Sify [315.033%], Wolfspeed [307.01%], Digital Turbine[265.057%], EchoStar Corp[247.253%], CuriosityStream [241.605%], Viasat [224.029%], Pagaya [222.638%], Oneconnect Financial[209.053%], D-Wave Quantum[203.954%], CommScope Holding[203.101%] Best Technology Stocks This Week:
GTT [443626%], Barracuda Networks[71050%], Mobile TeleSystems[10483.5%], Nam Tai[5033.33%], Ebix [4200.85%], Fang [4150%], NantHealth [3114.02%], Hemisphere Media[2981.82%], Yandex N.V[2935.27%], Wolfspeed [1961.98%], Castlight Health[1751.96%] Best Technology Stocks Daily:
Sony [194.565%], Bakkt [28.6091%], Rigetti Computing[18.4925%], Fair Isaac[17.979%], Arqit Quantum[17.9369%], Marti [17%], Latch [16.6667%], Oclaro [14.734%], D-Wave Quantum[13.968%], Arbe Robotics[13.0178%], Navitas Semiconductor[12.3288%]