
 Login Sign Up


| |||||
 |  | ||||

| 12Stocks.com Market Intelligence |
Best Tech Stocks
| In a hurry? Tech Stocks Lists: Performance & Trends, Stock Charts, FANG Stocks
Sort Tech stocks: Daily, Weekly, Year-to-Date, Market Cap & Trends. Filter Tech stocks list by size:All Tech Large Mid-Range Small and MicroCap |
| 12Stocks.com Tech Stocks Performances & Trends Daily | |||||||||
|
|  The overall Smart Investing & Trading Score is 100 (0-bearish to 100-bullish) which puts Technology sector in short term bullish trend. The Smart Investing & Trading Score from previous trading session is 90 and an improvement of trend continues.
| ||||||||
Here are the Smart Investing & Trading Scores of the most requested Technology stocks at 12Stocks.com (click stock name for detailed review):
|


| 12Stocks.com: Investing in Technology sector with Stocks | |
|
The following table helps investors and traders sort through current performance and trends (as measured by Smart Investing & Trading Score) of various
stocks in the Tech sector. Quick View: Move mouse or cursor over stock symbol (ticker) to view short-term technical chart and over stock name to view long term chart. Click on  to add stock symbol to your watchlist and to add stock symbol to your watchlist and  to view watchlist. Click on any ticker or stock name for detailed market intelligence report for that stock. to view watchlist. Click on any ticker or stock name for detailed market intelligence report for that stock. |
12Stocks.com Performance of Stocks in Tech Sector
| Ticker | Stock Name | Watchlist | Category | Recent Price | Smart Investing & Trading Score | Change % | YTD Change% |
| ASUR | Asure Software |   | Software - | 8.15 | 20 | 1.49% | -13.94% |
| RDCM | Radcom | | Telecom | 13.95 | 40 | -0.82% | 19.64% |
| SPA | Sparton | | Electronics | 31.35 | 40 | 0.97% | 0.00% |
| SWIR | Sierra Wireless | | Communication | 62.28 | 70 | 0.44% | 0.00% |
| WILN | Wi-Lan | | Wireless | 14.15 | 10 | -0.07% | 0.00% |
| VLN | Valens Semiconductor | | Semiconductors | 1.86 | 50 | 3.33% | -33.81% |
| MIXT | MiX Telematics | | Software | 2.64 | 10 | -4.00% | 0.00% |
| NCIT | NCI | | IT | 10.30 | 30 | 1.08% | 0.00% |
| LTCH | Latch | | Software - | 0.14 | 80 | 16.67% | 18.64% |
| GUID | Guidance Software | | Software | 4.66 | 20 | -2.10% | 0.00% |
| INSG | Inseego Corp | | Communication | 16.50 | 100 | 4.70% | 60.66% |
| TCX | Tucows | | Software - Infrastructure | 18.05 | 10 | -1.53% | 7.57% |
| AKTS | Akoustis | | Communication | 0.02 | 10 | 4.85% | 0.00% |
| WOLF | Wolfspeed | | Semiconductors | 24.95 | 20 | 0.24% | 307.01% |
| PERF | Perfect Corp | | Software - | 1.94 | 50 | 1.04% | -33.56% |
| JT | Jianpu | | IT | 0.78 | 40 | 7.78% | 0.00% |
| TRUE | Truecar | | Internet Content & Information | 1.79 | 20 | 4.97% | -48.71% |
| MRT | Marti | | Software - | 2.34 | 50 | 17.00% | -30.36% |
| VUZI | Vuzix | | Consumer Electronics | 3.79 | 100 | 8.91% | -8.45% |
| PLPM | Planet Payment | | Software | 16.00 | 20 | 0.50% | 0.00% |
| ECOM | ChannelAdvisor | | Software | 5.49 | 10 | -1.08% | 0.00% |
| SYT | SYLA | | Software - | 1.50 | 0 | 0.00% | -25.00% |
| LTRX | Lantronix | | Communication | 5.33 | 100 | 6.81% | 30.96% |
| BKKT | Bakkt | | Software - Infrastructure | 43.92 | 100 | 28.61% | 72.64% |
| TTEC | TTEC | | IT | 3.32 | 10 | -2.92% | -30.98% |
| For chart view version of above stock list: Chart View ➞ 0 - 25 , 25 - 50 , 50 - 75 , 75 - 100 , 100 - 125 , 125 - 150 , 150 - 175 , 175 - 200 , 200 - 225 , 225 - 250 , 250 - 275 , 275 - 300 , 300 - 325 , 325 - 350 , 350 - 375 | ||
 | Click To Change The Sort Order: By Market Cap or Company Size Performance: Year-to-date, Week and Day |  |
|
Get the most comprehensive stock market coverage daily at 12Stocks.com ➞ Best Stocks Today ➞ Best Stocks Weekly ➞ Best Stocks Year-to-Date ➞ Best Stocks Trends ➞  Best Stocks Today 12Stocks.com Best Nasdaq Stocks ➞ Best S&P 500 Stocks ➞ Best Tech Stocks ➞ Best Biotech Stocks ➞ |
| Detailed Overview of Tech Stocks |
| Tech Technical Overview, Leaders & Laggards, Top Tech ETF Funds & Detailed Tech Stocks List, Charts, Trends & More |
| Tech Sector: Technical Analysis, Trends & YTD Performance | |
| Technology sector is composed of stocks
from semiconductors, software, web, social media
and services subsectors. Technology sector, as represented by XLK, an exchange-traded fund [ETF] that holds basket of tech stocks (e.g, Intel, Google) is up by 23.7823% and is currently outperforming the overall market by 9.0244% year-to-date. Below is a quick view of technical charts and trends: |
|
 XLK Weekly Chart |
|
| Long Term Trend: Very Good | |
| Medium Term Trend: Good | |
 XLK Daily Chart |
|
| Short Term Trend: Very Good | |
| Overall Trend Score: 100 | |
| YTD Performance: 23.7823% | |
| **Trend Scores & Views Are Only For Educational Purposes And Not For Investing | |
| 12Stocks.com: Top Performing Technology Sector Stocks | ||||||||||||||||||||||||||||||||||||||||||||||||
 The top performing Technology sector stocks year to date are
Now, more recently, over last week, the top performing Technology sector stocks on the move are


|
||||||||||||||||||||||||||||||||||||||||||||||||
| 12Stocks.com: Investing in Tech Sector using Exchange Traded Funds | |
|
The following table shows list of key exchange traded funds (ETF) that
help investors track Tech Index. For detailed view, check out our ETF Funds section of our website. Quick View: Move mouse or cursor over ETF symbol (ticker) to view short-term technical chart and over ETF name to view long term chart. Click on ticker or stock name for detailed view. Click on to add stock symbol to your watchlist and to view watchlist. |
12Stocks.com List of ETFs that track Tech Index
| Ticker | ETF Name | Watchlist | Recent Price | Smart Investing & Trading Score | Change % | Week % | Year-to-date % |
| IGN | Tech-Multimd Ntwk | | 53.86 | 40 | 0.918119 | -20.6435 | 0% |
| 12Stocks.com: Charts, Trends, Fundamental Data and Performances of Tech Stocks | |
|
We now take in-depth look at all Tech stocks including charts, multi-period performances and overall trends (as measured by Smart Investing & Trading Score). One can sort Tech stocks (click link to choose) by Daily, Weekly and by Year-to-Date performances. Also, one can sort by size of the company or by market capitalization. |
| Select Your Default Chart Type: | |||||
| |||||
| Click on stock symbol or name for detailed view. Click on to add stock symbol to your watchlist and to view watchlist. Quick View: Move mouse or cursor over "Daily" to quickly view daily technical stock chart and over "Weekly" to view weekly technical stock chart. | |||||


 | ASUR Asure Software Inc |
| Sector: Technology | |
| SubSector: Software - Application | |
| MarketCap: 220.22 Millions | |
| Recent Price: 8.15 Smart Investing & Trading Score: 20 | |
| Day Percent Change: 1.4944% Day Change: 0.14 | |
| Week Change: 0% Year-to-date Change: -13.9% | |
| ASUR Links: Profile News Message Board | |
| Charts:- Daily , Weekly | |
| Add ASUR to Watchlist: View: Get Complete ASUR Trend Analysis ➞ | |
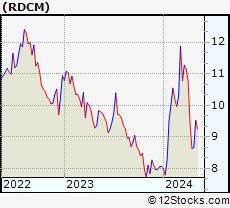 | RDCM Radcom |
| Sector: Technology | |
| SubSector: Telecom Services | |
| MarketCap: 219.84 Millions | |
| Recent Price: 13.95 Smart Investing & Trading Score: 40 | |
| Day Percent Change: -0.817632% Day Change: 0.19 | |
| Week Change: -6.81363% Year-to-date Change: 19.6% | |
| RDCM Links: Profile News Message Board | |
| Charts:- Daily , Weekly | |
| Add RDCM to Watchlist: View: Get Complete RDCM Trend Analysis ➞ | |
 | SPA Sparton Corporation |
| Sector: Technology | |
| SubSector: Diversified Electronics | |
| MarketCap: 219.79 Millions | |
| Recent Price: 31.35 Smart Investing & Trading Score: 40 | |
| Day Percent Change: 0.966184% Day Change: -9999 | |
| Week Change: 104.768% Year-to-date Change: 0.0% | |
| SPA Links: Profile News Message Board | |
| Charts:- Daily , Weekly | |
| Add SPA to Watchlist: View: Get Complete SPA Trend Analysis ➞ | |
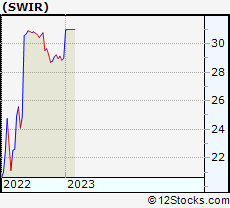 | SWIR Sierra Wireless, Inc. |
| Sector: Technology | |
| SubSector: Communication Equipment | |
| MarketCap: 212.639 Millions | |
| Recent Price: 62.28 Smart Investing & Trading Score: 70 | |
| Day Percent Change: 0.435414% Day Change: -9999 | |
| Week Change: 100.968% Year-to-date Change: 0.0% | |
| SWIR Links: Profile News Message Board | |
| Charts:- Daily , Weekly | |
| Add SWIR to Watchlist: View: Get Complete SWIR Trend Analysis ➞ | |
 | WILN Wi-Lan Inc. |
| Sector: Technology | |
| SubSector: Wireless Communications | |
| MarketCap: 211.06 Millions | |
| Recent Price: 14.15 Smart Investing & Trading Score: 10 | |
| Day Percent Change: -0.0706215% Day Change: -9999 | |
| Week Change: -18.5377% Year-to-date Change: 0.0% | |
| WILN Links: Profile News Message Board | |
| Charts:- Daily , Weekly | |
| Add WILN to Watchlist: View: Get Complete WILN Trend Analysis ➞ | |
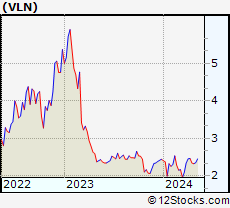 | VLN Valens Semiconductor Ltd |
| Sector: Technology | |
| SubSector: Semiconductors | |
| MarketCap: 210.38 Millions | |
| Recent Price: 1.86 Smart Investing & Trading Score: 50 | |
| Day Percent Change: 3.33333% Day Change: -0.01 | |
| Week Change: 0% Year-to-date Change: -33.8% | |
| VLN Links: Profile News Message Board | |
| Charts:- Daily , Weekly | |
| Add VLN to Watchlist: View: Get Complete VLN Trend Analysis ➞ | |
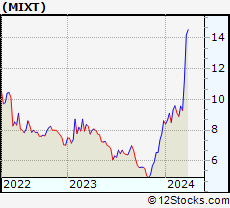 | MIXT MiX Telematics Limited |
| Sector: Technology | |
| SubSector: Technical & System Software | |
| MarketCap: 209 Millions | |
| Recent Price: 2.64 Smart Investing & Trading Score: 10 | |
| Day Percent Change: -4% Day Change: -9999 | |
| Week Change: -81.4084% Year-to-date Change: 0.0% | |
| MIXT Links: Profile News Message Board | |
| Charts:- Daily , Weekly | |
| Add MIXT to Watchlist: View: Get Complete MIXT Trend Analysis ➞ | |
 | NCIT NCI, Inc. |
| Sector: Technology | |
| SubSector: Information Technology Services | |
| MarketCap: 202.37 Millions | |
| Recent Price: 10.30 Smart Investing & Trading Score: 30 | |
| Day Percent Change: 1.07949% Day Change: -9999 | |
| Week Change: -45.3581% Year-to-date Change: 0.0% | |
| NCIT Links: Profile News Message Board | |
| Charts:- Daily , Weekly | |
| Add NCIT to Watchlist: View: Get Complete NCIT Trend Analysis ➞ | |
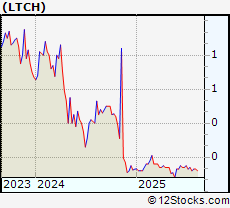 | LTCH Latch, Inc. |
| Sector: Technology | |
| SubSector: Software - Application | |
| MarketCap: 202 Millions | |
| Recent Price: 0.14 Smart Investing & Trading Score: 80 | |
| Day Percent Change: 16.6667% Day Change: 0 | |
| Week Change: 16.6667% Year-to-date Change: 18.6% | |
| LTCH Links: Profile News Message Board | |
| Charts:- Daily , Weekly | |
| Add LTCH to Watchlist: View: Get Complete LTCH Trend Analysis ➞ | |
 | GUID Guidance Software, Inc. |
| Sector: Technology | |
| SubSector: Application Software | |
| MarketCap: 201.27 Millions | |
| Recent Price: 4.66 Smart Investing & Trading Score: 20 | |
| Day Percent Change: -2.10084% Day Change: -9999 | |
| Week Change: -27.9753% Year-to-date Change: 0.0% | |
| GUID Links: Profile News Message Board | |
| Charts:- Daily , Weekly | |
| Add GUID to Watchlist: View: Get Complete GUID Trend Analysis ➞ | |
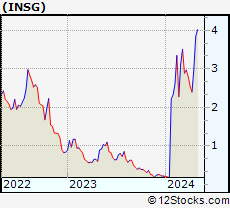 | INSG Inseego Corp |
| Sector: Technology | |
| SubSector: Communication Equipment | |
| MarketCap: 199.17 Millions | |
| Recent Price: 16.50 Smart Investing & Trading Score: 100 | |
| Day Percent Change: 4.69543% Day Change: 0.51 | |
| Week Change: 16.2791% Year-to-date Change: 60.7% | |
| INSG Links: Profile News Message Board | |
| Charts:- Daily , Weekly | |
| Add INSG to Watchlist: View: Get Complete INSG Trend Analysis ➞ | |
 | TCX Tucows, Inc |
| Sector: Technology | |
| SubSector: Software - Infrastructure | |
| MarketCap: 197.53 Millions | |
| Recent Price: 18.05 Smart Investing & Trading Score: 10 | |
| Day Percent Change: -1.52755% Day Change: -0.47 | |
| Week Change: -5.19958% Year-to-date Change: 7.6% | |
| TCX Links: Profile News Message Board | |
| Charts:- Daily , Weekly | |
| Add TCX to Watchlist: View: Get Complete TCX Trend Analysis ➞ | |
 | AKTS Akoustis Technologies, Inc. |
| Sector: Technology | |
| SubSector: Communication Equipment | |
| MarketCap: 197.039 Millions | |
| Recent Price: 0.02 Smart Investing & Trading Score: 10 | |
| Day Percent Change: 4.84848% Day Change: -9999 | |
| Week Change: -79.5024% Year-to-date Change: 0.0% | |
| AKTS Links: Profile News Message Board | |
| Charts:- Daily , Weekly | |
| Add AKTS to Watchlist: View: Get Complete AKTS Trend Analysis ➞ | |
 | WOLF Wolfspeed Inc |
| Sector: Technology | |
| SubSector: Semiconductors | |
| MarketCap: 195.59 Millions | |
| Recent Price: 24.95 Smart Investing & Trading Score: 20 | |
| Day Percent Change: 0.24% Day Change: 0.06 | |
| Week Change: 1961.98% Year-to-date Change: 307.0% | |
| WOLF Links: Profile News Message Board | |
| Charts:- Daily , Weekly | |
| Add WOLF to Watchlist: View: Get Complete WOLF Trend Analysis ➞ | |
 | PERF Perfect Corp |
| Sector: Technology | |
| SubSector: Software - Application | |
| MarketCap: 195.55 Millions | |
| Recent Price: 1.94 Smart Investing & Trading Score: 50 | |
| Day Percent Change: 1.04167% Day Change: -0.02 | |
| Week Change: 1.04167% Year-to-date Change: -33.6% | |
| PERF Links: Profile News Message Board | |
| Charts:- Daily , Weekly | |
| Add PERF to Watchlist: View: Get Complete PERF Trend Analysis ➞ | |
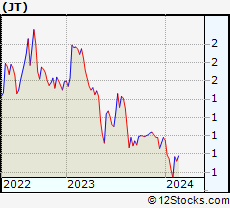 | JT Jianpu Technology Inc. |
| Sector: Technology | |
| SubSector: Information Technology Services | |
| MarketCap: 192.368 Millions | |
| Recent Price: 0.78 Smart Investing & Trading Score: 40 | |
| Day Percent Change: 7.78054% Day Change: -9999 | |
| Week Change: 5.39189% Year-to-date Change: 0.0% | |
| JT Links: Profile News Message Board | |
| Charts:- Daily , Weekly | |
| Add JT to Watchlist: View: Get Complete JT Trend Analysis ➞ | |
 | TRUE Truecar Inc |
| Sector: Technology | |
| SubSector: Internet Content & Information | |
| MarketCap: 191.03 Millions | |
| Recent Price: 1.79 Smart Investing & Trading Score: 20 | |
| Day Percent Change: 4.97076% Day Change: 0.04 | |
| Week Change: -17.2811% Year-to-date Change: -48.7% | |
| TRUE Links: Profile News Message Board | |
| Charts:- Daily , Weekly | |
| Add TRUE to Watchlist: View: Get Complete TRUE Trend Analysis ➞ | |
 | MRT Marti Technologies Inc |
| Sector: Technology | |
| SubSector: Software - Application | |
| MarketCap: 189.92 Millions | |
| Recent Price: 2.34 Smart Investing & Trading Score: 50 | |
| Day Percent Change: 17% Day Change: -2.42 | |
| Week Change: -0.847458% Year-to-date Change: -30.4% | |
| MRT Links: Profile News Message Board | |
| Charts:- Daily , Weekly | |
| Add MRT to Watchlist: View: Get Complete MRT Trend Analysis ➞ | |
 | VUZI Vuzix Corporation |
| Sector: Technology | |
| SubSector: Consumer Electronics | |
| MarketCap: 187.94 Millions | |
| Recent Price: 3.79 Smart Investing & Trading Score: 100 | |
| Day Percent Change: 8.90805% Day Change: -0.02 | |
| Week Change: 20.7006% Year-to-date Change: -8.5% | |
| VUZI Links: Profile News Message Board | |
| Charts:- Daily , Weekly | |
| Add VUZI to Watchlist: View: Get Complete VUZI Trend Analysis ➞ | |
 | PLPM Planet Payment, Inc. |
| Sector: Technology | |
| SubSector: Technical & System Software | |
| MarketCap: 187.8 Millions | |
| Recent Price: 16.00 Smart Investing & Trading Score: 20 | |
| Day Percent Change: 0.502513% Day Change: -9999 | |
| Week Change: -2.02082% Year-to-date Change: 0.0% | |
| PLPM Links: Profile News Message Board | |
| Charts:- Daily , Weekly | |
| Add PLPM to Watchlist: View: Get Complete PLPM Trend Analysis ➞ | |
 | ECOM ChannelAdvisor Corporation |
| Sector: Technology | |
| SubSector: Application Software | |
| MarketCap: 187.362 Millions | |
| Recent Price: 5.49 Smart Investing & Trading Score: 10 | |
| Day Percent Change: -1.08108% Day Change: -9999 | |
| Week Change: -76.2235% Year-to-date Change: 0.0% | |
| ECOM Links: Profile News Message Board | |
| Charts:- Daily , Weekly | |
| Add ECOM to Watchlist: View: Get Complete ECOM Trend Analysis ➞ | |
 | SYT SYLA Technologies Co., Ltd. |
| Sector: Technology | |
| SubSector: Software - Application | |
| MarketCap: 187 Millions | |
| Recent Price: 1.50 Smart Investing & Trading Score: 0 | |
| Day Percent Change: 0% Day Change: -9999 | |
| Week Change: -29.2453% Year-to-date Change: -25.0% | |
| SYT Links: Profile News Message Board | |
| Charts:- Daily , Weekly | |
| Add SYT to Watchlist: View: Get Complete SYT Trend Analysis ➞ | |
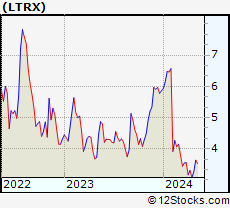 | LTRX Lantronix Inc |
| Sector: Technology | |
| SubSector: Communication Equipment | |
| MarketCap: 184.79 Millions | |
| Recent Price: 5.33 Smart Investing & Trading Score: 100 | |
| Day Percent Change: 6.81363% Day Change: 0.21 | |
| Week Change: 16.6302% Year-to-date Change: 31.0% | |
| LTRX Links: Profile News Message Board | |
| Charts:- Daily , Weekly | |
| Add LTRX to Watchlist: View: Get Complete LTRX Trend Analysis ➞ | |
 | BKKT Bakkt Holdings Inc |
| Sector: Technology | |
| SubSector: Software - Infrastructure | |
| MarketCap: 183.61 Millions | |
| Recent Price: 43.92 Smart Investing & Trading Score: 100 | |
| Day Percent Change: 28.6091% Day Change: -0.34 | |
| Week Change: 119.6% Year-to-date Change: 72.6% | |
| BKKT Links: Profile News Message Board | |
| Charts:- Daily , Weekly | |
| Add BKKT to Watchlist: View: Get Complete BKKT Trend Analysis ➞ | |
 | TTEC TTEC Holdings Inc |
| Sector: Technology | |
| SubSector: Information Technology Services | |
| MarketCap: 183.19 Millions | |
| Recent Price: 3.32 Smart Investing & Trading Score: 10 | |
| Day Percent Change: -2.92398% Day Change: -0.04 | |
| Week Change: -7.0028% Year-to-date Change: -31.0% | |
| TTEC Links: Profile News Message Board | |
| Charts:- Daily , Weekly | |
| Add TTEC to Watchlist: View: Get Complete TTEC Trend Analysis ➞ | |
| For tabular summary view of above stock list: Summary View ➞ 0 - 25 , 25 - 50 , 50 - 75 , 75 - 100 , 100 - 125 , 125 - 150 , 150 - 175 , 175 - 200 , 200 - 225 , 225 - 250 , 250 - 275 , 275 - 300 , 300 - 325 , 325 - 350 , 350 - 375 | ||
| Click To Change The Sort Order: By Market Cap or Company Size Performance: Year-to-date, Week and Day | |
| Select Chart Type: | ||
|
Best Stocks Today 12Stocks.com |
© 2025 12Stocks.com Terms & Conditions Privacy Contact Us
All Information Provided Only For Education And Not To Be Used For Investing or Trading. See Terms & Conditions


One More Thing ... Get Best Stocks Delivered Daily!
Never Ever Miss A Move With Our Top Ten Stocks Lists
Find Best Stocks In Any Market - Bull or Bear Market
Take A Peek At Our Top Ten Stocks Lists: Daily, Weekly, Year-to-Date & Top Trends
Find Best Stocks In Any Market - Bull or Bear Market
Take A Peek At Our Top Ten Stocks Lists: Daily, Weekly, Year-to-Date & Top Trends
Technology Stocks With Best Up Trends [0-bearish to 100-bullish]: Sony [100], Bakkt [100], Rigetti Computing[100], Fair Isaac[100], Arqit Quantum[100], D-Wave Quantum[100], Navitas Semiconductor[100], Shoals [100], Vuzix [100], Arteris [100], Lantronix [100]
Best Technology Stocks Year-to-Date:
Xunlei [370.476%], Sify [315.033%], Wolfspeed [307.01%], Digital Turbine[265.057%], EchoStar Corp[247.253%], CuriosityStream [241.605%], Viasat [224.029%], Pagaya [222.638%], Oneconnect Financial[209.053%], D-Wave Quantum[203.954%], CommScope Holding[203.101%] Best Technology Stocks This Week:
GTT [443626%], Barracuda Networks[71050%], Mobile TeleSystems[10483.5%], Nam Tai[5033.33%], Ebix [4200.85%], Fang [4150%], NantHealth [3114.02%], Hemisphere Media[2981.82%], Yandex N.V[2935.27%], Wolfspeed [1961.98%], Castlight Health[1751.96%] Best Technology Stocks Daily:
Sony [194.565%], Bakkt [28.6091%], Rigetti Computing[18.4925%], Fair Isaac[17.979%], Arqit Quantum[17.9369%], Marti [17%], Latch [16.6667%], Oclaro [14.734%], D-Wave Quantum[13.968%], Arbe Robotics[13.0178%], Navitas Semiconductor[12.3288%]