
 Login Sign Up


| |||||
 |  | ||||

| 12Stocks.com Market Intelligence |
Best Tech Stocks
| In a hurry? Tech Stocks Lists: Performance & Trends, Stock Charts, FANG Stocks
Sort Tech stocks: Daily, Weekly, Year-to-Date, Market Cap & Trends. Filter Tech stocks list by size:All Tech Large Mid-Range Small and MicroCap |
| 12Stocks.com Tech Stocks Performances & Trends Daily | |||||||||
|
|  The overall Smart Investing & Trading Score is 100 (0-bearish to 100-bullish) which puts Technology sector in short term bullish trend. The Smart Investing & Trading Score from previous trading session is 90 and an improvement of trend continues.
| ||||||||
Here are the Smart Investing & Trading Scores of the most requested Technology stocks at 12Stocks.com (click stock name for detailed review):
|


| 12Stocks.com: Investing in Technology sector with Stocks | |
|
The following table helps investors and traders sort through current performance and trends (as measured by Smart Investing & Trading Score) of various
stocks in the Tech sector. Quick View: Move mouse or cursor over stock symbol (ticker) to view short-term technical chart and over stock name to view long term chart. Click on  to add stock symbol to your watchlist and to add stock symbol to your watchlist and  to view watchlist. Click on any ticker or stock name for detailed market intelligence report for that stock. to view watchlist. Click on any ticker or stock name for detailed market intelligence report for that stock. |
12Stocks.com Performance of Stocks in Tech Sector
| Ticker | Stock Name | Watchlist | Category | Recent Price | Smart Investing & Trading Score | Change % | Weekly Change% |
| OCFT | Oneconnect Financial |   | Software - | 7.51 | 70 | -0.27% | 0.81% |
| VMEO | Vimeo | | Software - | 7.78 | 90 | 0.39% | 0.65% |
| SCWX | SecureWorks | | Software | 8.51 | 60 | 0.24% | 0.59% |
| CNDT | Conduent | | IT | 2.75 | 40 | -2.31% | 0.55% |
| SBGI | Slair | | Broadcasting | 14.62 | 40 | -0.65% | 0.45% |
| BCOV | Brightcove | | Software | 4.45 | 50 | 0.23% | 0.45% |
| LYTS | LSI Industries | | Electronic Components | 23.45 | 50 | -1.16% | 0.41% |
| MEI | Methode Electronics | | Electronic Components | 7.78 | 70 | 2.37% | 0.39% |
| PRO | Pros | | Software - | 22.99 | 90 | 0.26% | 0.35% |
| VPG | Vishay Precision | | Instruments | 32.48 | 80 | -0.76% | 0.28% |
| SHEN | Shenandoah Tele | | Telecom | 13.24 | 40 | 0.46% | 0.23% |
| IHRT | iHeartMedia | | Broadcasting | 2.71 | 50 | -5.42% | 0.19% |
| FARO | FARO | | Instruments | 43.99 | 60 | 0.48% | 0.18% |
| IVAC | Intevac | | Electronics | 4.00 | 70 | -0.13% | 0.18% |
| ITI | Iteris | | Communication | 7.19 | 50 | -0.14% | 0.14% |
| NXGN | NextGen Healthcare | | Healthcare Information | 23.94 | 50 | 0.00% | 0.13% |
| XRX | Xerox | | IT | 3.78 | 70 | -2.58% | 0.00% |
| ABTL | Autobytel | | Internet | 7.02 | 20 | 0.00% | 0.00% |
| VDSI | VASCO Data | | Security Software | 21.80 | 20 | 0.00% | 0.00% |
| SYX | Systemax | | Software | 35.16 | 10 | 0.00% | 0.00% |
| NVEC | NVE Corp | | Semiconductors | 66.58 | 90 | 2.07% | 0.00% |
| ASUR | Asure Software | | Software - | 8.15 | 20 | 1.49% | 0.00% |
| HCOM | Hawaiian Telcom | | Communication | 14.54 | 30 | 0.00% | 0.00% |
| KBAL | Kimball | | Circuit Boards | 12.30 | 20 | 0.00% | 0.00% |
| LFGR | Leaf | | Internet | 11.15 | 10 | 0.00% | 0.00% |
| For chart view version of above stock list: Chart View ➞ 0 - 25 , 25 - 50 , 50 - 75 , 75 - 100 , 100 - 125 , 125 - 150 , 150 - 175 , 175 - 200 , 200 - 225 , 225 - 250 , 250 - 275 , 275 - 300 , 300 - 325 , 325 - 350 , 350 - 375 | ||
 | Click To Change The Sort Order: By Market Cap or Company Size Performance: Year-to-date, Week and Day |  |
|
Get the most comprehensive stock market coverage daily at 12Stocks.com ➞ Best Stocks Today ➞ Best Stocks Weekly ➞ Best Stocks Year-to-Date ➞ Best Stocks Trends ➞  Best Stocks Today 12Stocks.com Best Nasdaq Stocks ➞ Best S&P 500 Stocks ➞ Best Tech Stocks ➞ Best Biotech Stocks ➞ |
| Detailed Overview of Tech Stocks |
| Tech Technical Overview, Leaders & Laggards, Top Tech ETF Funds & Detailed Tech Stocks List, Charts, Trends & More |
| Tech Sector: Technical Analysis, Trends & YTD Performance | |
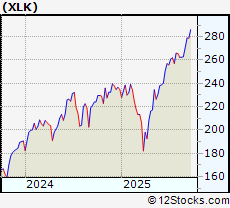
| Technology sector is composed of stocks
from semiconductors, software, web, social media
and services subsectors. Technology sector, as represented by XLK, an exchange-traded fund [ETF] that holds basket of tech stocks (e.g, Intel, Google) is up by 23.7823% and is currently outperforming the overall market by 9.0244% year-to-date. Below is a quick view of technical charts and trends: |
|
 XLK Weekly Chart |
|
| Long Term Trend: Very Good | |
| Medium Term Trend: Good | |
 XLK Daily Chart |
|
| Short Term Trend: Very Good | |
| Overall Trend Score: 100 | |
| YTD Performance: 23.7823% | |
| **Trend Scores & Views Are Only For Educational Purposes And Not For Investing | |
| 12Stocks.com: Top Performing Technology Sector Stocks | ||||||||||||||||||||||||||||||||||||||||||||||||
 The top performing Technology sector stocks year to date are
Now, more recently, over last week, the top performing Technology sector stocks on the move are


|
||||||||||||||||||||||||||||||||||||||||||||||||
| 12Stocks.com: Investing in Tech Sector using Exchange Traded Funds | |
|
The following table shows list of key exchange traded funds (ETF) that
help investors track Tech Index. For detailed view, check out our ETF Funds section of our website. Quick View: Move mouse or cursor over ETF symbol (ticker) to view short-term technical chart and over ETF name to view long term chart. Click on ticker or stock name for detailed view. Click on to add stock symbol to your watchlist and to view watchlist. |
12Stocks.com List of ETFs that track Tech Index
| Ticker | ETF Name | Watchlist | Recent Price | Smart Investing & Trading Score | Change % | Week % | Year-to-date % |
| IGN | Tech-Multimd Ntwk | | 53.86 | 40 | 0.918119 | -20.6435 | 0% |
| 12Stocks.com: Charts, Trends, Fundamental Data and Performances of Tech Stocks | |
|
We now take in-depth look at all Tech stocks including charts, multi-period performances and overall trends (as measured by Smart Investing & Trading Score). One can sort Tech stocks (click link to choose) by Daily, Weekly and by Year-to-Date performances. Also, one can sort by size of the company or by market capitalization. |
| Select Your Default Chart Type: | |||||
| |||||
| Click on stock symbol or name for detailed view. Click on to add stock symbol to your watchlist and to view watchlist. Quick View: Move mouse or cursor over "Daily" to quickly view daily technical stock chart and over "Weekly" to view weekly technical stock chart. | |||||


 | OCFT Oneconnect Financial Technology Co Ltd ADR |
| Sector: Technology | |
| SubSector: Software - Application | |
| MarketCap: 265.26 Millions | |
| Recent Price: 7.51 Smart Investing & Trading Score: 70 | |
| Day Percent Change: -0.265604% Day Change: 0.08 | |
| Week Change: 0.805369% Year-to-date Change: 209.1% | |
| OCFT Links: Profile News Message Board | |
| Charts:- Daily , Weekly | |
| Add OCFT to Watchlist: View: Get Complete OCFT Trend Analysis ➞ | |
 | VMEO Vimeo Inc |
| Sector: Technology | |
| SubSector: Software - Application | |
| MarketCap: 734.1 Millions | |
| Recent Price: 7.78 Smart Investing & Trading Score: 90 | |
| Day Percent Change: 0.387097% Day Change: -0.01 | |
| Week Change: 0.646831% Year-to-date Change: 20.1% | |
| VMEO Links: Profile News Message Board | |
| Charts:- Daily , Weekly | |
| Add VMEO to Watchlist: View: Get Complete VMEO Trend Analysis ➞ | |
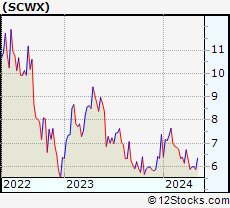 | SCWX SecureWorks Corp. |
| Sector: Technology | |
| SubSector: Application Software | |
| MarketCap: 986 Millions | |
| Recent Price: 8.51 Smart Investing & Trading Score: 60 | |
| Day Percent Change: 0.235571% Day Change: -9999 | |
| Week Change: 0.591017% Year-to-date Change: 0.8% | |
| SCWX Links: Profile News Message Board | |
| Charts:- Daily , Weekly | |
| Add SCWX to Watchlist: View: Get Complete SCWX Trend Analysis ➞ | |
 | CNDT Conduent Inc |
| Sector: Technology | |
| SubSector: Information Technology Services | |
| MarketCap: 447.07 Millions | |
| Recent Price: 2.75 Smart Investing & Trading Score: 40 | |
| Day Percent Change: -2.31317% Day Change: -0.03 | |
| Week Change: 0.549451% Year-to-date Change: -31.7% | |
| CNDT Links: Profile News Message Board | |
| Charts:- Daily , Weekly | |
| Add CNDT to Watchlist: View: Get Complete CNDT Trend Analysis ➞ | |
 | SBGI Sinclair Inc |
| Sector: Technology | |
| SubSector: Broadcasting | |
| MarketCap: 963.91 Millions | |
| Recent Price: 14.62 Smart Investing & Trading Score: 40 | |
| Day Percent Change: -0.645819% Day Change: 0.19 | |
| Week Change: 0.446735% Year-to-date Change: -10.9% | |
| SBGI Links: Profile News Message Board | |
| Charts:- Daily , Weekly | |
| Add SBGI to Watchlist: View: Get Complete SBGI Trend Analysis ➞ | |
 | BCOV Brightcove Inc. |
| Sector: Technology | |
| SubSector: Application Software | |
| MarketCap: 266.162 Millions | |
| Recent Price: 4.45 Smart Investing & Trading Score: 50 | |
| Day Percent Change: 0.225225% Day Change: -9999 | |
| Week Change: 0.451467% Year-to-date Change: 2.8% | |
| BCOV Links: Profile News Message Board | |
| Charts:- Daily , Weekly | |
| Add BCOV to Watchlist: View: Get Complete BCOV Trend Analysis ➞ | |
 | LYTS LSI Industries Inc |
| Sector: Technology | |
| SubSector: Electronic Components | |
| MarketCap: 698.8 Millions | |
| Recent Price: 23.45 Smart Investing & Trading Score: 50 | |
| Day Percent Change: -1.15887% Day Change: 1.1 | |
| Week Change: 0.406678% Year-to-date Change: 21.8% | |
| LYTS Links: Profile News Message Board | |
| Charts:- Daily , Weekly | |
| Add LYTS to Watchlist: View: Get Complete LYTS Trend Analysis ➞ | |
 | MEI Methode Electronics, Inc |
| Sector: Technology | |
| SubSector: Electronic Components | |
| MarketCap: 250.32 Millions | |
| Recent Price: 7.78 Smart Investing & Trading Score: 70 | |
| Day Percent Change: 2.36842% Day Change: -0.02 | |
| Week Change: 0.387097% Year-to-date Change: -31.1% | |
| MEI Links: Profile News Message Board | |
| Charts:- Daily , Weekly | |
| Add MEI to Watchlist: View: Get Complete MEI Trend Analysis ➞ | |
 | PRO Pros Holdings Inc |
| Sector: Technology | |
| SubSector: Software - Application | |
| MarketCap: 745.65 Millions | |
| Recent Price: 22.99 Smart Investing & Trading Score: 90 | |
| Day Percent Change: 0.261666% Day Change: 0.41 | |
| Week Change: 0.349193% Year-to-date Change: 7.0% | |
| PRO Links: Profile News Message Board | |
| Charts:- Daily , Weekly | |
| Add PRO to Watchlist: View: Get Complete PRO Trend Analysis ➞ | |
 | VPG Vishay Precision Group Inc |
| Sector: Technology | |
| SubSector: Scientific & Technical Instruments | |
| MarketCap: 393.99 Millions | |
| Recent Price: 32.48 Smart Investing & Trading Score: 80 | |
| Day Percent Change: -0.763825% Day Change: 0.03 | |
| Week Change: 0.277864% Year-to-date Change: 39.7% | |
| VPG Links: Profile News Message Board | |
| Charts:- Daily , Weekly | |
| Add VPG to Watchlist: View: Get Complete VPG Trend Analysis ➞ | |
 | SHEN Shenandoah Telecommunications Co |
| Sector: Technology | |
| SubSector: Telecom Services | |
| MarketCap: 738.37 Millions | |
| Recent Price: 13.24 Smart Investing & Trading Score: 40 | |
| Day Percent Change: 0.455235% Day Change: 0.21 | |
| Week Change: 0.227101% Year-to-date Change: 7.3% | |
| SHEN Links: Profile News Message Board | |
| Charts:- Daily , Weekly | |
| Add SHEN to Watchlist: View: Get Complete SHEN Trend Analysis ➞ | |
 | IHRT iHeartMedia Inc |
| Sector: Technology | |
| SubSector: Broadcasting | |
| MarketCap: 293.26 Millions | |
| Recent Price: 2.71 Smart Investing & Trading Score: 50 | |
| Day Percent Change: -5.41958% Day Change: -0.01 | |
| Week Change: 0.185185% Year-to-date Change: 33.9% | |
| IHRT Links: Profile News Message Board | |
| Charts:- Daily , Weekly | |
| Add IHRT to Watchlist: View: Get Complete IHRT Trend Analysis ➞ | |
 | FARO FARO Technologies, Inc. |
| Sector: Technology | |
| SubSector: Scientific & Technical Instruments | |
| MarketCap: 721.953 Millions | |
| Recent Price: 43.99 Smart Investing & Trading Score: 60 | |
| Day Percent Change: 0.479671% Day Change: -9999 | |
| Week Change: 0.182191% Year-to-date Change: 68.9% | |
| FARO Links: Profile News Message Board | |
| Charts:- Daily , Weekly | |
| Add FARO to Watchlist: View: Get Complete FARO Trend Analysis ➞ | |
 | IVAC Intevac, Inc. |
| Sector: Technology | |
| SubSector: Diversified Electronics | |
| MarketCap: 89.2396 Millions | |
| Recent Price: 4.00 Smart Investing & Trading Score: 70 | |
| Day Percent Change: -0.125% Day Change: -9999 | |
| Week Change: 0.178039% Year-to-date Change: 18.8% | |
| IVAC Links: Profile News Message Board | |
| Charts:- Daily , Weekly | |
| Add IVAC to Watchlist: View: Get Complete IVAC Trend Analysis ➞ | |
 | ITI Iteris, Inc. |
| Sector: Technology | |
| SubSector: Communication Equipment | |
| MarketCap: 129.939 Millions | |
| Recent Price: 7.19 Smart Investing & Trading Score: 50 | |
| Day Percent Change: -0.138889% Day Change: -9999 | |
| Week Change: 0.139276% Year-to-date Change: 0.0% | |
| ITI Links: Profile News Message Board | |
| Charts:- Daily , Weekly | |
| Add ITI to Watchlist: View: Get Complete ITI Trend Analysis ➞ | |
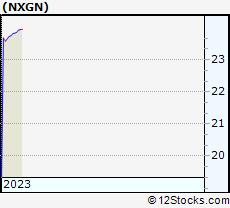 | NXGN NextGen Healthcare, Inc. |
| Sector: Technology | |
| SubSector: Healthcare Information Services | |
| MarketCap: 571.655 Millions | |
| Recent Price: 23.94 Smart Investing & Trading Score: 50 | |
| Day Percent Change: 0% Day Change: -9999 | |
| Week Change: 0.125471% Year-to-date Change: 0.0% | |
| NXGN Links: Profile News Message Board | |
| Charts:- Daily , Weekly | |
| Add NXGN to Watchlist: View: Get Complete NXGN Trend Analysis ➞ | |
 | XRX Xerox Holdings Corp |
| Sector: Technology | |
| SubSector: Information Technology Services | |
| MarketCap: 493.25 Millions | |
| Recent Price: 3.78 Smart Investing & Trading Score: 70 | |
| Day Percent Change: -2.57732% Day Change: -0.13 | |
| Week Change: 0% Year-to-date Change: -52.9% | |
| XRX Links: Profile News Message Board | |
| Charts:- Daily , Weekly | |
| Add XRX to Watchlist: View: Get Complete XRX Trend Analysis ➞ | |
 | ABTL Autobytel Inc. |
| Sector: Technology | |
| SubSector: Internet Information Providers | |
| MarketCap: 133.9 Millions | |
| Recent Price: 7.02 Smart Investing & Trading Score: 20 | |
| Day Percent Change: 0% Day Change: -9999 | |
| Week Change: 0% Year-to-date Change: 0.0% | |
| ABTL Links: Profile News Message Board | |
| Charts:- Daily , Weekly | |
| Add ABTL to Watchlist: View: Get Complete ABTL Trend Analysis ➞ | |
 | VDSI VASCO Data Security International, Inc. |
| Sector: Technology | |
| SubSector: Security Software & Services | |
| MarketCap: 506.45 Millions | |
| Recent Price: 21.80 Smart Investing & Trading Score: 20 | |
| Day Percent Change: 0% Day Change: -9999 | |
| Week Change: 0% Year-to-date Change: 0.0% | |
| VDSI Links: Profile News Message Board | |
| Charts:- Daily , Weekly | |
| Add VDSI to Watchlist: View: Get Complete VDSI Trend Analysis ➞ | |
 | SYX Systemax Inc. |
| Sector: Technology | |
| SubSector: Technical & System Software | |
| MarketCap: 688.7 Millions | |
| Recent Price: 35.16 Smart Investing & Trading Score: 10 | |
| Day Percent Change: 0% Day Change: -9999 | |
| Week Change: 0% Year-to-date Change: 0.0% | |
| SYX Links: Profile News Message Board | |
| Charts:- Daily , Weekly | |
| Add SYX to Watchlist: View: Get Complete SYX Trend Analysis ➞ | |
 | NVEC NVE Corp |
| Sector: Technology | |
| SubSector: Semiconductors | |
| MarketCap: 322.76 Millions | |
| Recent Price: 66.58 Smart Investing & Trading Score: 90 | |
| Day Percent Change: 2.0696% Day Change: 0.3 | |
| Week Change: 0% Year-to-date Change: -15.7% | |
| NVEC Links: Profile News Message Board | |
| Charts:- Daily , Weekly | |
| Add NVEC to Watchlist: View: Get Complete NVEC Trend Analysis ➞ | |
 | ASUR Asure Software Inc |
| Sector: Technology | |
| SubSector: Software - Application | |
| MarketCap: 220.22 Millions | |
| Recent Price: 8.15 Smart Investing & Trading Score: 20 | |
| Day Percent Change: 1.4944% Day Change: 0.14 | |
| Week Change: 0% Year-to-date Change: -13.9% | |
| ASUR Links: Profile News Message Board | |
| Charts:- Daily , Weekly | |
| Add ASUR to Watchlist: View: Get Complete ASUR Trend Analysis ➞ | |
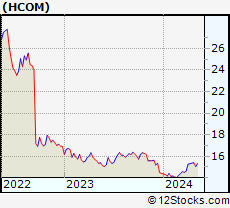 | HCOM Hawaiian Telcom Holdco, Inc. |
| Sector: Technology | |
| SubSector: Diversified Communication Services | |
| MarketCap: 272.82 Millions | |
| Recent Price: 14.54 Smart Investing & Trading Score: 30 | |
| Day Percent Change: 0% Day Change: -9999 | |
| Week Change: 0% Year-to-date Change: 8.7% | |
| HCOM Links: Profile News Message Board | |
| Charts:- Daily , Weekly | |
| Add HCOM to Watchlist: View: Get Complete HCOM Trend Analysis ➞ | |
 | KBAL Kimball International, Inc. |
| Sector: Technology | |
| SubSector: Printed Circuit Boards | |
| MarketCap: 359.235 Millions | |
| Recent Price: 12.30 Smart Investing & Trading Score: 20 | |
| Day Percent Change: 0% Day Change: -9999 | |
| Week Change: 0% Year-to-date Change: 0.0% | |
| KBAL Links: Profile News Message Board | |
| Charts:- Daily , Weekly | |
| Add KBAL to Watchlist: View: Get Complete KBAL Trend Analysis ➞ | |
 | LFGR Leaf Group Ltd. |
| Sector: Technology | |
| SubSector: Internet Information Providers | |
| MarketCap: 156.85 Millions | |
| Recent Price: 11.15 Smart Investing & Trading Score: 10 | |
| Day Percent Change: 0% Day Change: -9999 | |
| Week Change: 0% Year-to-date Change: 0.0% | |
| LFGR Links: Profile News Message Board | |
| Charts:- Daily , Weekly | |
| Add LFGR to Watchlist: View: Get Complete LFGR Trend Analysis ➞ | |
| For tabular summary view of above stock list: Summary View ➞ 0 - 25 , 25 - 50 , 50 - 75 , 75 - 100 , 100 - 125 , 125 - 150 , 150 - 175 , 175 - 200 , 200 - 225 , 225 - 250 , 250 - 275 , 275 - 300 , 300 - 325 , 325 - 350 , 350 - 375 | ||
| Click To Change The Sort Order: By Market Cap or Company Size Performance: Year-to-date, Week and Day | |
| Select Chart Type: | ||
|
Best Stocks Today 12Stocks.com |
© 2025 12Stocks.com Terms & Conditions Privacy Contact Us
All Information Provided Only For Education And Not To Be Used For Investing or Trading. See Terms & Conditions


One More Thing ... Get Best Stocks Delivered Daily!
Never Ever Miss A Move With Our Top Ten Stocks Lists
Find Best Stocks In Any Market - Bull or Bear Market
Take A Peek At Our Top Ten Stocks Lists: Daily, Weekly, Year-to-Date & Top Trends
Find Best Stocks In Any Market - Bull or Bear Market
Take A Peek At Our Top Ten Stocks Lists: Daily, Weekly, Year-to-Date & Top Trends
Technology Stocks With Best Up Trends [0-bearish to 100-bullish]: Sony [100], Bakkt [100], Rigetti Computing[100], Fair Isaac[100], Arqit Quantum[100], D-Wave Quantum[100], Navitas Semiconductor[100], Shoals [100], Vuzix [100], Arteris [100], Lantronix [100]
Best Technology Stocks Year-to-Date:
Xunlei [370.476%], Sify [315.033%], Wolfspeed [307.01%], Digital Turbine[265.057%], EchoStar Corp[247.253%], CuriosityStream [241.605%], Viasat [224.029%], Pagaya [222.638%], Oneconnect Financial[209.053%], D-Wave Quantum[203.954%], CommScope Holding[203.101%] Best Technology Stocks This Week:
GTT [443626%], Barracuda Networks[71050%], Mobile TeleSystems[10483.5%], Nam Tai[5033.33%], Ebix [4200.85%], Fang [4150%], NantHealth [3114.02%], Hemisphere Media[2981.82%], Yandex N.V[2935.27%], Wolfspeed [1961.98%], Castlight Health[1751.96%] Best Technology Stocks Daily:
Sony [194.565%], Bakkt [28.6091%], Rigetti Computing[18.4925%], Fair Isaac[17.979%], Arqit Quantum[17.9369%], Marti [17%], Latch [16.6667%], Oclaro [14.734%], D-Wave Quantum[13.968%], Arbe Robotics[13.0178%], Navitas Semiconductor[12.3288%]