
 Login Sign Up


| |||||
 |  | ||||

| 12Stocks.com Market Intelligence |
Best Tech Stocks
| In a hurry? Tech Stocks Lists: Performance & Trends, Stock Charts, FANG Stocks
Sort Tech stocks: Daily, Weekly, Year-to-Date, Market Cap & Trends. Filter Tech stocks list by size:All Tech Large Mid-Range Small and MicroCap |
| 12Stocks.com Tech Stocks Performances & Trends Daily | |||||||||
|
|  The overall Smart Investing & Trading Score is 100 (0-bearish to 100-bullish) which puts Technology sector in short term bullish trend. The Smart Investing & Trading Score from previous trading session is 90 and an improvement of trend continues.
| ||||||||
Here are the Smart Investing & Trading Scores of the most requested Technology stocks at 12Stocks.com (click stock name for detailed review):
|


| 12Stocks.com: Investing in Technology sector with Stocks | |
|
The following table helps investors and traders sort through current performance and trends (as measured by Smart Investing & Trading Score) of various
stocks in the Tech sector. Quick View: Move mouse or cursor over stock symbol (ticker) to view short-term technical chart and over stock name to view long term chart. Click on  to add stock symbol to your watchlist and to add stock symbol to your watchlist and  to view watchlist. Click on any ticker or stock name for detailed market intelligence report for that stock. to view watchlist. Click on any ticker or stock name for detailed market intelligence report for that stock. |
12Stocks.com Performance of Stocks in Tech Sector
| Ticker | Stock Name | Watchlist | Category | Recent Price | Smart Investing & Trading Score | Change % | YTD Change% |
| IAS | Integral Ad |   | Advertising Agencies | 10.22 | 90 | 0.39% | -3.40% |
| LASR | nLIGHT | | Semiconductors | 31.09 | 90 | 2.30% | 198.94% |
| GOGO | Gogo | | Telecom | 8.62 | 40 | 3.11% | 3.86% |
| IQ | iQIYI | | Entertainment | 2.48 | 20 | -1.20% | 24.62% |
| ROG | Rogers Corp | | Electronic Components | 82.20 | 80 | 0.45% | -16.89% |
| AMC | AMC Entertainment | | Entertainment | 3.15 | 90 | 6.78% | -21.64% |
| PLTK | Playtika Holding | | Electronic Gaming & Multimedia | 3.85 | 40 | -1.91% | -41.63% |
| EGOV | NIC | | Software | 57.69 | 20 | 2.23% | 0.00% |
| INOD | Innodata | | IT | 87.34 | 100 | 6.05% | 121.12% |
| IMPV | Imperva | | Software | 57.69 | 70 | 2.23% | 0.00% |
| ARRY | Array | | Solar | 8.77 | 100 | -3.73% | 30.12% |
| PLAB | Photronics | | Semiconductor | 24.58 | 90 | 5.49% | 2.37% |
| MXL | MaxLinear | | Semiconductors | 16.21 | 80 | -0.92% | -17.17% |
| TUYA | Tuya | | Software - Infrastructure | 2.50 | 40 | 1.21% | 45.45% |
| RDFN | Redfin | | Internet | 11.19 | 40 | -0.36% | 43.65% |
| BASE | Couchbase | | Software - Infrastructure | 24.51 | 90 | 0.04% | 57.62% |
| CRTO | Criteo S.A | | Advertising Agencies | 21.31 | 0 | -3.92% | -45.82% |
| KEM | KEMET | | Electronics | 27.57 | 20 | 0.00% | 6.55% |
| EVOP | EVO Payments | | Software | 33.99 | 20 | 0.00% | 0.00% |
| RPD | Rapid7 | | Software - Infrastructure | 18.64 | 10 | 0.00% | -52.67% |
| BSFT | BroadSoft | | Software | 18.39 | 40 | 0.00% | 0.00% |
| DGII | Digi | | Communication | 36.95 | 70 | 1.71% | 26.09% |
| CALD | Callidus Software | | Software | 28.32 | 50 | 1.36% | 0.00% |
| TV | Grupo Televisa | | Telecom | 2.54 | 0 | -1.93% | 52.09% |
| SCPL | SciPlay | | Software | 22.94 | 50 | 0.00% | 0.00% |
| For chart view version of above stock list: Chart View ➞ 0 - 25 , 25 - 50 , 50 - 75 , 75 - 100 , 100 - 125 , 125 - 150 , 150 - 175 , 175 - 200 , 200 - 225 , 225 - 250 , 250 - 275 , 275 - 300 , 300 - 325 , 325 - 350 | ||
 | Click To Change The Sort Order: By Market Cap or Company Size Performance: Year-to-date, Week and Day |  |
|
Get the most comprehensive stock market coverage daily at 12Stocks.com ➞ Best Stocks Today ➞ Best Stocks Weekly ➞ Best Stocks Year-to-Date ➞ Best Stocks Trends ➞  Best Stocks Today 12Stocks.com Best Nasdaq Stocks ➞ Best S&P 500 Stocks ➞ Best Tech Stocks ➞ Best Biotech Stocks ➞ |
| Detailed Overview of Tech Stocks |
| Tech Technical Overview, Leaders & Laggards, Top Tech ETF Funds & Detailed Tech Stocks List, Charts, Trends & More |
| Tech Sector: Technical Analysis, Trends & YTD Performance | |
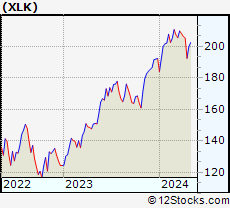
| Technology sector is composed of stocks
from semiconductors, software, web, social media
and services subsectors. Technology sector, as represented by XLK, an exchange-traded fund [ETF] that holds basket of tech stocks (e.g, Intel, Google) is up by 23.7823% and is currently outperforming the overall market by 9.0244% year-to-date. Below is a quick view of technical charts and trends: |
|
 XLK Weekly Chart |
|
| Long Term Trend: Very Good | |
| Medium Term Trend: Good | |
 XLK Daily Chart |
|
| Short Term Trend: Very Good | |
| Overall Trend Score: 100 | |
| YTD Performance: 23.7823% | |
| **Trend Scores & Views Are Only For Educational Purposes And Not For Investing | |
| 12Stocks.com: Top Performing Technology Sector Stocks | ||||||||||||||||||||||||||||||||||||||||||||||||
 The top performing Technology sector stocks year to date are
Now, more recently, over last week, the top performing Technology sector stocks on the move are


|
||||||||||||||||||||||||||||||||||||||||||||||||
| 12Stocks.com: Investing in Tech Sector using Exchange Traded Funds | |
|
The following table shows list of key exchange traded funds (ETF) that
help investors track Tech Index. For detailed view, check out our ETF Funds section of our website. Quick View: Move mouse or cursor over ETF symbol (ticker) to view short-term technical chart and over ETF name to view long term chart. Click on ticker or stock name for detailed view. Click on to add stock symbol to your watchlist and to view watchlist. |
12Stocks.com List of ETFs that track Tech Index
| Ticker | ETF Name | Watchlist | Recent Price | Smart Investing & Trading Score | Change % | Week % | Year-to-date % |
| IGN | Tech-Multimd Ntwk | | 53.86 | 40 | 0.918119 | -20.6435 | 0% |
| 12Stocks.com: Charts, Trends, Fundamental Data and Performances of Tech Stocks | |
|
We now take in-depth look at all Tech stocks including charts, multi-period performances and overall trends (as measured by Smart Investing & Trading Score). One can sort Tech stocks (click link to choose) by Daily, Weekly and by Year-to-Date performances. Also, one can sort by size of the company or by market capitalization. |
| Select Your Default Chart Type: | |||||
| |||||
| Click on stock symbol or name for detailed view. Click on to add stock symbol to your watchlist and to view watchlist. Quick View: Move mouse or cursor over "Daily" to quickly view daily technical stock chart and over "Weekly" to view weekly technical stock chart. | |||||


 | IAS Integral Ad Science Holding Corp |
| Sector: Technology | |
| SubSector: Advertising Agencies | |
| MarketCap: 1448.95 Millions | |
| Recent Price: 10.22 Smart Investing & Trading Score: 90 | |
| Day Percent Change: 0.392927% Day Change: 0.2 | |
| Week Change: 0.294406% Year-to-date Change: -3.4% | |
| IAS Links: Profile News Message Board | |
| Charts:- Daily , Weekly | |
| Add IAS to Watchlist: View: Get Complete IAS Trend Analysis ➞ | |
 | LASR nLIGHT Inc |
| Sector: Technology | |
| SubSector: Semiconductors | |
| MarketCap: 1440.6 Millions | |
| Recent Price: 31.09 Smart Investing & Trading Score: 90 | |
| Day Percent Change: 2.30339% Day Change: 1.09 | |
| Week Change: 6.72846% Year-to-date Change: 198.9% | |
| LASR Links: Profile News Message Board | |
| Charts:- Daily , Weekly | |
| Add LASR to Watchlist: View: Get Complete LASR Trend Analysis ➞ | |
 | GOGO Gogo Inc |
| Sector: Technology | |
| SubSector: Telecom Services | |
| MarketCap: 1433.11 Millions | |
| Recent Price: 8.62 Smart Investing & Trading Score: 40 | |
| Day Percent Change: 3.11005% Day Change: -1.14 | |
| Week Change: 1.17371% Year-to-date Change: 3.9% | |
| GOGO Links: Profile News Message Board | |
| Charts:- Daily , Weekly | |
| Add GOGO to Watchlist: View: Get Complete GOGO Trend Analysis ➞ | |
 | IQ iQIYI Inc ADR |
| Sector: Technology | |
| SubSector: Entertainment | |
| MarketCap: 1431.96 Millions | |
| Recent Price: 2.48 Smart Investing & Trading Score: 20 | |
| Day Percent Change: -1.19522% Day Change: 0.05 | |
| Week Change: -8.14815% Year-to-date Change: 24.6% | |
| IQ Links: Profile News Message Board | |
| Charts:- Daily , Weekly | |
| Add IQ to Watchlist: View: Get Complete IQ Trend Analysis ➞ | |
 | ROG Rogers Corp |
| Sector: Technology | |
| SubSector: Electronic Components | |
| MarketCap: 1427.26 Millions | |
| Recent Price: 82.20 Smart Investing & Trading Score: 80 | |
| Day Percent Change: 0.452157% Day Change: 0.76 | |
| Week Change: 3.12382% Year-to-date Change: -16.9% | |
| ROG Links: Profile News Message Board | |
| Charts:- Daily , Weekly | |
| Add ROG to Watchlist: View: Get Complete ROG Trend Analysis ➞ | |
 | AMC AMC Entertainment Holdings Inc |
| Sector: Technology | |
| SubSector: Entertainment | |
| MarketCap: 1410.59 Millions | |
| Recent Price: 3.15 Smart Investing & Trading Score: 90 | |
| Day Percent Change: 6.77966% Day Change: 0.06 | |
| Week Change: 7.87671% Year-to-date Change: -21.6% | |
| AMC Links: Profile News Message Board | |
| Charts:- Daily , Weekly | |
| Add AMC to Watchlist: View: Get Complete AMC Trend Analysis ➞ | |
 | PLTK Playtika Holding Corp |
| Sector: Technology | |
| SubSector: Electronic Gaming & Multimedia | |
| MarketCap: 1397.96 Millions | |
| Recent Price: 3.85 Smart Investing & Trading Score: 40 | |
| Day Percent Change: -1.91327% Day Change: -0.1 | |
| Week Change: 7.70308% Year-to-date Change: -41.6% | |
| PLTK Links: Profile News Message Board | |
| Charts:- Daily , Weekly | |
| Add PLTK to Watchlist: View: Get Complete PLTK Trend Analysis ➞ | |
 | EGOV NIC Inc. |
| Sector: Technology | |
| SubSector: Application Software | |
| MarketCap: 1388.02 Millions | |
| Recent Price: 57.69 Smart Investing & Trading Score: 20 | |
| Day Percent Change: 2.23285% Day Change: -9999 | |
| Week Change: -71.5827% Year-to-date Change: 0.0% | |
| EGOV Links: Profile News Message Board | |
| Charts:- Daily , Weekly | |
| Add EGOV to Watchlist: View: Get Complete EGOV Trend Analysis ➞ | |
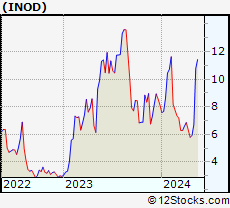 | INOD Innodata Inc |
| Sector: Technology | |
| SubSector: Information Technology Services | |
| MarketCap: 1384.65 Millions | |
| Recent Price: 87.34 Smart Investing & Trading Score: 100 | |
| Day Percent Change: 6.04808% Day Change: -0.53 | |
| Week Change: 25.8066% Year-to-date Change: 121.1% | |
| INOD Links: Profile News Message Board | |
| Charts:- Daily , Weekly | |
| Add INOD to Watchlist: View: Get Complete INOD Trend Analysis ➞ | |
 | IMPV Imperva, Inc. |
| Sector: Technology | |
| SubSector: Application Software | |
| MarketCap: 1384.32 Millions | |
| Recent Price: 57.69 Smart Investing & Trading Score: 70 | |
| Day Percent Change: 2.23285% Day Change: -9999 | |
| Week Change: 315.934% Year-to-date Change: 0.0% | |
| IMPV Links: Profile News Message Board | |
| Charts:- Daily , Weekly | |
| Add IMPV to Watchlist: View: Get Complete IMPV Trend Analysis ➞ | |
 | ARRY Array Technologies Inc |
| Sector: Technology | |
| SubSector: Solar | |
| MarketCap: 1369.94 Millions | |
| Recent Price: 8.77 Smart Investing & Trading Score: 100 | |
| Day Percent Change: -3.73216% Day Change: -0.54 | |
| Week Change: 10.0376% Year-to-date Change: 30.1% | |
| ARRY Links: Profile News Message Board | |
| Charts:- Daily , Weekly | |
| Add ARRY to Watchlist: View: Get Complete ARRY Trend Analysis ➞ | |
 | PLAB Photronics, Inc |
| Sector: Technology | |
| SubSector: Semiconductor Equipment & Materials | |
| MarketCap: 1361.81 Millions | |
| Recent Price: 24.58 Smart Investing & Trading Score: 90 | |
| Day Percent Change: 5.49356% Day Change: 0.25 | |
| Week Change: 0.0407% Year-to-date Change: 2.4% | |
| PLAB Links: Profile News Message Board | |
| Charts:- Daily , Weekly | |
| Add PLAB to Watchlist: View: Get Complete PLAB Trend Analysis ➞ | |
 | MXL MaxLinear Inc |
| Sector: Technology | |
| SubSector: Semiconductors | |
| MarketCap: 1361.07 Millions | |
| Recent Price: 16.21 Smart Investing & Trading Score: 80 | |
| Day Percent Change: -0.91687% Day Change: 0.88 | |
| Week Change: 0.808458% Year-to-date Change: -17.2% | |
| MXL Links: Profile News Message Board | |
| Charts:- Daily , Weekly | |
| Add MXL to Watchlist: View: Get Complete MXL Trend Analysis ➞ | |
 | TUYA Tuya Inc ADR |
| Sector: Technology | |
| SubSector: Software - Infrastructure | |
| MarketCap: 1359.24 Millions | |
| Recent Price: 2.50 Smart Investing & Trading Score: 40 | |
| Day Percent Change: 1.21457% Day Change: 0.07 | |
| Week Change: 2.04082% Year-to-date Change: 45.5% | |
| TUYA Links: Profile News Message Board | |
| Charts:- Daily , Weekly | |
| Add TUYA to Watchlist: View: Get Complete TUYA Trend Analysis ➞ | |
 | RDFN Redfin Corporation |
| Sector: Technology | |
| SubSector: Internet Information Providers | |
| MarketCap: 1356.2 Millions | |
| Recent Price: 11.19 Smart Investing & Trading Score: 40 | |
| Day Percent Change: -0.356189% Day Change: -9999 | |
| Week Change: -0.44484% Year-to-date Change: 43.6% | |
| RDFN Links: Profile News Message Board | |
| Charts:- Daily , Weekly | |
| Add RDFN to Watchlist: View: Get Complete RDFN Trend Analysis ➞ | |
 | BASE Couchbase Inc |
| Sector: Technology | |
| SubSector: Software - Infrastructure | |
| MarketCap: 1350.41 Millions | |
| Recent Price: 24.51 Smart Investing & Trading Score: 90 | |
| Day Percent Change: 0.0408163% Day Change: -0.01 | |
| Week Change: 0.36855% Year-to-date Change: 57.6% | |
| BASE Links: Profile News Message Board | |
| Charts:- Daily , Weekly | |
| Add BASE to Watchlist: View: Get Complete BASE Trend Analysis ➞ | |
 | CRTO Criteo S.A ADR |
| Sector: Technology | |
| SubSector: Advertising Agencies | |
| MarketCap: 1349.64 Millions | |
| Recent Price: 21.31 Smart Investing & Trading Score: 0 | |
| Day Percent Change: -3.92245% Day Change: -0.2 | |
| Week Change: -5.03565% Year-to-date Change: -45.8% | |
| CRTO Links: Profile News Message Board | |
| Charts:- Daily , Weekly | |
| Add CRTO to Watchlist: View: Get Complete CRTO Trend Analysis ➞ | |
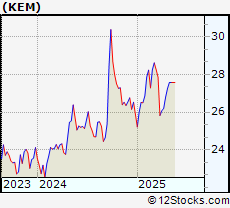 | KEM KEMET Corporation |
| Sector: Technology | |
| SubSector: Diversified Electronics | |
| MarketCap: 1343.66 Millions | |
| Recent Price: 27.57 Smart Investing & Trading Score: 20 | |
| Day Percent Change: 0% Day Change: -9999 | |
| Week Change: 0% Year-to-date Change: 6.5% | |
| KEM Links: Profile News Message Board | |
| Charts:- Daily , Weekly | |
| Add KEM to Watchlist: View: Get Complete KEM Trend Analysis ➞ | |
 | EVOP EVO Payments, Inc. |
| Sector: Technology | |
| SubSector: Business Software & Services | |
| MarketCap: 1327.68 Millions | |
| Recent Price: 33.99 Smart Investing & Trading Score: 20 | |
| Day Percent Change: 0% Day Change: -9999 | |
| Week Change: 0% Year-to-date Change: 0.0% | |
| EVOP Links: Profile News Message Board | |
| Charts:- Daily , Weekly | |
| Add EVOP to Watchlist: View: Get Complete EVOP Trend Analysis ➞ | |
 | RPD Rapid7 Inc |
| Sector: Technology | |
| SubSector: Software - Infrastructure | |
| MarketCap: 1315.64 Millions | |
| Recent Price: 18.64 Smart Investing & Trading Score: 10 | |
| Day Percent Change: 0% Day Change: -0.16 | |
| Week Change: -4.06588% Year-to-date Change: -52.7% | |
| RPD Links: Profile News Message Board | |
| Charts:- Daily , Weekly | |
| Add RPD to Watchlist: View: Get Complete RPD Trend Analysis ➞ | |
 | BSFT BroadSoft, Inc. |
| Sector: Technology | |
| SubSector: Application Software | |
| MarketCap: 1297.94 Millions | |
| Recent Price: 18.39 Smart Investing & Trading Score: 40 | |
| Day Percent Change: 0% Day Change: -9999 | |
| Week Change: -12.8849% Year-to-date Change: 0.0% | |
| BSFT Links: Profile News Message Board | |
| Charts:- Daily , Weekly | |
| Add BSFT to Watchlist: View: Get Complete BSFT Trend Analysis ➞ | |
 | DGII Digi International, Inc |
| Sector: Technology | |
| SubSector: Communication Equipment | |
| MarketCap: 1287.77 Millions | |
| Recent Price: 36.95 Smart Investing & Trading Score: 70 | |
| Day Percent Change: 1.70658% Day Change: -0.47 | |
| Week Change: -0.296816% Year-to-date Change: 26.1% | |
| DGII Links: Profile News Message Board | |
| Charts:- Daily , Weekly | |
| Add DGII to Watchlist: View: Get Complete DGII Trend Analysis ➞ | |
 | CALD Callidus Software Inc. |
| Sector: Technology | |
| SubSector: Business Software & Services | |
| MarketCap: 1287.14 Millions | |
| Recent Price: 28.32 Smart Investing & Trading Score: 50 | |
| Day Percent Change: 1.36006% Day Change: -9999 | |
| Week Change: 1.14286% Year-to-date Change: 0.0% | |
| CALD Links: Profile News Message Board | |
| Charts:- Daily , Weekly | |
| Add CALD to Watchlist: View: Get Complete CALD Trend Analysis ➞ | |
 | TV Grupo Televisa SAB ADR |
| Sector: Technology | |
| SubSector: Telecom Services | |
| MarketCap: 1281.93 Millions | |
| Recent Price: 2.54 Smart Investing & Trading Score: 0 | |
| Day Percent Change: -1.9305% Day Change: -0.01 | |
| Week Change: -5.57621% Year-to-date Change: 52.1% | |
| TV Links: Profile News Message Board | |
| Charts:- Daily , Weekly | |
| Add TV to Watchlist: View: Get Complete TV Trend Analysis ➞ | |
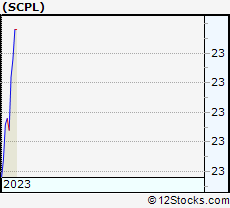 | SCPL SciPlay Corporation |
| Sector: Technology | |
| SubSector: Multimedia & Graphics Software | |
| MarketCap: 1280.46 Millions | |
| Recent Price: 22.94 Smart Investing & Trading Score: 50 | |
| Day Percent Change: 0% Day Change: -9999 | |
| Week Change: 0.130947% Year-to-date Change: 0.0% | |
| SCPL Links: Profile News Message Board | |
| Charts:- Daily , Weekly | |
| Add SCPL to Watchlist: View: Get Complete SCPL Trend Analysis ➞ | |
| For tabular summary view of above stock list: Summary View ➞ 0 - 25 , 25 - 50 , 50 - 75 , 75 - 100 , 100 - 125 , 125 - 150 , 150 - 175 , 175 - 200 , 200 - 225 , 225 - 250 , 250 - 275 , 275 - 300 , 300 - 325 , 325 - 350 | ||
| Click To Change The Sort Order: By Market Cap or Company Size Performance: Year-to-date, Week and Day | |
| Select Chart Type: | ||
|
Best Stocks Today 12Stocks.com |
© 2025 12Stocks.com Terms & Conditions Privacy Contact Us
All Information Provided Only For Education And Not To Be Used For Investing or Trading. See Terms & Conditions


One More Thing ... Get Best Stocks Delivered Daily!
Never Ever Miss A Move With Our Top Ten Stocks Lists
Find Best Stocks In Any Market - Bull or Bear Market
Take A Peek At Our Top Ten Stocks Lists: Daily, Weekly, Year-to-Date & Top Trends
Find Best Stocks In Any Market - Bull or Bear Market
Take A Peek At Our Top Ten Stocks Lists: Daily, Weekly, Year-to-Date & Top Trends
Technology Stocks With Best Up Trends [0-bearish to 100-bullish]: Sony [100], Bakkt [100], Rigetti Computing[100], Fair Isaac[100], Arqit Quantum[100], D-Wave Quantum[100], Navitas Semiconductor[100], Shoals [100], Vuzix [100], Arteris [100], Lantronix [100]
Best Technology Stocks Year-to-Date:
Xunlei [370.476%], Sify [315.033%], Wolfspeed [307.01%], Digital Turbine[265.057%], EchoStar Corp[247.253%], CuriosityStream [241.605%], Viasat [224.029%], Pagaya [222.638%], Oneconnect Financial[209.053%], D-Wave Quantum[203.954%], CommScope Holding[203.101%] Best Technology Stocks This Week:
GTT [443626%], Barracuda Networks[71050%], Mobile TeleSystems[10483.5%], Nam Tai[5033.33%], Ebix [4200.85%], Fang [4150%], NantHealth [3114.02%], Hemisphere Media[2981.82%], Yandex N.V[2935.27%], Wolfspeed [1961.98%], Castlight Health[1751.96%] Best Technology Stocks Daily:
Sony [194.565%], Bakkt [28.6091%], Rigetti Computing[18.4925%], Fair Isaac[17.979%], Arqit Quantum[17.9369%], Marti [17%], Latch [16.6667%], Oclaro [14.734%], D-Wave Quantum[13.968%], Arbe Robotics[13.0178%], Navitas Semiconductor[12.3288%]