
 Login Sign Up


| |||||
 |  | ||||

| 12Stocks.com Market Intelligence |
Best SmallCap Stocks
|
| In a hurry? Small Cap Stock Lists: Performance Trends Table, Stock Charts
Sort Small Cap stocks: Daily, Weekly, Year-to-Date, Market Cap & Trends. Filter Small Cap stocks list by sector: Show all, Tech, Finance, Energy, Staples, Retail, Industrial, Materials, Utilities and HealthCare Filter Small Cap stocks list by size: All Large Medium Small and MicroCap |
| 12Stocks.com Small Cap Stocks Performances & Trends Daily | |||||||||
|
|  The overall Smart Investing & Trading Score is 88 (0-bearish to 100-bullish) which puts Small Cap index in short term bullish trend. The Smart Investing & Trading Score from previous trading session is 56 and hence an improvement of trend.
| ||||||||
Here are the Smart Investing & Trading Scores of the most requested small cap stocks at 12Stocks.com (click stock name for detailed review):
|


| 12Stocks.com: Investing in Smallcap Index with Stocks | |
|
The following table helps investors and traders sort through current performance and trends (as measured by Smart Investing & Trading Score) of various
stocks in the Smallcap Index. Quick View: Move mouse or cursor over stock symbol (ticker) to view short-term technical chart and over stock name to view long term chart. Click on  to add stock symbol to your watchlist and to add stock symbol to your watchlist and  to view watchlist. Click on any ticker or stock name for detailed market intelligence report for that stock. to view watchlist. Click on any ticker or stock name for detailed market intelligence report for that stock. |
12Stocks.com Performance of Stocks in Smallcap Index
| Ticker | Stock Name | Watchlist | Category | Recent Price | Smart Investing & Trading Score | Change % | YTD Change% |
| GH | Guardant Health |   | Health Care | 18.19 | 45 | 4.84% | -32.75% |
| CVNA | Carvana Co | | Services & Goods | 85.44 | 85 | 1.33% | 61.38% |
| NE | Noble | | Energy | 46.22 | 51 | -0.15% | -4.03% |
| ACAD | ACADIA | | Health Care | 17.02 | 50 | 1.86% | -45.64% |
| FRSH | Freshworks | | Technology | 18.63 | 55 | 1.00% | -20.71% |
| DEI | Douglas Emmett | | Financials | 13.66 | 93 | 2.21% | -5.76% |
| HLF | Herbalife Nutrition | | Consumer Staples | 8.93 | 44 | 1.31% | -41.51% |
| SWI | SolarWinds | | Technology | 11.17 | 42 | 0.45% | -10.57% |
| VAL | Valaris | | Energy | 69.85 | 70 | 0.94% | 1.87% |
| HAE | Haemonetics | | Health Care | 90.70 | 100 | -0.32% | 6.07% |
| AIV | Apartment | | Financials | 8.09 | 73 | 0.50% | 3.32% |
| JBGS | JBG SMITH | | Financials | 15.37 | 54 | 1.55% | -9.67% |
| POR | Portland General | | Utilities | 43.24 | 68 | 1.03% | -0.23% |
| XRX | Xerox | | Technology | 14.02 | 10 | 0.14% | -23.51% |
| LANC | Lancaster Colony | | Consumer Staples | 188.82 | 51 | 0.95% | 13.48% |
| OGS | ONE Gas | | Utilities | 64.27 | 63 | 0.50% | 0.86% |
| SLG | SL Green | | Financials | 51.74 | 75 | 2.23% | 14.55% |
| BYND | Beyond Meat | | Consumer Staples | 6.78 | 95 | 5.94% | -23.82% |
| VIR | Vir | | Health Care | 8.30 | 42 | 0.91% | -17.45% |
| BBIO | BridgeBio Pharma | | Health Care | 25.27 | 42 | 1.59% | -37.39% |
| CCOI | Cogent | | Technology | 65.98 | 59 | 0.29% | -13.25% |
| MMS | MAXIMUS | | Services & Goods | 80.89 | 70 | 0.57% | -3.54% |
| SR | Spire | | Utilities | 61.63 | 83 | 0.37% | -1.14% |
| SLAB | Silicon | | Technology | 122.44 | 55 | 0.25% | -7.43% |
| EVBG | Everbridge | | Technology | 34.87 | 61 | -0.03% | 43.44% |
| For chart view version of above stock list: Chart View ➞ 0 - 25 , 25 - 50 , 50 - 75 , 75 - 100 , 100 - 125 , 125 - 150 , 150 - 175 , 175 - 200 , 200 - 225 , 225 - 250 , 250 - 275 , 275 - 300 , 300 - 325 , 325 - 350 , 350 - 375 , 375 - 400 , 400 - 425 , 425 - 450 , 450 - 475 , 475 - 500 , 500 - 525 , 525 - 550 , 550 - 575 , 575 - 600 , 600 - 625 , 625 - 650 , 650 - 675 , 675 - 700 , 700 - 725 , 725 - 750 , 750 - 775 , 775 - 800 , 800 - 825 , 825 - 850 , 850 - 875 , 875 - 900 , 900 - 925 , 925 - 950 , 950 - 975 , 975 - 1000 , 1000 - 1025 , 1025 - 1050 , 1050 - 1075 , 1075 - 1100 , 1100 - 1125 , 1125 - 1150 , 1150 - 1175 , 1175 - 1200 , 1200 - 1225 , 1225 - 1250 , 1250 - 1275 , 1275 - 1300 , 1300 - 1325 , 1325 - 1350 , 1350 - 1375 , 1375 - 1400 , 1400 - 1425 , 1425 - 1450 , 1450 - 1475 , 1475 - 1500 | ||
 | Click To Change The Sort Order: By Market Cap or Company Size Performance: Year-to-date, Week and Day |  |
| Too many stocks? View smallcap stocks filtered by marketcap & sector |
| Marketcap: All SmallCap Stocks (default-no microcap), Large, Mid-Range, Small |
| Smallcap Sector: Tech, Finance, Energy, Staples, Retail, Industrial, Materials, & Medical |
|
Get the most comprehensive stock market coverage daily at 12Stocks.com ➞ Best Stocks Today ➞ Best Stocks Weekly ➞ Best Stocks Year-to-Date ➞ Best Stocks Trends ➞  Best Stocks Today 12Stocks.com Best Nasdaq Stocks ➞ Best S&P 500 Stocks ➞ Best Tech Stocks ➞ Best Biotech Stocks ➞ |
| Detailed Overview of SmallCap Stocks |
| SmallCap Technical Overview, Leaders & Laggards, Top SmallCap ETF Funds & Detailed SmallCap Stocks List, Charts, Trends & More |
| Smallcap: Technical Analysis, Trends & YTD Performance | |
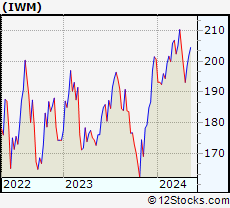
| SmallCap segment as represented by
IWM, an exchange-traded fund [ETF], holds basket of thousands of smallcap stocks from across all major sectors of the US stock market. The smallcap index (contains stocks like Riverbed & Sotheby's) is down by -0.44% and is currently underperforming the overall market by -6.94% year-to-date. Below is a quick view of technical charts and trends: | |
 IWM Weekly Chart |
|
| Long Term Trend: Very Good | |
| Medium Term Trend: Good | |
 IWM Daily Chart |
|
| Short Term Trend: Very Good | |
| Overall Trend Score: 88 | |
| YTD Performance: -0.44% | |
| **Trend Scores & Views Are Only For Educational Purposes And Not For Investing | |
| 12Stocks.com: Top Performing Small Cap Index Stocks | ||||||||||||||||||||||||||||||||||||||||||||||||
 The top performing Small Cap Index stocks year to date are
Now, more recently, over last week, the top performing Small Cap Index stocks on the move are


|
||||||||||||||||||||||||||||||||||||||||||||||||
| 12Stocks.com: Investing in Smallcap Index using Exchange Traded Funds | |
|
The following table shows list of key exchange traded funds (ETF) that
help investors track Smallcap index. The following list also includes leveraged ETF funds that track twice or thrice the daily returns of Smallcap indices. Short or inverse ETF funds move in the opposite direction to the index they track and are useful during market pullbacks or during bear markets. Quick View: Move mouse or cursor over ETF symbol (ticker) to view short-term technical chart and over ETF name to view long term chart. Click on ticker or stock name for detailed view. Click on to add stock symbol to your watchlist and to view watchlist. |
12Stocks.com List of ETFs that track Smallcap Index
| Ticker | ETF Name | Watchlist | Recent Price | Smart Investing & Trading Score | Change % | Week % | Year-to-date % |
| IWM | iShares Russell 2000 | | 199.82 | 88 | 0.72 | 0.72 | -0.44% |
| VTWO | Vanguard Russell 2000 ETF | | 80.77 | 88 | 0.69 | 0.69 | -0.41% |
| IWN | iShares Russell 2000 Value | | 152.09 | 93 | 0.63 | 0.63 | -2.09% |
| IJR | iShares Core S&P Small-Cap | | 106.37 | 93 | 0.68 | 0.68 | -1.74% |
| IWO | iShares Russell 2000 Growth | | 255.17 | 78 | 0.82 | 0.82 | 1.17% |
| IJS | iShares S&P Small-Cap 600 Value | | 97.96 | 70 | 0.79 | 0.79 | -4.96% |
| XSLV | PowerShares S&P SmallCap Low Volatil ETF | | 42.97 | 80 | 0.59 | 0.59 | -2.67% |
| IJT | iShares S&P Small-Cap 600 Growth | | 126.09 | 88 | 0.00 | 0 | 0.76% |
| SBB | ProShares Short SmallCap600 | | 16.31 | 8 | -0.46 | -0.46 | 2.39% |
| SMLV | SPDR SSGA US Small Cap Low Volatil ETF | | 107.77 | 75 | 0.23 | 0.23 | -4.22% |
| SAA | ProShares Ultra SmallCap600 | | 23.00 | 88 | -0.18 | -0.18 | -7.82% |
| SDD | ProShares UltraShort SmallCap600 | | 19.33 | 15 | -0.12 | -0.12 | 4.89% |
| 12Stocks.com: Charts, Trends, Fundamental Data and Performances of SmallCap Stocks | |
|
We now take in-depth look at all SmallCap stocks including charts, multi-period performances and overall trends (as measured by Smart Investing & Trading Score). One can sort SmallCap stocks (click link to choose) by Daily, Weekly and by Year-to-Date performances. Also, one can sort by size of the company or by market capitalization. |
| Select Your Default Chart Type: | |||||
| |||||
| Click on stock symbol or name for detailed view. Click on to add stock symbol to your watchlist and to view watchlist. Quick View: Move mouse or cursor over "Daily" to quickly view daily technical stock chart and over "Weekly" to view weekly technical stock chart. | |||||

 | GH Guardant Health, Inc. |
| Sector: Health Care | |
| SubSector: Medical Laboratories & Research | |
| MarketCap: 5678.7 Millions | |
| Recent Price: 18.19 Smart Investing & Trading Score: 45 | |
| Day Percent Change: 4.84% Day Change: 0.84 | |
| Week Change: 4.84% Year-to-date Change: -32.8% | |
| GH Links: Profile News Message Board | |
| Charts:- Daily , Weekly | |
| Add GH to Watchlist: View: Get Complete GH Trend Analysis ➞ | |
 | CVNA Carvana Co. |
| Sector: Services & Goods | |
| SubSector: Auto Dealerships | |
| MarketCap: 5585.31 Millions | |
| Recent Price: 85.44 Smart Investing & Trading Score: 85 | |
| Day Percent Change: 1.33% Day Change: 1.13 | |
| Week Change: 1.33% Year-to-date Change: 61.4% | |
| CVNA Links: Profile News Message Board | |
| Charts:- Daily , Weekly | |
| Add CVNA to Watchlist: View: Get Complete CVNA Trend Analysis ➞ | |
 | NE Noble Corporation Plc |
| Sector: Energy | |
| SubSector: Oil & Gas Drilling | |
| MarketCap: 5520 Millions | |
| Recent Price: 46.22 Smart Investing & Trading Score: 51 | |
| Day Percent Change: -0.15% Day Change: -0.07 | |
| Week Change: -0.15% Year-to-date Change: -4.0% | |
| NE Links: Profile News Message Board | |
| Charts:- Daily , Weekly | |
| Add NE to Watchlist: View: Get Complete NE Trend Analysis ➞ | |
 | ACAD ACADIA Pharmaceuticals Inc. |
| Sector: Health Care | |
| SubSector: Biotechnology | |
| MarketCap: 5400.35 Millions | |
| Recent Price: 17.02 Smart Investing & Trading Score: 50 | |
| Day Percent Change: 1.86% Day Change: 0.31 | |
| Week Change: 1.86% Year-to-date Change: -45.6% | |
| ACAD Links: Profile News Message Board | |
| Charts:- Daily , Weekly | |
| Add ACAD to Watchlist: View: Get Complete ACAD Trend Analysis ➞ | |
 | FRSH Freshworks Inc. |
| Sector: Technology | |
| SubSector: Software - Application | |
| MarketCap: 5000 Millions | |
| Recent Price: 18.63 Smart Investing & Trading Score: 55 | |
| Day Percent Change: 1.00% Day Change: 0.18 | |
| Week Change: 1% Year-to-date Change: -20.7% | |
| FRSH Links: Profile News Message Board | |
| Charts:- Daily , Weekly | |
| Add FRSH to Watchlist: View: Get Complete FRSH Trend Analysis ➞ | |
 | DEI Douglas Emmett, Inc. |
| Sector: Financials | |
| SubSector: REIT - Diversified | |
| MarketCap: 4917.83 Millions | |
| Recent Price: 13.66 Smart Investing & Trading Score: 93 | |
| Day Percent Change: 2.21% Day Change: 0.29 | |
| Week Change: 2.21% Year-to-date Change: -5.8% | |
| DEI Links: Profile News Message Board | |
| Charts:- Daily , Weekly | |
| Add DEI to Watchlist: View: Get Complete DEI Trend Analysis ➞ | |
 | HLF Herbalife Nutrition Ltd. |
| Sector: Consumer Staples | |
| SubSector: Personal Products | |
| MarketCap: 4884.65 Millions | |
| Recent Price: 8.93 Smart Investing & Trading Score: 44 | |
| Day Percent Change: 1.31% Day Change: 0.12 | |
| Week Change: 1.31% Year-to-date Change: -41.5% | |
| HLF Links: Profile News Message Board | |
| Charts:- Daily , Weekly | |
| Add HLF to Watchlist: View: Get Complete HLF Trend Analysis ➞ | |
 | SWI SolarWinds Corporation |
| Sector: Technology | |
| SubSector: Application Software | |
| MarketCap: 4524.62 Millions | |
| Recent Price: 11.17 Smart Investing & Trading Score: 42 | |
| Day Percent Change: 0.45% Day Change: 0.05 | |
| Week Change: 0.45% Year-to-date Change: -10.6% | |
| SWI Links: Profile News Message Board | |
| Charts:- Daily , Weekly | |
| Add SWI to Watchlist: View: Get Complete SWI Trend Analysis ➞ | |
 | VAL Valaris Limited |
| Sector: Energy | |
| SubSector: Oil & Gas Equipment & Services | |
| MarketCap: 4520 Millions | |
| Recent Price: 69.85 Smart Investing & Trading Score: 70 | |
| Day Percent Change: 0.94% Day Change: 0.65 | |
| Week Change: 0.94% Year-to-date Change: 1.9% | |
| VAL Links: Profile News Message Board | |
| Charts:- Daily , Weekly | |
| Add VAL to Watchlist: View: Get Complete VAL Trend Analysis ➞ | |
 | HAE Haemonetics Corporation |
| Sector: Health Care | |
| SubSector: Medical Instruments & Supplies | |
| MarketCap: 4500.7 Millions | |
| Recent Price: 90.70 Smart Investing & Trading Score: 100 | |
| Day Percent Change: -0.32% Day Change: -0.29 | |
| Week Change: -0.32% Year-to-date Change: 6.1% | |
| HAE Links: Profile News Message Board | |
| Charts:- Daily , Weekly | |
| Add HAE to Watchlist: View: Get Complete HAE Trend Analysis ➞ | |
 | AIV Apartment Investment and Management Company |
| Sector: Financials | |
| SubSector: REIT - Residential | |
| MarketCap: 4485.11 Millions | |
| Recent Price: 8.09 Smart Investing & Trading Score: 73 | |
| Day Percent Change: 0.50% Day Change: 0.04 | |
| Week Change: 0.5% Year-to-date Change: 3.3% | |
| AIV Links: Profile News Message Board | |
| Charts:- Daily , Weekly | |
| Add AIV to Watchlist: View: Get Complete AIV Trend Analysis ➞ | |
 | JBGS JBG SMITH Properties |
| Sector: Financials | |
| SubSector: Property Management | |
| MarketCap: 4335.32 Millions | |
| Recent Price: 15.37 Smart Investing & Trading Score: 54 | |
| Day Percent Change: 1.55% Day Change: 0.23 | |
| Week Change: 1.55% Year-to-date Change: -9.7% | |
| JBGS Links: Profile News Message Board | |
| Charts:- Daily , Weekly | |
| Add JBGS to Watchlist: View: Get Complete JBGS Trend Analysis ➞ | |
 | POR Portland General Electric Company |
| Sector: Utilities | |
| SubSector: Electric Utilities | |
| MarketCap: 4291.84 Millions | |
| Recent Price: 43.24 Smart Investing & Trading Score: 68 | |
| Day Percent Change: 1.03% Day Change: 0.44 | |
| Week Change: 1.03% Year-to-date Change: -0.2% | |
| POR Links: Profile News Message Board | |
| Charts:- Daily , Weekly | |
| Add POR to Watchlist: View: Get Complete POR Trend Analysis ➞ | |
 | XRX Xerox Holdings Corporation |
| Sector: Technology | |
| SubSector: Information Technology Services | |
| MarketCap: 4077.48 Millions | |
| Recent Price: 14.02 Smart Investing & Trading Score: 10 | |
| Day Percent Change: 0.14% Day Change: 0.02 | |
| Week Change: 0.14% Year-to-date Change: -23.5% | |
| XRX Links: Profile News Message Board | |
| Charts:- Daily , Weekly | |
| Add XRX to Watchlist: View: Get Complete XRX Trend Analysis ➞ | |
 | LANC Lancaster Colony Corporation |
| Sector: Consumer Staples | |
| SubSector: Food - Major Diversified | |
| MarketCap: 4060.83 Millions | |
| Recent Price: 188.82 Smart Investing & Trading Score: 51 | |
| Day Percent Change: 0.95% Day Change: 1.78 | |
| Week Change: 0.95% Year-to-date Change: 13.5% | |
| LANC Links: Profile News Message Board | |
| Charts:- Daily , Weekly | |
| Add LANC to Watchlist: View: Get Complete LANC Trend Analysis ➞ | |
 | OGS ONE Gas, Inc. |
| Sector: Utilities | |
| SubSector: Gas Utilities | |
| MarketCap: 4051.17 Millions | |
| Recent Price: 64.27 Smart Investing & Trading Score: 63 | |
| Day Percent Change: 0.50% Day Change: 0.32 | |
| Week Change: 0.5% Year-to-date Change: 0.9% | |
| OGS Links: Profile News Message Board | |
| Charts:- Daily , Weekly | |
| Add OGS to Watchlist: View: Get Complete OGS Trend Analysis ➞ | |
 | SLG SL Green Realty Corp. |
| Sector: Financials | |
| SubSector: REIT - Retail | |
| MarketCap: 4048.14 Millions | |
| Recent Price: 51.74 Smart Investing & Trading Score: 75 | |
| Day Percent Change: 2.23% Day Change: 1.13 | |
| Week Change: 2.23% Year-to-date Change: 14.6% | |
| SLG Links: Profile News Message Board | |
| Charts:- Daily , Weekly | |
| Add SLG to Watchlist: View: Get Complete SLG Trend Analysis ➞ | |
 | BYND Beyond Meat, Inc. |
| Sector: Consumer Staples | |
| SubSector: Processed & Packaged Goods | |
| MarketCap: 3987.98 Millions | |
| Recent Price: 6.78 Smart Investing & Trading Score: 95 | |
| Day Percent Change: 5.94% Day Change: 0.38 | |
| Week Change: 5.94% Year-to-date Change: -23.8% | |
| BYND Links: Profile News Message Board | |
| Charts:- Daily , Weekly | |
| Add BYND to Watchlist: View: Get Complete BYND Trend Analysis ➞ | |
 | VIR Vir Biotechnology, Inc. |
| Sector: Health Care | |
| SubSector: Biotechnology | |
| MarketCap: 3916.75 Millions | |
| Recent Price: 8.30 Smart Investing & Trading Score: 42 | |
| Day Percent Change: 0.91% Day Change: 0.07 | |
| Week Change: 0.91% Year-to-date Change: -17.5% | |
| VIR Links: Profile News Message Board | |
| Charts:- Daily , Weekly | |
| Add VIR to Watchlist: View: Get Complete VIR Trend Analysis ➞ | |
 | BBIO BridgeBio Pharma, Inc. |
| Sector: Health Care | |
| SubSector: Biotechnology | |
| MarketCap: 3879.35 Millions | |
| Recent Price: 25.27 Smart Investing & Trading Score: 42 | |
| Day Percent Change: 1.59% Day Change: 0.39 | |
| Week Change: 1.59% Year-to-date Change: -37.4% | |
| BBIO Links: Profile News Message Board | |
| Charts:- Daily , Weekly | |
| Add BBIO to Watchlist: View: Get Complete BBIO Trend Analysis ➞ | |
 | CCOI Cogent Communications Holdings, Inc. |
| Sector: Technology | |
| SubSector: Diversified Communication Services | |
| MarketCap: 3868.14 Millions | |
| Recent Price: 65.98 Smart Investing & Trading Score: 59 | |
| Day Percent Change: 0.29% Day Change: 0.19 | |
| Week Change: 0.29% Year-to-date Change: -13.3% | |
| CCOI Links: Profile News Message Board | |
| Charts:- Daily , Weekly | |
| Add CCOI to Watchlist: View: Get Complete CCOI Trend Analysis ➞ | |
 | MMS MAXIMUS, Inc. |
| Sector: Services & Goods | |
| SubSector: Business Services | |
| MarketCap: 3833.02 Millions | |
| Recent Price: 80.89 Smart Investing & Trading Score: 70 | |
| Day Percent Change: 0.57% Day Change: 0.46 | |
| Week Change: 0.57% Year-to-date Change: -3.5% | |
| MMS Links: Profile News Message Board | |
| Charts:- Daily , Weekly | |
| Add MMS to Watchlist: View: Get Complete MMS Trend Analysis ➞ | |
 | SR Spire Inc. |
| Sector: Utilities | |
| SubSector: Gas Utilities | |
| MarketCap: 3745.87 Millions | |
| Recent Price: 61.63 Smart Investing & Trading Score: 83 | |
| Day Percent Change: 0.37% Day Change: 0.23 | |
| Week Change: 0.37% Year-to-date Change: -1.1% | |
| SR Links: Profile News Message Board | |
| Charts:- Daily , Weekly | |
| Add SR to Watchlist: View: Get Complete SR Trend Analysis ➞ | |
 | SLAB Silicon Laboratories Inc. |
| Sector: Technology | |
| SubSector: Semiconductor - Integrated Circuits | |
| MarketCap: 3710.2 Millions | |
| Recent Price: 122.44 Smart Investing & Trading Score: 55 | |
| Day Percent Change: 0.25% Day Change: 0.31 | |
| Week Change: 0.25% Year-to-date Change: -7.4% | |
| SLAB Links: Profile News Message Board | |
| Charts:- Daily , Weekly | |
| Add SLAB to Watchlist: View: Get Complete SLAB Trend Analysis ➞ | |
 | EVBG Everbridge, Inc. |
| Sector: Technology | |
| SubSector: Application Software | |
| MarketCap: 3697.92 Millions | |
| Recent Price: 34.87 Smart Investing & Trading Score: 61 | |
| Day Percent Change: -0.03% Day Change: -0.01 | |
| Week Change: -0.03% Year-to-date Change: 43.4% | |
| EVBG Links: Profile News Message Board | |
| Charts:- Daily , Weekly | |
| Add EVBG to Watchlist: View: Get Complete EVBG Trend Analysis ➞ | |
| For tabular summary view of above stock list: Summary View ➞ 0 - 25 , 25 - 50 , 50 - 75 , 75 - 100 , 100 - 125 , 125 - 150 , 150 - 175 , 175 - 200 , 200 - 225 , 225 - 250 , 250 - 275 , 275 - 300 , 300 - 325 , 325 - 350 , 350 - 375 , 375 - 400 , 400 - 425 , 425 - 450 , 450 - 475 , 475 - 500 , 500 - 525 , 525 - 550 , 550 - 575 , 575 - 600 , 600 - 625 , 625 - 650 , 650 - 675 , 675 - 700 , 700 - 725 , 725 - 750 , 750 - 775 , 775 - 800 , 800 - 825 , 825 - 850 , 850 - 875 , 875 - 900 , 900 - 925 , 925 - 950 , 950 - 975 , 975 - 1000 , 1000 - 1025 , 1025 - 1050 , 1050 - 1075 , 1075 - 1100 , 1100 - 1125 , 1125 - 1150 , 1150 - 1175 , 1175 - 1200 , 1200 - 1225 , 1225 - 1250 , 1250 - 1275 , 1275 - 1300 , 1300 - 1325 , 1325 - 1350 , 1350 - 1375 , 1375 - 1400 , 1400 - 1425 , 1425 - 1450 , 1450 - 1475 , 1475 - 1500 | ||
| Click To Change The Sort Order: By Market Cap or Company Size Performance: Year-to-date, Week and Day | |
| Select Chart Type: | ||
| Too many stocks? View smallcap stocks filtered by marketcap & sector |
| Marketcap: All SmallCap Stocks (default-no microcap), Large, Mid-Range, Small & MicroCap |
| Sector: Tech, Finance, Energy, Staples, Retail, Industrial, Materials, Utilities & Medical |
|
Best Stocks Today 12Stocks.com |
© 2024 12Stocks.com Terms & Conditions Privacy Contact Us
All Information Provided Only For Education And Not To Be Used For Investing or Trading. See Terms & Conditions


One More Thing ... Get Best Stocks Delivered Daily!
Never Ever Miss A Move With Our Top Ten Stocks Lists
Find Best Stocks In Any Market - Bull or Bear Market
Take A Peek At Our Top Ten Stocks Lists: Daily, Weekly, Year-to-Date & Top Trends
Find Best Stocks In Any Market - Bull or Bear Market
Take A Peek At Our Top Ten Stocks Lists: Daily, Weekly, Year-to-Date & Top Trends
Smallcap Stocks With Best Up Trends [0-bearish to 100-bullish]: Bakkt [100], Deciphera [100], Phibro Animal[100], Heartland Financial[100], Sight Sciences[100], TPI Composites[100], Fulton Financial[100], PTC [100], PaySign [100], Cullinan Oncology[100], Richardson Electronics[100]
Best Smallcap Stocks Year-to-Date:
CareMax [510.31%], Bakkt [363.68%], Viking [305.7%], Alpine Immune[239.57%], Longboard [232.41%], Super Micro[208.09%], Avidity Biosciences[177.32%], Cullinan Oncology[165.18%], Arcutis Bio[162.38%], Hippo [142.48%], Stoke [124.43%] Best Smallcap Stocks This Week:
Deciphera [72.05%], Phibro Animal[21.45%], Heartland Financial[19.15%], MultiPlan [16.09%], Sight Sciences[14.39%], Pacific Biosciences[13.27%], Codexis [12.59%], TPI Composites[11.87%], Velo3D [11.5%], Children s[11.14%], Zevia PBC[10.97%] Best Smallcap Stocks Daily:
Bakkt [2486.94%], Deciphera [72.05%], Phibro Animal[21.45%], Heartland Financial[19.15%], MultiPlan [16.09%], Sight Sciences[14.39%], Pacific Biosciences[13.27%], Codexis [12.59%], TPI Composites[11.87%], Velo3D [11.50%], Children s[11.14%]